Technical analysis by ManiMarkets about Symbol QQQX: Buy recommendation (7/30/2025)

ManiMarkets
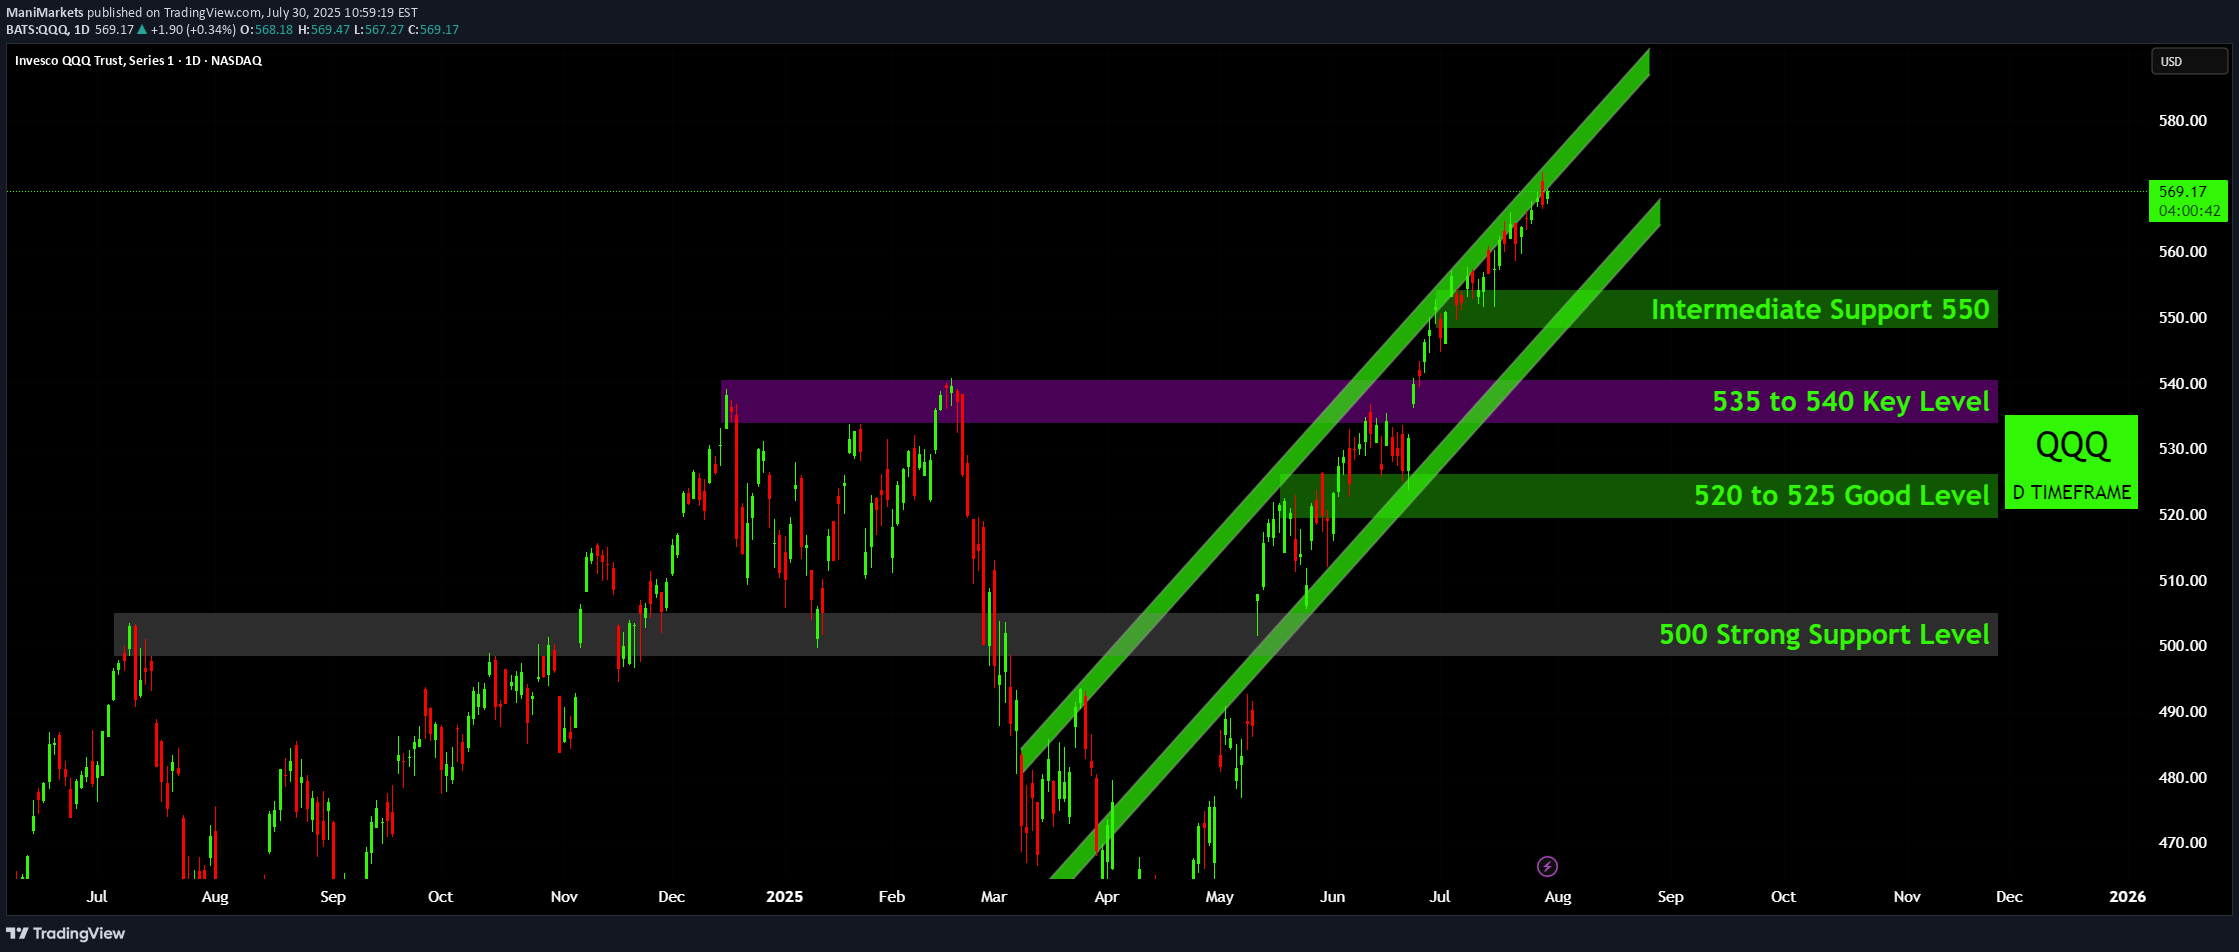
From a technical perspective, the QQQ is in a powerful and well-defined uptrend. The price action since the April low has been contained within a sharp ascending channel, confirming strong and consistent buying pressure. The market is currently testing the upper boundary of this channel, which often acts as short-term resistance and can precede a minor pullback or consolidation phase. A major bullish development was the recent breakout above the 535-540 price zone. This area had served as significant resistance from December through February, and its conversion into a new support floor is a textbook sign of strength. This level will now be a critical pivot point for the market. Should a pullback occur, the chart lays out a clear hierarchy of support levels. The first line of defense is the intermediate support at 550. Below that lies the crucial 535-540 pivot zone, followed by another support area between 520 and 525. The most significant long-term support rests at the 500 level, which was a major resistance ceiling for much of the prior year. The overall outlook remains bullish. As long as the price respects the ascending channel structure, particularly the lower trendline, the path of least resistance remains to the upside. Traders will likely view pullbacks toward these established support levels as potential opportunities to join the prevailing trend. A break below the channel and the 535 level would be the first signal of a potential momentum shift. Disclaimer: The information provided in this chart is for educational and informational purposes only and should not be considered as investment advice. Trading and investing involve substantial risk and are not suitable for every investor. You should carefully consider your financial situation and consult with a financial advisor before making any investment decisions. The creator of this chart does not guarantee any specific outcome or profit and is not responsible for any losses incurred as a result of using this information. Past performance is not indicative of future results. Use this information at your own risk. This chart has been created for my own improvement in Trading and Investment Analysis. Please do your own analysis before any investments.
