Technical analysis by CryptoNuclear about Symbol GRT: Buy recommendation (7/30/2025)

CryptoNuclear

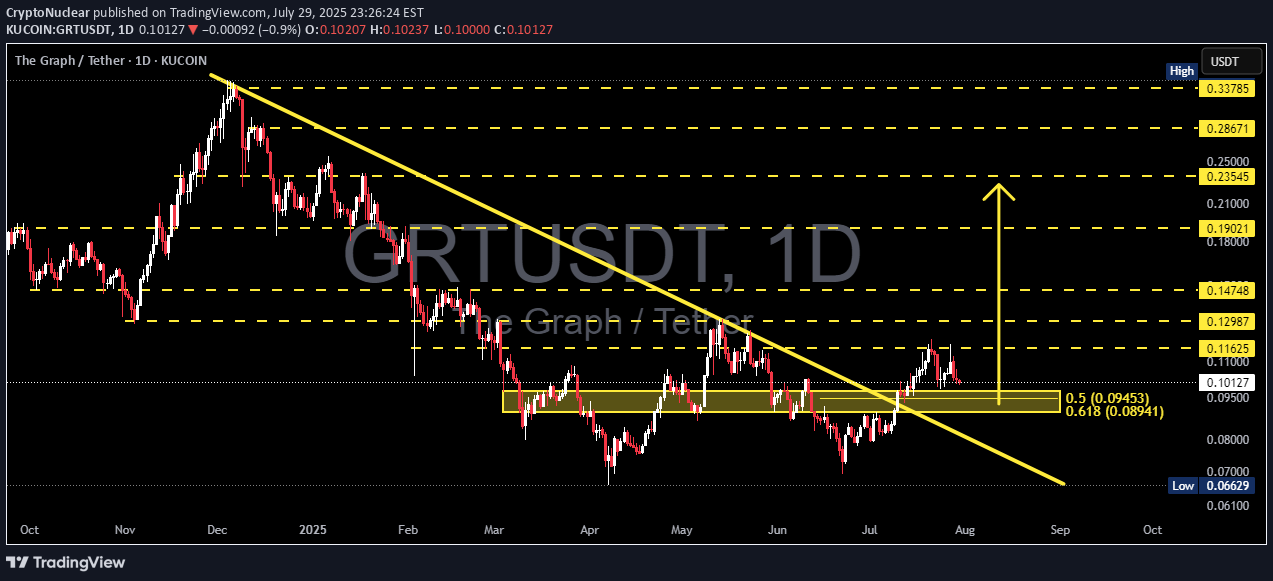
The GRT/USDT chart is currently at a critical technical juncture, presenting a high-probability setup for both breakout continuation or breakdown rejection. Here’s a breakdown of the key elements visible on the chart: --- 📐 1. Major Downtrend Breakout GRT has been in a long-term downtrend since its peak in late 2024, with a well-respected descending trendline acting as resistance. In mid-July 2025, the price broke above this trendline, signaling a potential trend reversal from bearish to bullish. While volume was moderate, the breakout is technically valid. --- 📊 2. Golden Pocket Fibonacci Retest Price is currently retesting the critical Fibonacci retracement zone: 0.5 = $0.09453 0.618 = $0.08941 This range is widely known as the “Golden Pocket”, a high-probability bounce zone during bullish continuation setups. Price is currently sitting inside this zone, which makes this a potential low-risk entry area. --- 🧱 3. Key Historical Consolidation Zone The area between $0.089 and $0.095 is not only the golden pocket but also aligns with a strong historical consolidation zone from April to June 2025. This level acted as both support and resistance, making it a key technical and psychological level. --- ⚔️ Potential Price Scenarios --- 📈 Bullish Scenario (Upside Potential): If price holds and bounces from the $0.089 – $0.095 support zone: 1. Initial resistance targets: $0.10185 to $0.11000 2. Followed by breakout targets: $0.11625 $0.12987 $0.14748 3. Medium-term bullish targets if trend continues: $0.19021 $0.23545 📌 Bullish Confirmation Signs: Bullish engulfing or strong reversal candle on the daily close. Increased volume on the bounce. RSI recovery from neutral (30–50) zone. --- 📉 Bearish Scenario (Downside Risk): If price fails to hold above the $0.08941 Fibonacci level: 1. A breakdown below support may trigger further selling pressure. 2. Key downside targets: $0.08000 (minor support) $0.06629 (previous swing low) 📌 Bearish Confirmation Signs: Daily close below $0.089 with strong bearish volume. RSI drops below 30. Strong rejection from resistance with bearish structure. --- 🧠 Pattern and Market Structure Insights Breakout + Retest: Classic setup where price breaks a long-term trendline and returns to retest the breakout zone. Fibonacci Confluence: The golden pocket aligns with previous price structure, reinforcing its strength. Hidden Double Bottom (Potential): If price holds, this may also form a subtle double bottom structure — a bullish continuation signal. --- 📚 Conclusion & Trading Strategy GRT/USDT is currently showing a technically strong setup, with a clean breakout followed by a meaningful retest at a key demand zone. 💡 If you're looking for a strategic long entry, this area offers low risk, high reward potential, provided you manage your stop-loss correctly. --- 🎯 Trade Idea & Risk Management Potential Entry: $0.089 – $0.095 Conservative Stop Loss: Below $0.088 Initial Target Zone: $0.101 – $0.116 Mid-term Target: $0.19 – $0.23 #GRT #GRTUSDT #TheGraph #AltcoinAnalysis #CryptoBreakout #TechnicalAnalysis #CryptoTrading #FibonacciLevels #TrendlineBreak #GoldenPocket #BullishSetup #BearishBreakdown #CryptoEducation #Altcoins