Technical analysis by Ibrahim_Trade786 about Symbol BTC: Buy recommendation (7/21/2025)
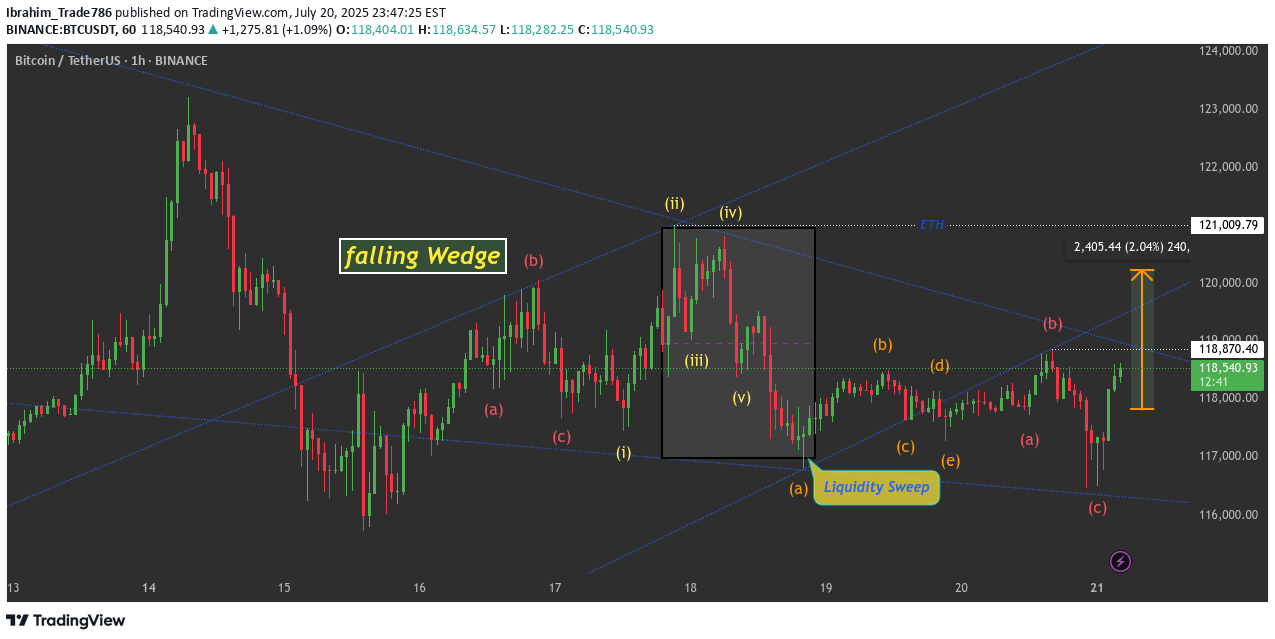
BTCUSDT Technical Outlook: Falling Wedge & Elliott Wave Correction Overview: BTC/USDT is displaying a potential bullish setup after a consolidation phase, marked by a falling wedge pattern and detailed Elliott Wave structures. Price action suggests the correction may be ending, paving the way for a new impulsive move. Key Highlights: Falling Wedge Formation: A classic bullish reversal pattern is evident, with price compressing between two downward-sloping trendlines. A breakout from this pattern could signal a trend shift to the upside. Elliott Wave Analysis: Impulse Wave (i-v): A completed five-wave move peaking near 121,000 suggests prior bullish strength. ABC Correction: Followed by a clear three-wave pullback with a liquidity sweep around 116,500—hinting at a possible bottom. Complex Structure: Post-ABC, the chart shows signs of further corrective waves—possibly a triangle or WXY formation—implying extended consolidation. Key Price Zones: Current Price: ~118,599 Resistance: 119,000 and 121,000 Support: 117,000–117,500 and the key liquidity zone at 116,500 Outlook: A breakout above the wedge with volume would confirm bullish continuation, aiming for previous highs. Failure to break out could lead to more sideways action within the complex corrective wave. The 116,500 liquidity sweep remains a critical support to hold for any bullish case. Note: Watch for volume confirmation and impulsive behavior from current levels to validate the end of the correction.
