Technical analysis by Mr_Zakrii about Symbol PAXG on 7/14/2025

Mr_Zakrii
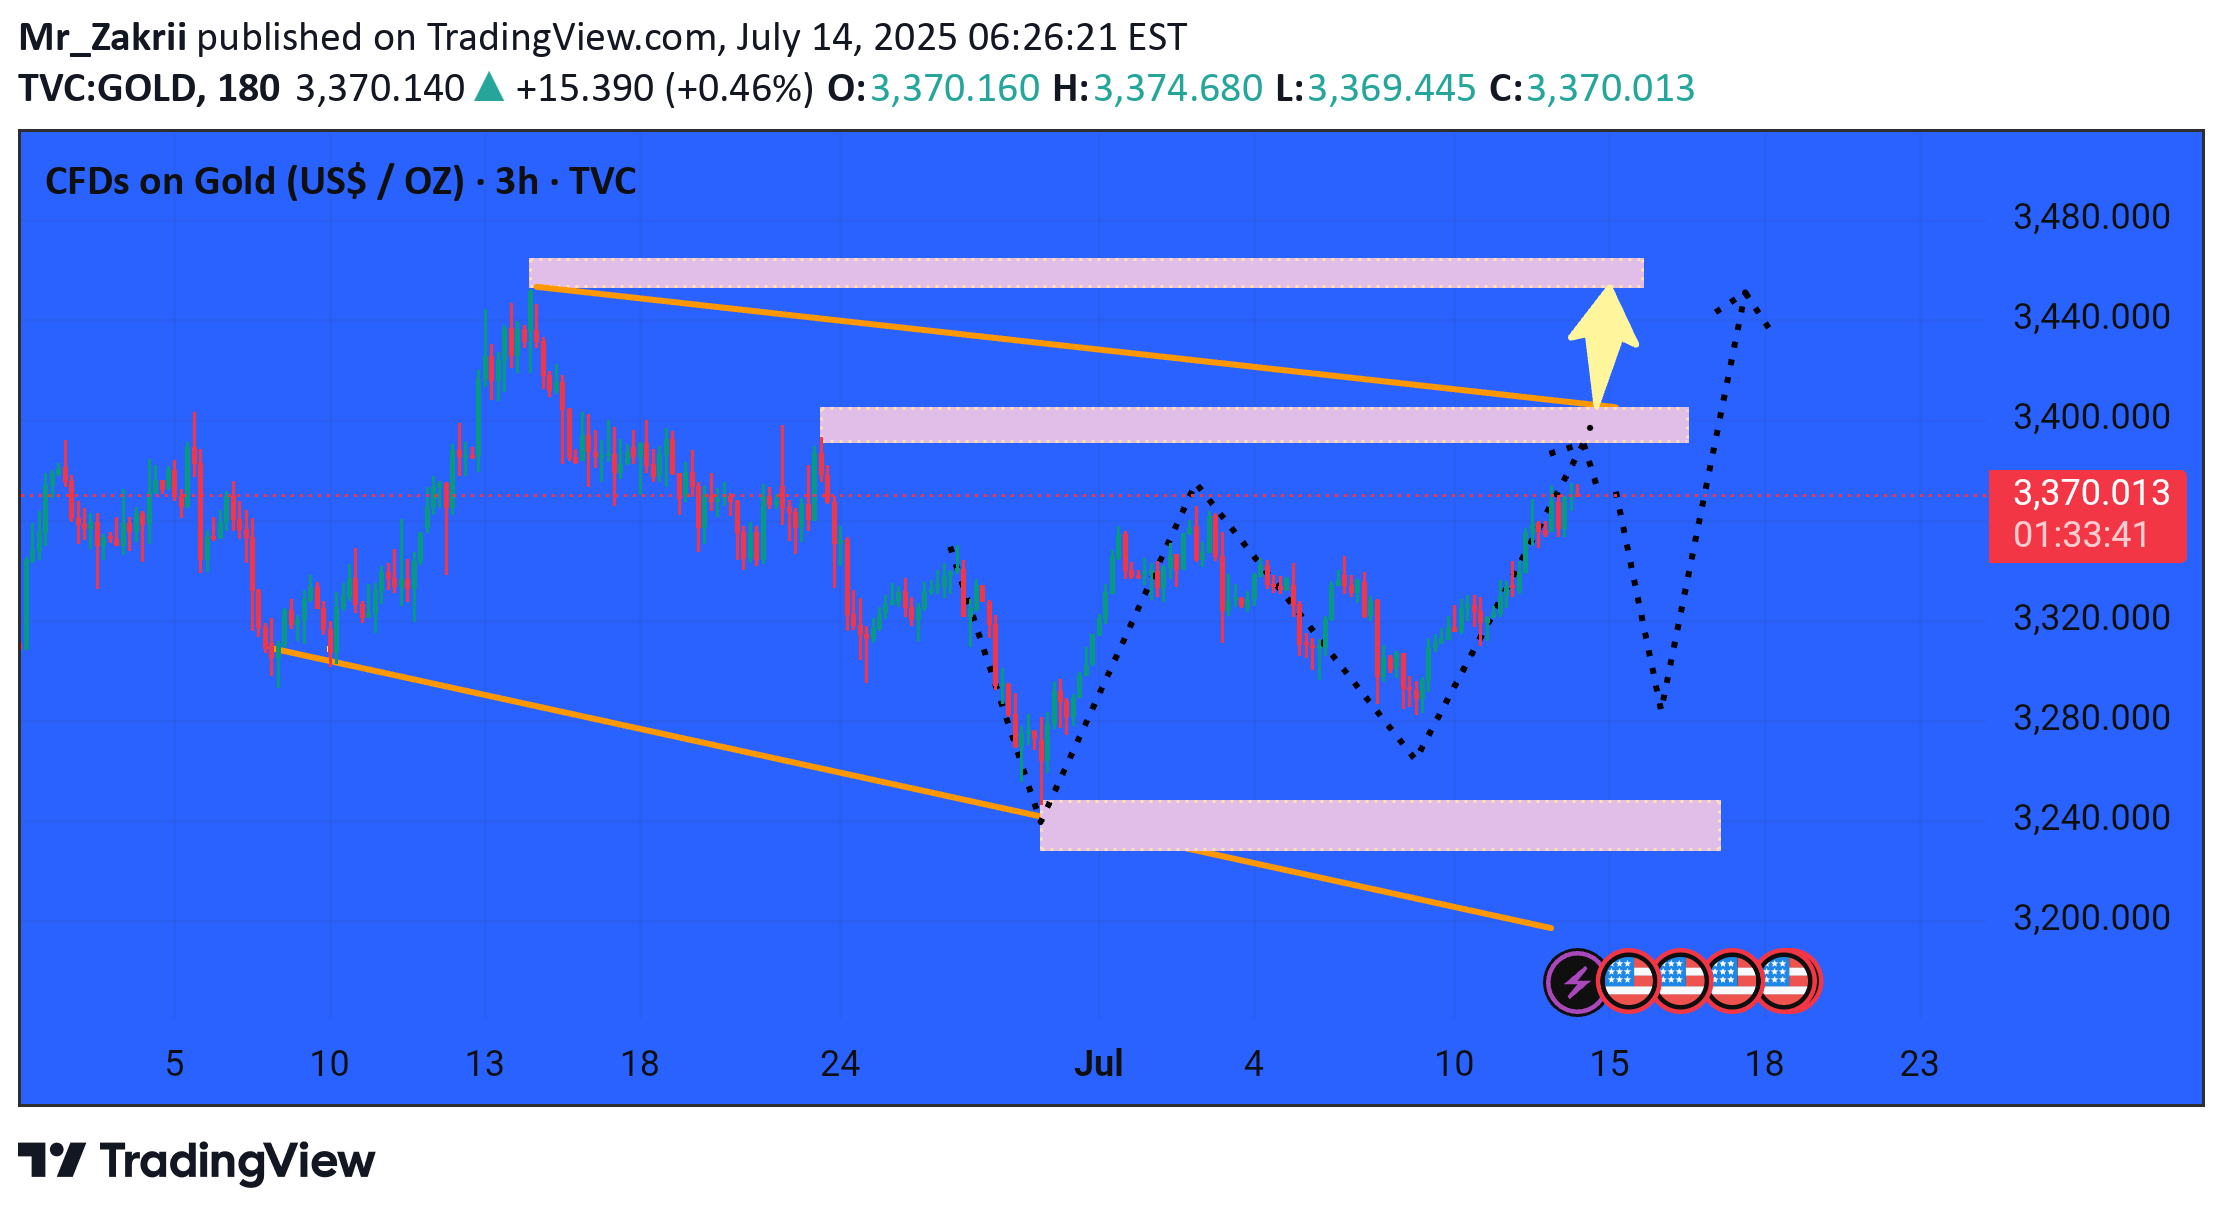
This chart shows a 3-hour analysis of Gold CFDs (XAU/USD) with a bullish outlook. Here's a breakdown of the key elements: --- 🔍 Chart Breakdown: Current Price: $3,370.420 Trend Context: The market was previously in a downtrend (highlighted by the descending orange trendline). Recently, the price bounced from a support zone around $3,230 and began forming higher highs and higher lows, suggesting a potential reversal. --- 📊 Key Zones: 1. Support Zone (~$3,230 - $3,250): Clearly respected and marked the beginning of the reversal. Aligned with the lower orange trendline. 2. Resistance Zones: First Resistance (~$3,360 - $3,375): Price is currently testing this area. A breakout here is critical for continuation. Second Resistance (~$3,420): This is the upper target zone, where the price may face profit-taking or reversal pressure. --- 🟡 Projection (Dotted Black Path): Indicates a short-term bullish continuation, possibly followed by a correction and then a retest of highs. Suggests a potential breakout above the current resistance zone with a target near $3,420. --- ⚠️ Key Notes: Multiple US economic events are marked near July 17–18 (red/blue icons), possibly influencing price volatility. The yellow arrow suggests bullish bias if price breaks the resistance convincingly. --- ✅ Conclusion: The chart is showing a bullish setup, with a likely scenario of a breakout and continuation towards the $3,420 level — provided the current resistance breaks. Watch for: Confirmation candle above resistance Volatility around the economic events Would you like a trading plan or risk/reward scenario for this setup?
