Technical analysis by CryptoNuclear about Symbol DCR: Buy recommendation (7/9/2025)

CryptoNuclear
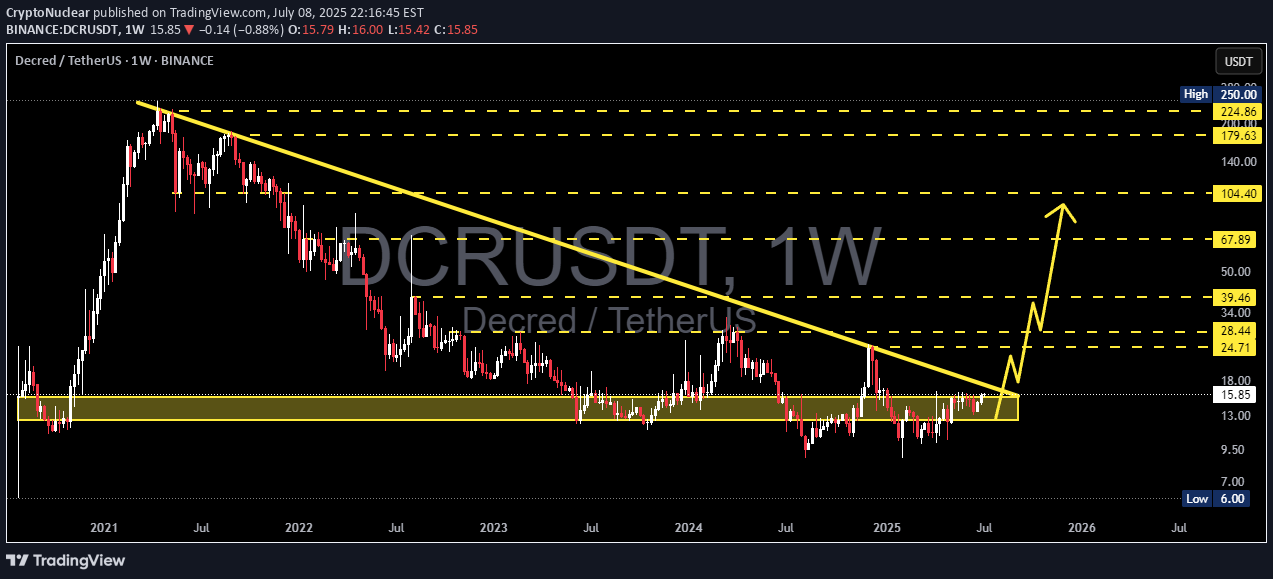
📍 Macro Overview:After being trapped in a multi-year downtrend since early 2021, Decred (DCR) has now shown signs of a major breakout from the long-term descending trendline. This moment could mark a pivotal shift from accumulation to expansion, offering a strong bullish macro setup.🧠 Technical Pattern & Structure Analysis:🔸 Dominant Pattern:A long-standing descending triangle has formed, with a solid demand zone between $11.00 - $13.00, tested multiple times over the past 2 years.While traditionally a bearish pattern, breaking to the upside here signals a reversal structure and the start of bullish momentum.🔸 Breakout Confirmation:Price has now clearly broken above the long-term downtrend line originating from the 2021 top.This breakout implies a macro trend shift, opening the door for a series of higher highs and higher lows.🔸 Strong Accumulation Zone:The yellow zone ($11–$13) has proven to be a high-conviction demand area, likely indicating institutional accumulation.✅ Bullish Scenario (High Probability):If the breakout holds and volume confirms:📌 Key Upside Targets:1. $24.71 → First major resistance2. $28.44 → Psychological level and historical S/R flip3. $34.00 → Local top from recent past4. $39.46 → Strong horizontal resistance5. $67.89 → 2022 resistance and bullish confirmation level6. $104.40 → Mid-term parabolic extension target📈 Likely structure: Breakout → Retest → Multi-wave rally upward.> Strategy: Ideal for Buy on Retest or Swing Long setups.❌ Bearish Scenario (Low Probability – Risk Management):If the breakout fails and price dips back below $13:Expect potential pullback to $11.00 - $10.00 supportWorst-case bearish continuation could revisit $6.00 (macro support)Would signal a false breakout and continuation of the bearish trend> Risk Strategy: Watch the volume – weak volume could imply a fakeout.🔍 Supporting Technical Signals:📊 Volume: Strong volume confirmation is essential for breakout validity📈 Indicators Supporting Bullish Bias:Weekly RSI hovering at neutral-bullish zonesPotential for a weekly EMA crossover (golden cross)OBV shows signs of increasing accumulation pressure🧭 Conclusion & Strategy Insight:This chart is signaling a high-conviction macro opportunity.Breaking out from a 3-year downtrend is a rare technical event that has historically led to exponential moves. The key is confirmation through volume and healthy consolidation above the breakout line.> "The longer the base, the stronger the breakout."#DCR #Decred #AltcoinBreakout #MacroReversal #CryptoChartAnalysis #BullishSetup #CryptoTechnicalAnalysis #TrendReversal #AltcoinSeason
