Technical analysis by mvjalili about Symbol ENA on 7/5/2025

mvjalili
WIF/USDT NeoWave Analysis (Daily, Range-Based Chart)
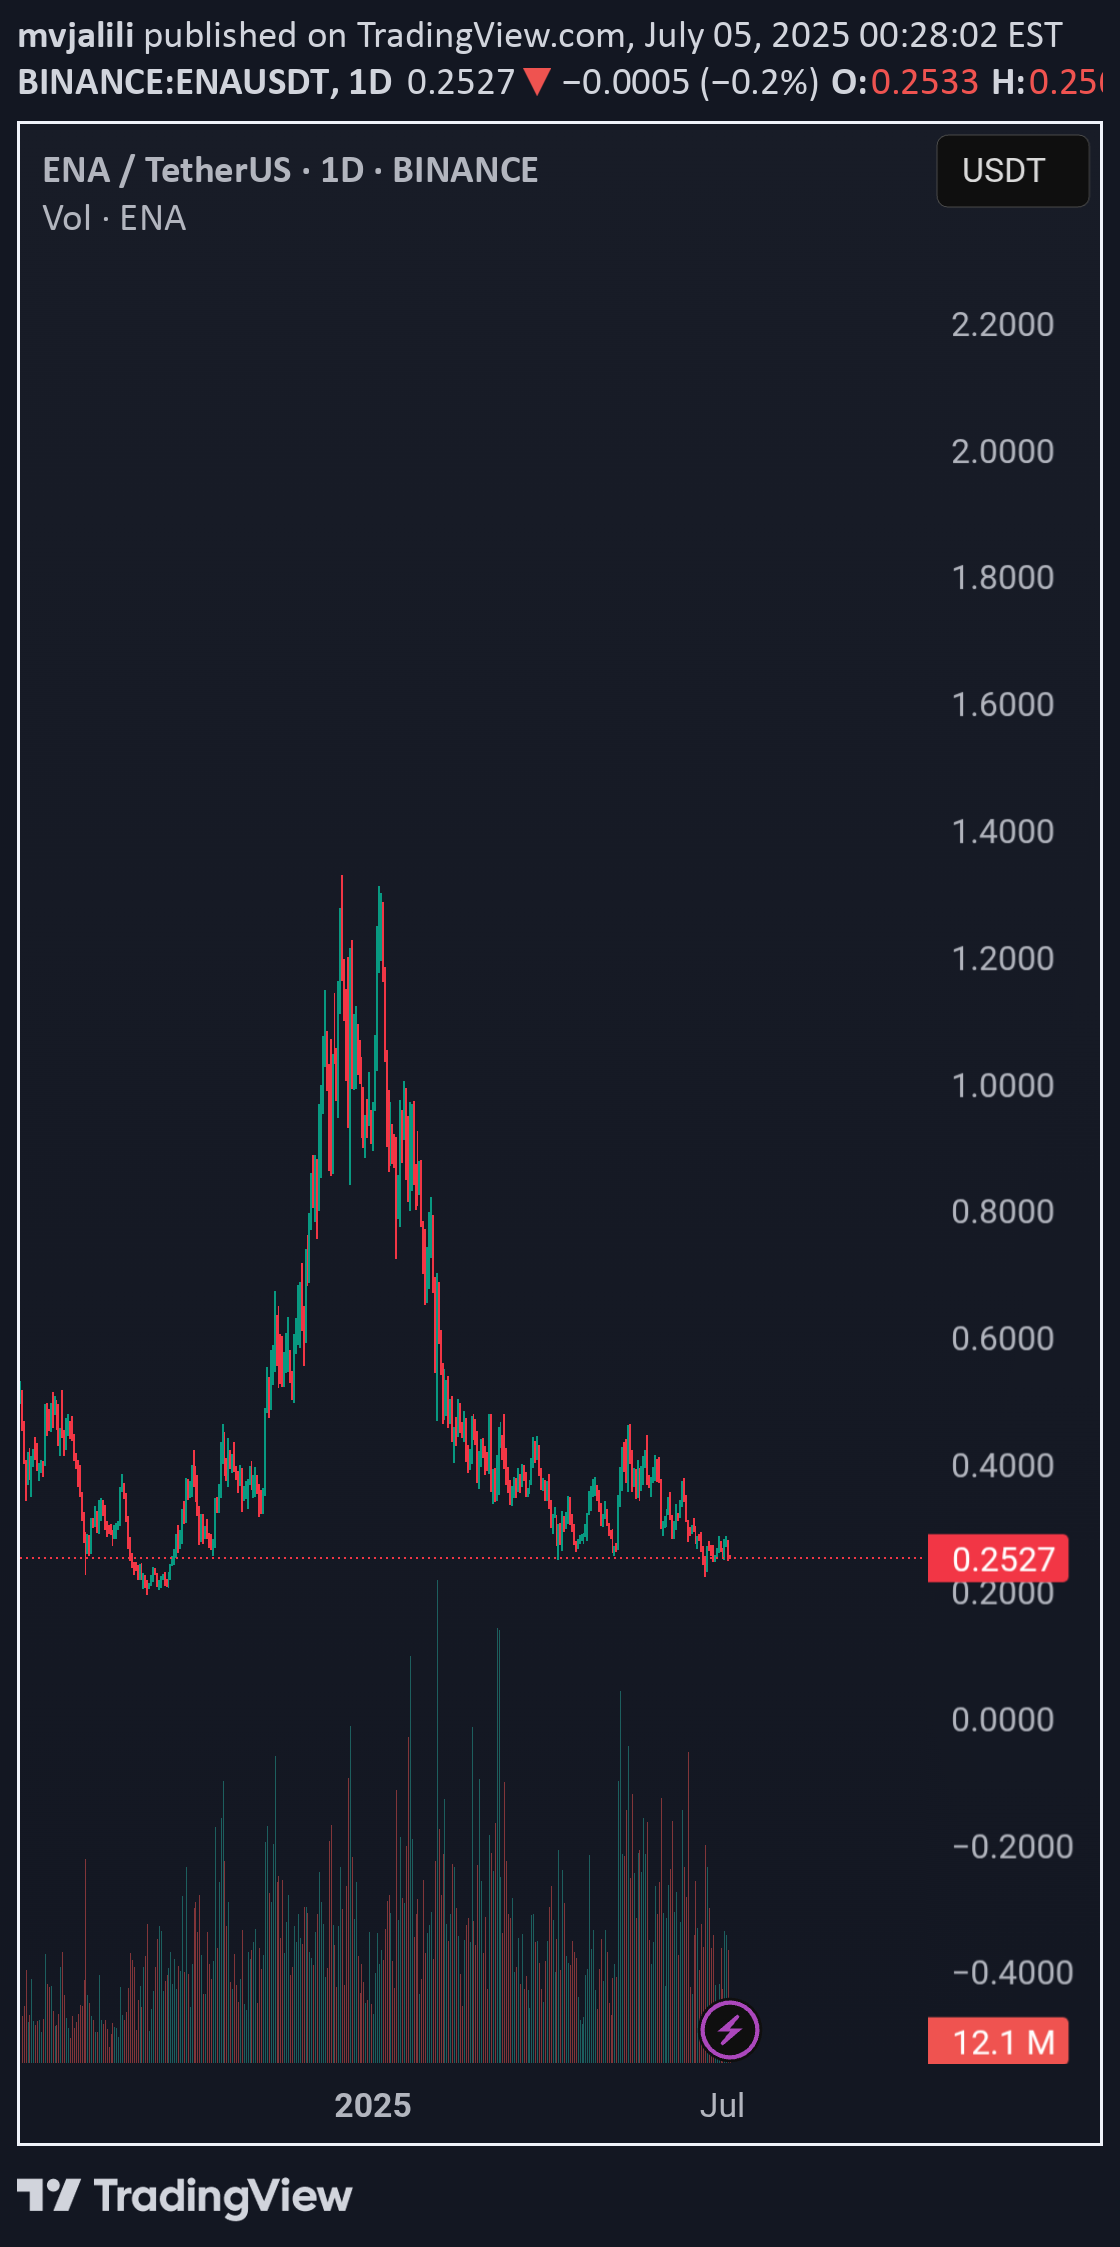
🔍 WIF/USDT NeoWave Analysis (Daily, Range-Based Chart)Based on a range-based (constant range bar) chart, this analysis follows Glenn Neely’s NeoWave principles for identifying complex corrective and impulsive structures:🌀 Wave Count Summary:1. Initial Impulsive Wave (Wave A?)Strong bullish movement with high volume around March–May.Likely the start of a terminal pattern (e.g., Leading Diagonal or Expanding Triangle).2. Prolonged Correction (Wave B?)Large, noisy sideways correction through the summer.Structure appears to be a complex correction (possibly WXY or WXYXZ).3. Second Sharp Rally (Wave C or E?)Intense bullish move in November, but quickly reversed.Could be Wave C of a Flat or Wave E of an Expanding Triangle.4. Final Drop (Wave C of Higher Degree)Strong decline into February 2025, likely completing the entire corrective pattern.Appears impulsive, suggesting a terminal wave.5. Current Phase – Base BuildingPrice consolidating near historical support (~$0.65–$0.85).Potential beginning of a new bullish cycle (Wave 1 or A forming).📌 Key Levels:Support Zone: $0.50–$0.65Resistance Zone: $1.10–$1.30Breakout above resistance with strong volume may confirm the start of a major bullish wave (Wave 3 or C).📈 Bias: Accumulation and base-building phase with bullish breakout potential if resistance