Technical analysis by Ahmtglr about Symbol DOT: Sell recommendation (7/5/2025)

Ahmtglr
DOTUSDT HAFTALIK
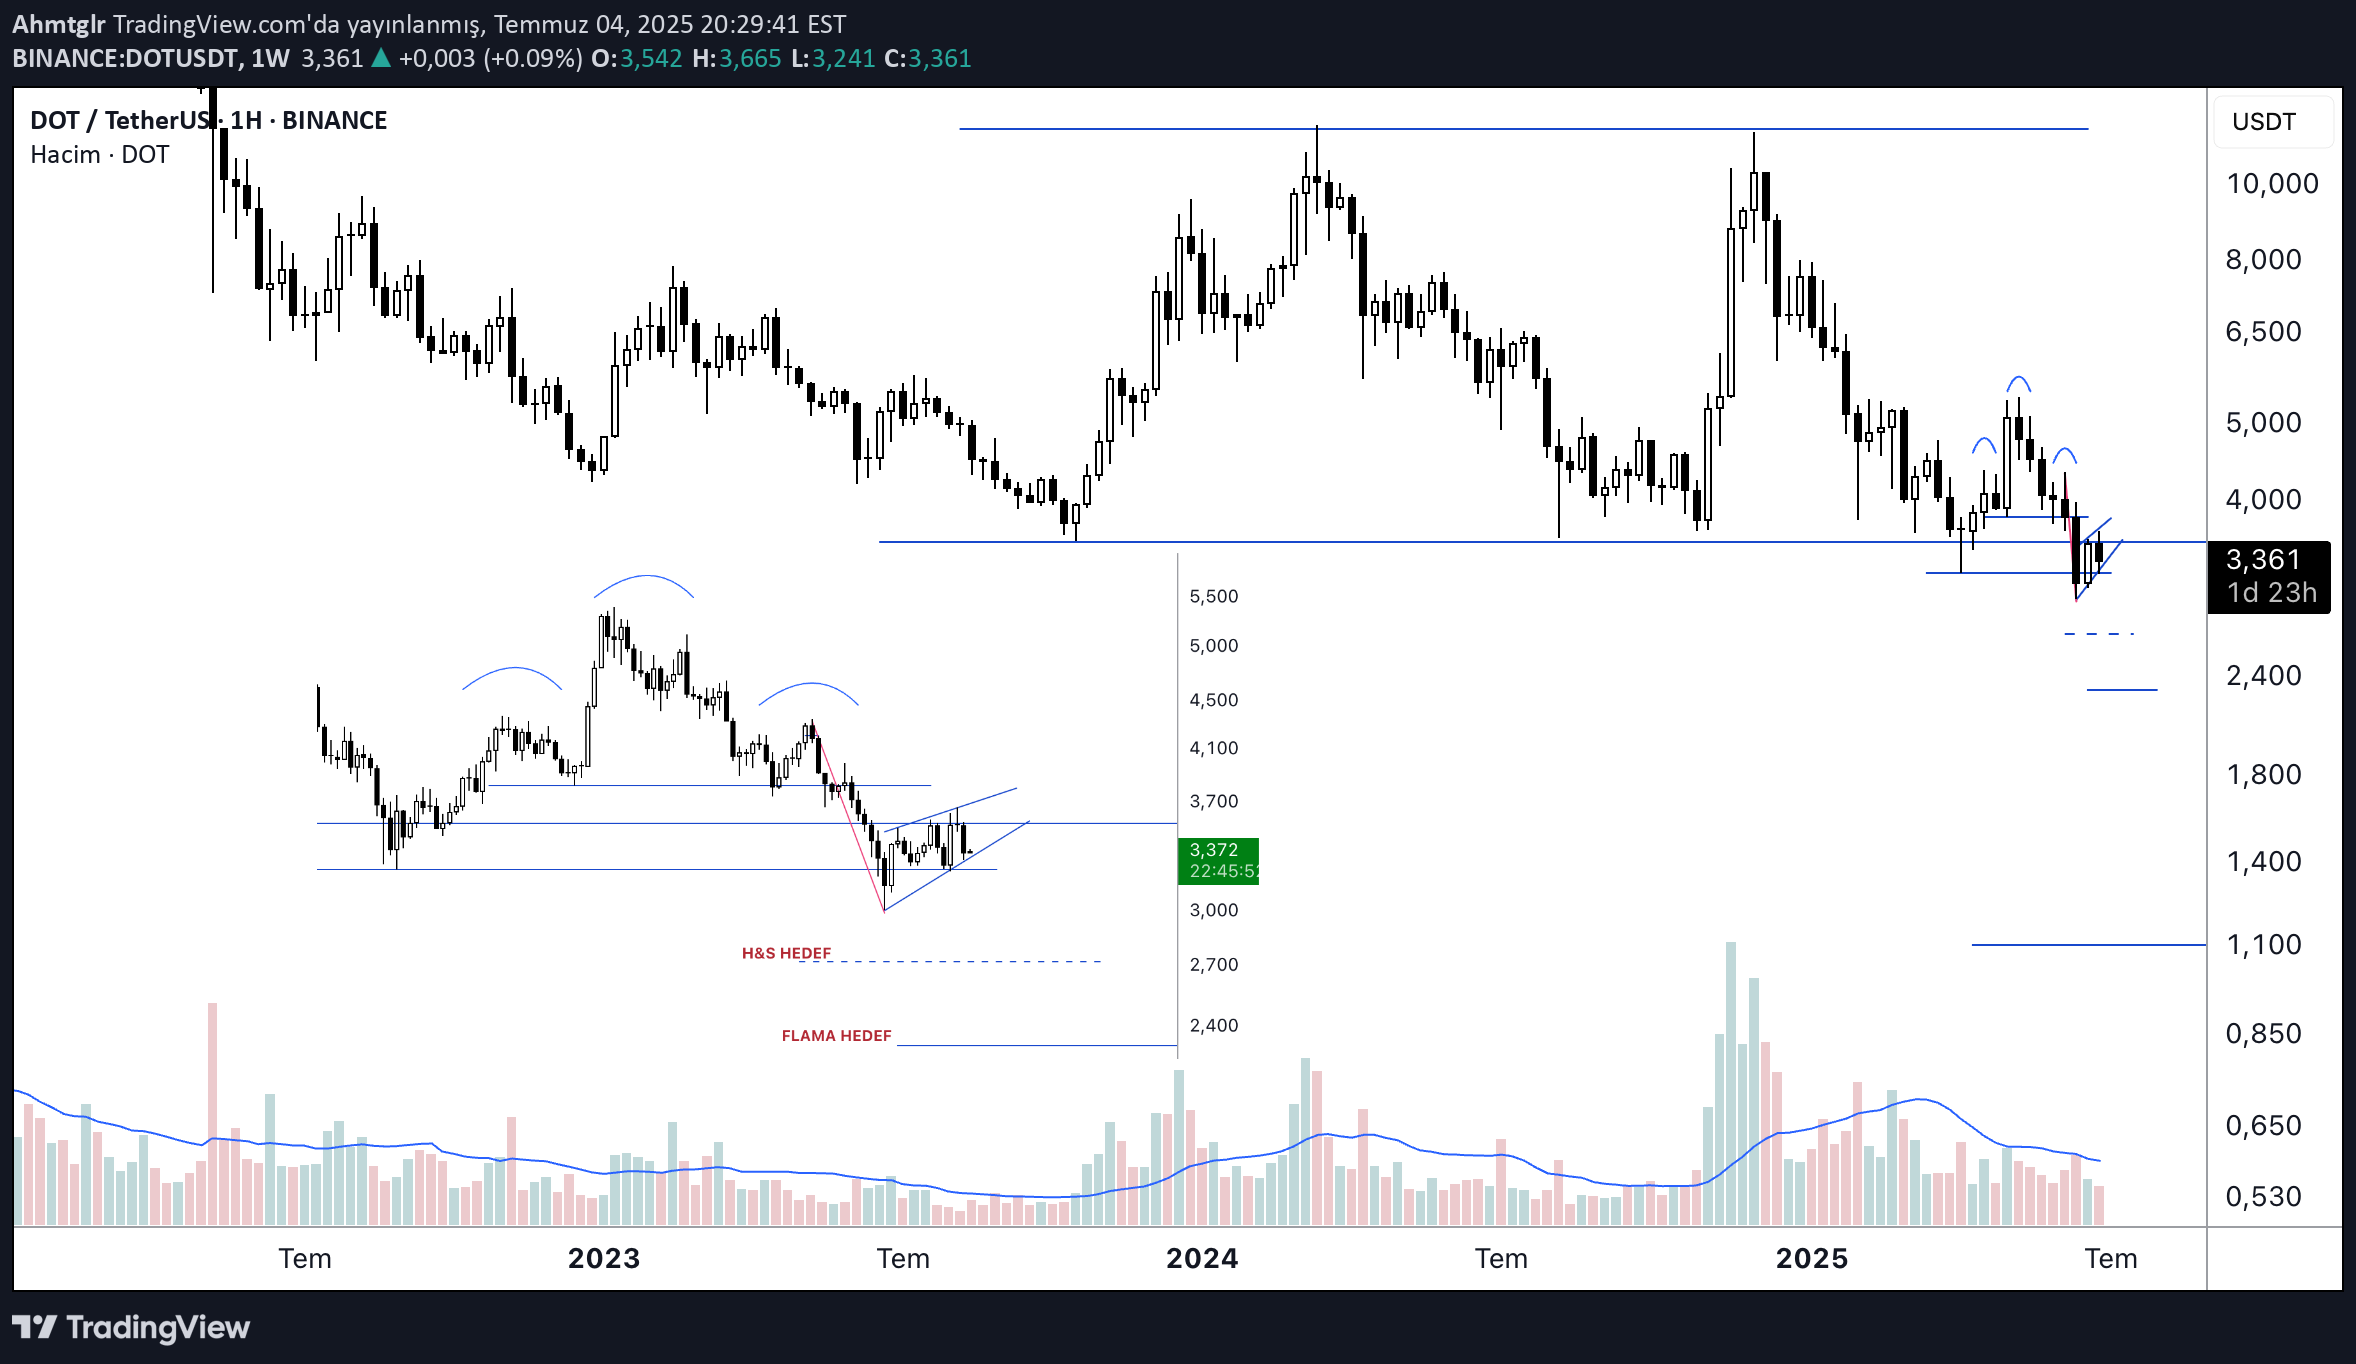
The visual on the sol side of the graph is added to show the formations formed in the daily graph. The price is still trying to achieve the target of the shoulder-head-omuz (OBO) formation in the daily graph. After the right shoulder was completed, the price was consolidated in the same area, while a pennant -like structure began to form. If the price breaks this flame down, another target may be under the obey target. However, the main thing is the formation of the horizontal cruise formed in the weekly graph. If the price, pennant and OBO falls further towards the targets, the appetite of the buyers may be completely closed and the price may want to move towards the target of the Range formation in the weekly graph. This means a decrease of approximately 67 % - 68 %.NOT: This analysis is only for follow -up purposes.