Technical analysis by CryptoNuclear about Symbol JTO: Buy recommendation (7/3/2025)

CryptoNuclear
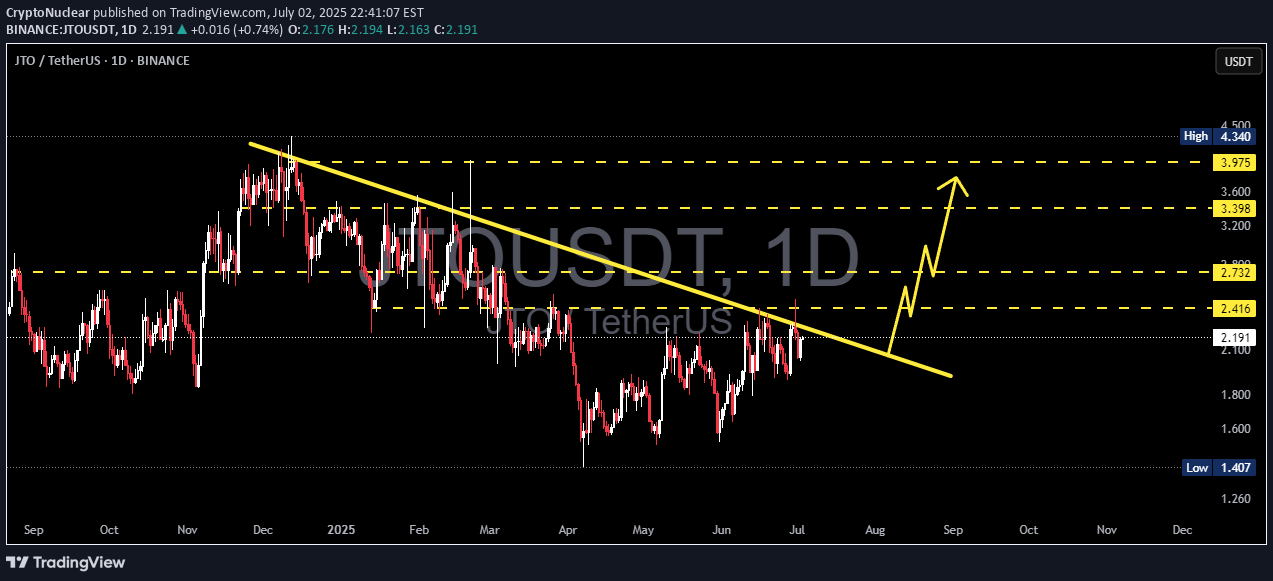
The chart indicates a major descending trendline resistance that has been tested multiple times since December 2024. Price action shows strong compression toward this resistance, suggesting a possible breakout moment.🔄 Pattern Analysis: Falling WedgeA Falling Wedge pattern is clearly visible:This pattern typically signifies bullish reversal potential when formed in a downtrend.Volume generally declines during the pattern and expands on the breakout.The wedge begins around $3.97 and narrows down toward $2.18, where the current price action sits.✅ Bullish Scenario:If price breaks above the wedge resistance convincingly:Breakout Confirmation Level: Around $2.42 (above the trendline and horizontal resistance)Targets after breakout:🎯 $2.73 – First major resistance🎯 $3.39 – Mid-level resistance from previous structure🎯 $3.97 – Key horizontal resistance and final wedge origin🚀 Potential extension to $4.34 (previous swing high)This would indicate a strong bullish trend resumption, especially if accompanied by high volume.❌ Bearish Scenario:If price fails to break above the wedge:Possible rejection at $2.42, leading to:🔻 Retest of support at $2.18🔻 Further decline toward $1.40, the significant previous lowA breakdown below $2.18 would invalidate the wedge breakout and confirm bearish continuation.⚠️ Key Technical Levels:Support Zones: $2.18 – $1.40Resistance Zones: $2.42 – $2.73 – $3.39 – $3.97 – $4.34Pattern: Falling Wedge (Bullish Bias)📌 Conclusion:JTO/USDT is approaching a make-or-break zone. A successful breakout from the wedge could trigger a strong bullish rally, while failure may lead to further downside. Traders should monitor for volume confirmation on the breakout to validate direction.#JTOUSDT #CryptoBreakout #FallingWedge #AltcoinAnalysis #CryptoTrading #BullishSetup #TechnicalAnalysis #ChartPattern #CryptoSignals
