Technical analysis by Johnson67 about Symbol PAXG: Sell recommendation (6/16/2025)

Johnson67
GOLD/USD suggests a potential reversal from point D downward.
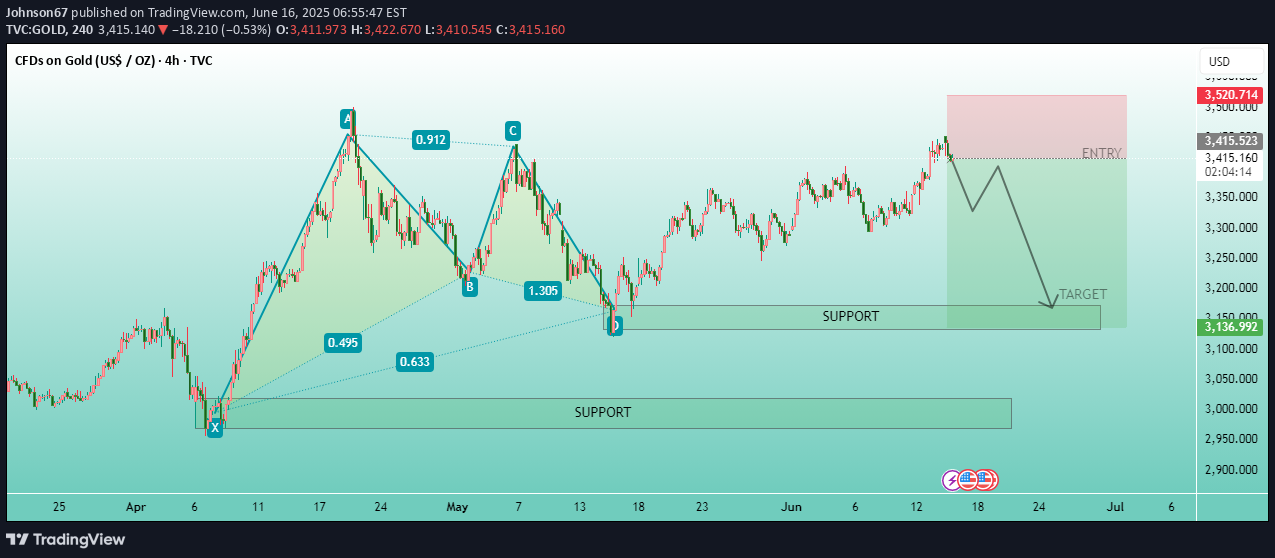
🟢 Chart InstrumentSymbol: CFDs on Gold (US$/OZ) – XAU/USDTimeframe: 4H (4-hour candles)Platform: TradingView---📐 Harmonic PatternThe chart displays a Bearish Gartley pattern, typically identified by the labeled points X-A-B-C-D.This pattern suggests a potential reversal from point D downward.Fibonacci ratios are visible:AB = 0.618 retracement of XABC = 0.886 retracement of ABCD = 1.27–1.618 extension of BCPattern completes at point D (where the short trade is suggested).---📉 Trade Setup (Short/Sell Bias)Entry Zone: Around 3,415 – 3,520 USD (highlighted red zone)Target Zone: Near 3,135 USD (marked “TARGET”)Stop Loss Zone: Above 3,520 USD (indicated in red box)Expected Movement: Sharp drop from resistance area to target support zone.---🧱 Support ZonesTwo key support levels are marked:1. First target zone at ~3,1352. Broader support range: 3,000 – 3,080These support levels are likely areas where price could reverse or consolidate after falling.---📆 Timeframe FocusThe projection extends toward Wednesday, June 25, suggesting this is a medium-term swing setup over the coming 1–2 weeks.---✅ SummaryPattern Type: Bearish GartleyAction Plan: Wait for price to hit entry zone (point D), then short with target at 3,135.Risk/Reward: Clearly defined with stop-loss and target zones350 pips runing we wait for more