Technical analysis by Johnson67 about Symbol PAXG: Sell recommendation (6/10/2025)

Johnson67
GOLD/USD expected to fall to a final target marked further down
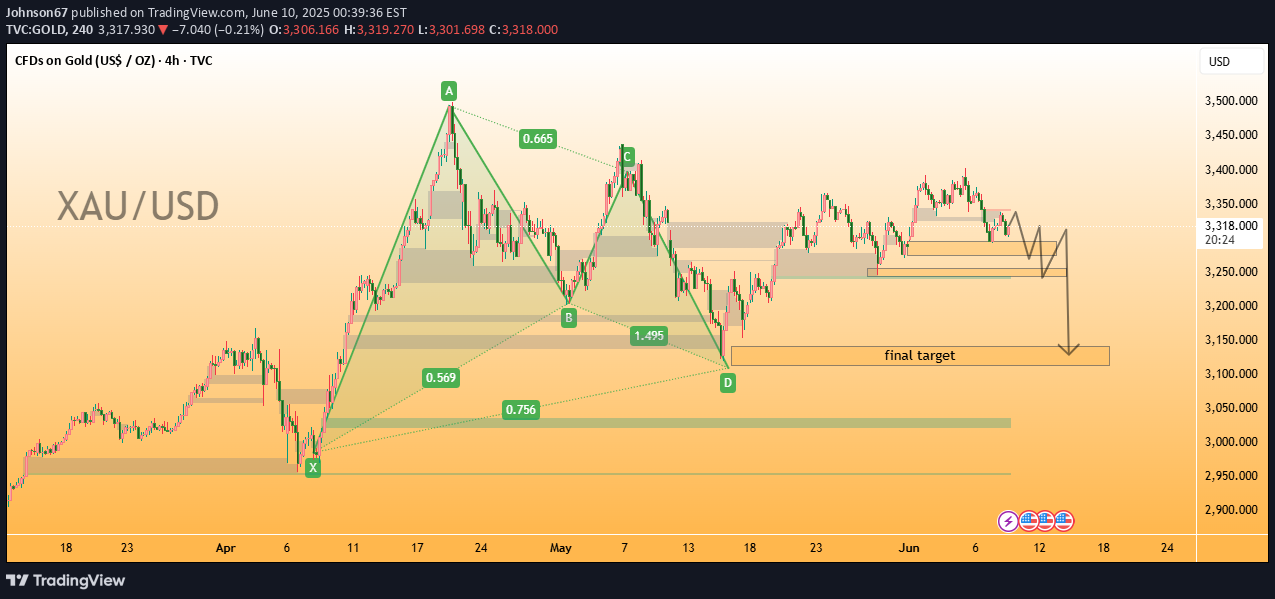
The chart shows a harmonic pattern (possibly a Gartley or Bat pattern), labeled with the points X, A, B, C, D.This suggests a potential reversal zone around point D.Fibonacci ratios are visible between the segments (e.g., 0.569, 1.495, 0.656), which are typically used in harmonic trading to validate the structure.3. Price Levels:Current price levels are:Sell: 3,316.766Buy: 3,317.136The price is located just below a resistance zone, with an apparent support zone below.4. Support and Resistance:Several horizontal support and resistance zones are marked on the chart.A key support level is noted, below which the price is expected to fall to a “final target” marked further down.5. Projection:A projected path is drawn in black, showing potential short-term consolidation or retracement before a drop to the final target area (around 3,150.000 or lower).6. Additional Interface Details:The platform in use is TradingView.The date range shown is from early April to mid-June 2025.The final arrow indicates a bearish outlook.Interpretation:This chart suggests a bearish trading plan for XAU/USD based on the harmonic pattern and key price levels. The trader appears to expect a retracement followed by a significant drop, possibly targeting the area labeled as “final target.”