Technical analysis by Johnson67 about Symbol PAXG: Sell recommendation (6/8/2025)

Johnson67
GOLD/USD Fibonacci levels drawn from a swing low to swing high.
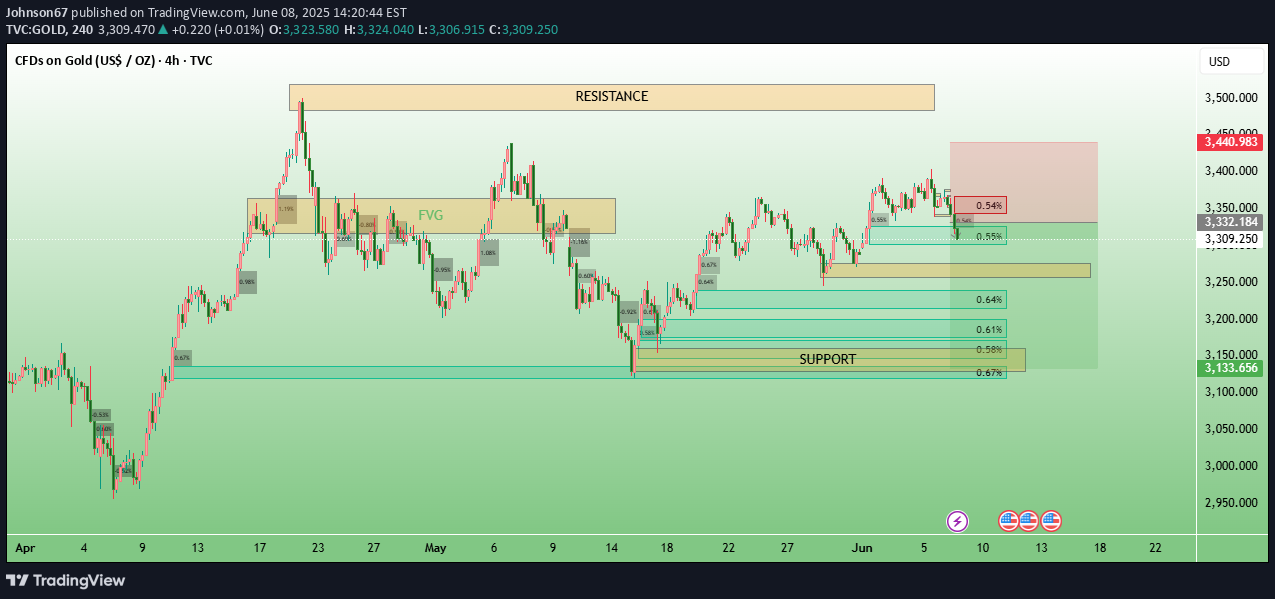
🔍 Technical Levels Identified1. Resistance ZoneHighlighted in red near the top of the chart.Approximate range: 3,400 – 3,480 USDThis zone has acted as a supply area previously; price rejected sharply after entering it.2. Support ZoneMarked in green at the bottom.Approximate range: 3,110 – 3,135 USDPreviously respected as a demand area and coincides with Fibonacci retracement levels.---📉 Fibonacci RetracementFibonacci levels drawn from a swing low to swing high.Key levels visible: 0.5, 0.618, and 0.786These align closely with the support zone, suggesting a confluence of buying interest around those levels.---🟪 Order Blocks & ZonesMid-level consolidation zone (tan box around 3,300) acts as a liquidity area or minor structure resistance/support.Price is consolidating slightly above this level, indicating possible accumulation or distribution.---🟩 Trade SetupA potential short trade is marked:Entry around: 3,340 USDStop Loss near resistance: ~3,440 USDTarget: Down into the green support zone (below 3,200)Risk-to-reward ratio (RRR) appears to be favorable (>2:1)---🔄 Market StructureHigher highs and higher lows formed until recent resistance.Potential shift in market structure if support breaks below the green zone, indicating bearish momentum.---📊 Volume & IndicatorsNo indicators (RSI, MACD, etc.) or volume are visible in this view.This is a price-action-based analysis with clear structural zones and Fibonacci confluence.---🧠 Strategic ImplicationBearish bias in the short term due to the rejection from resistance and presence of a short trade setup.Watching for confirmation (e.g., bearish engulfing candle, break of structure) before executing the short.