Technical analysis by RunMyBots about Symbol PAXG: Buy recommendation (6/6/2025)

RunMyBots
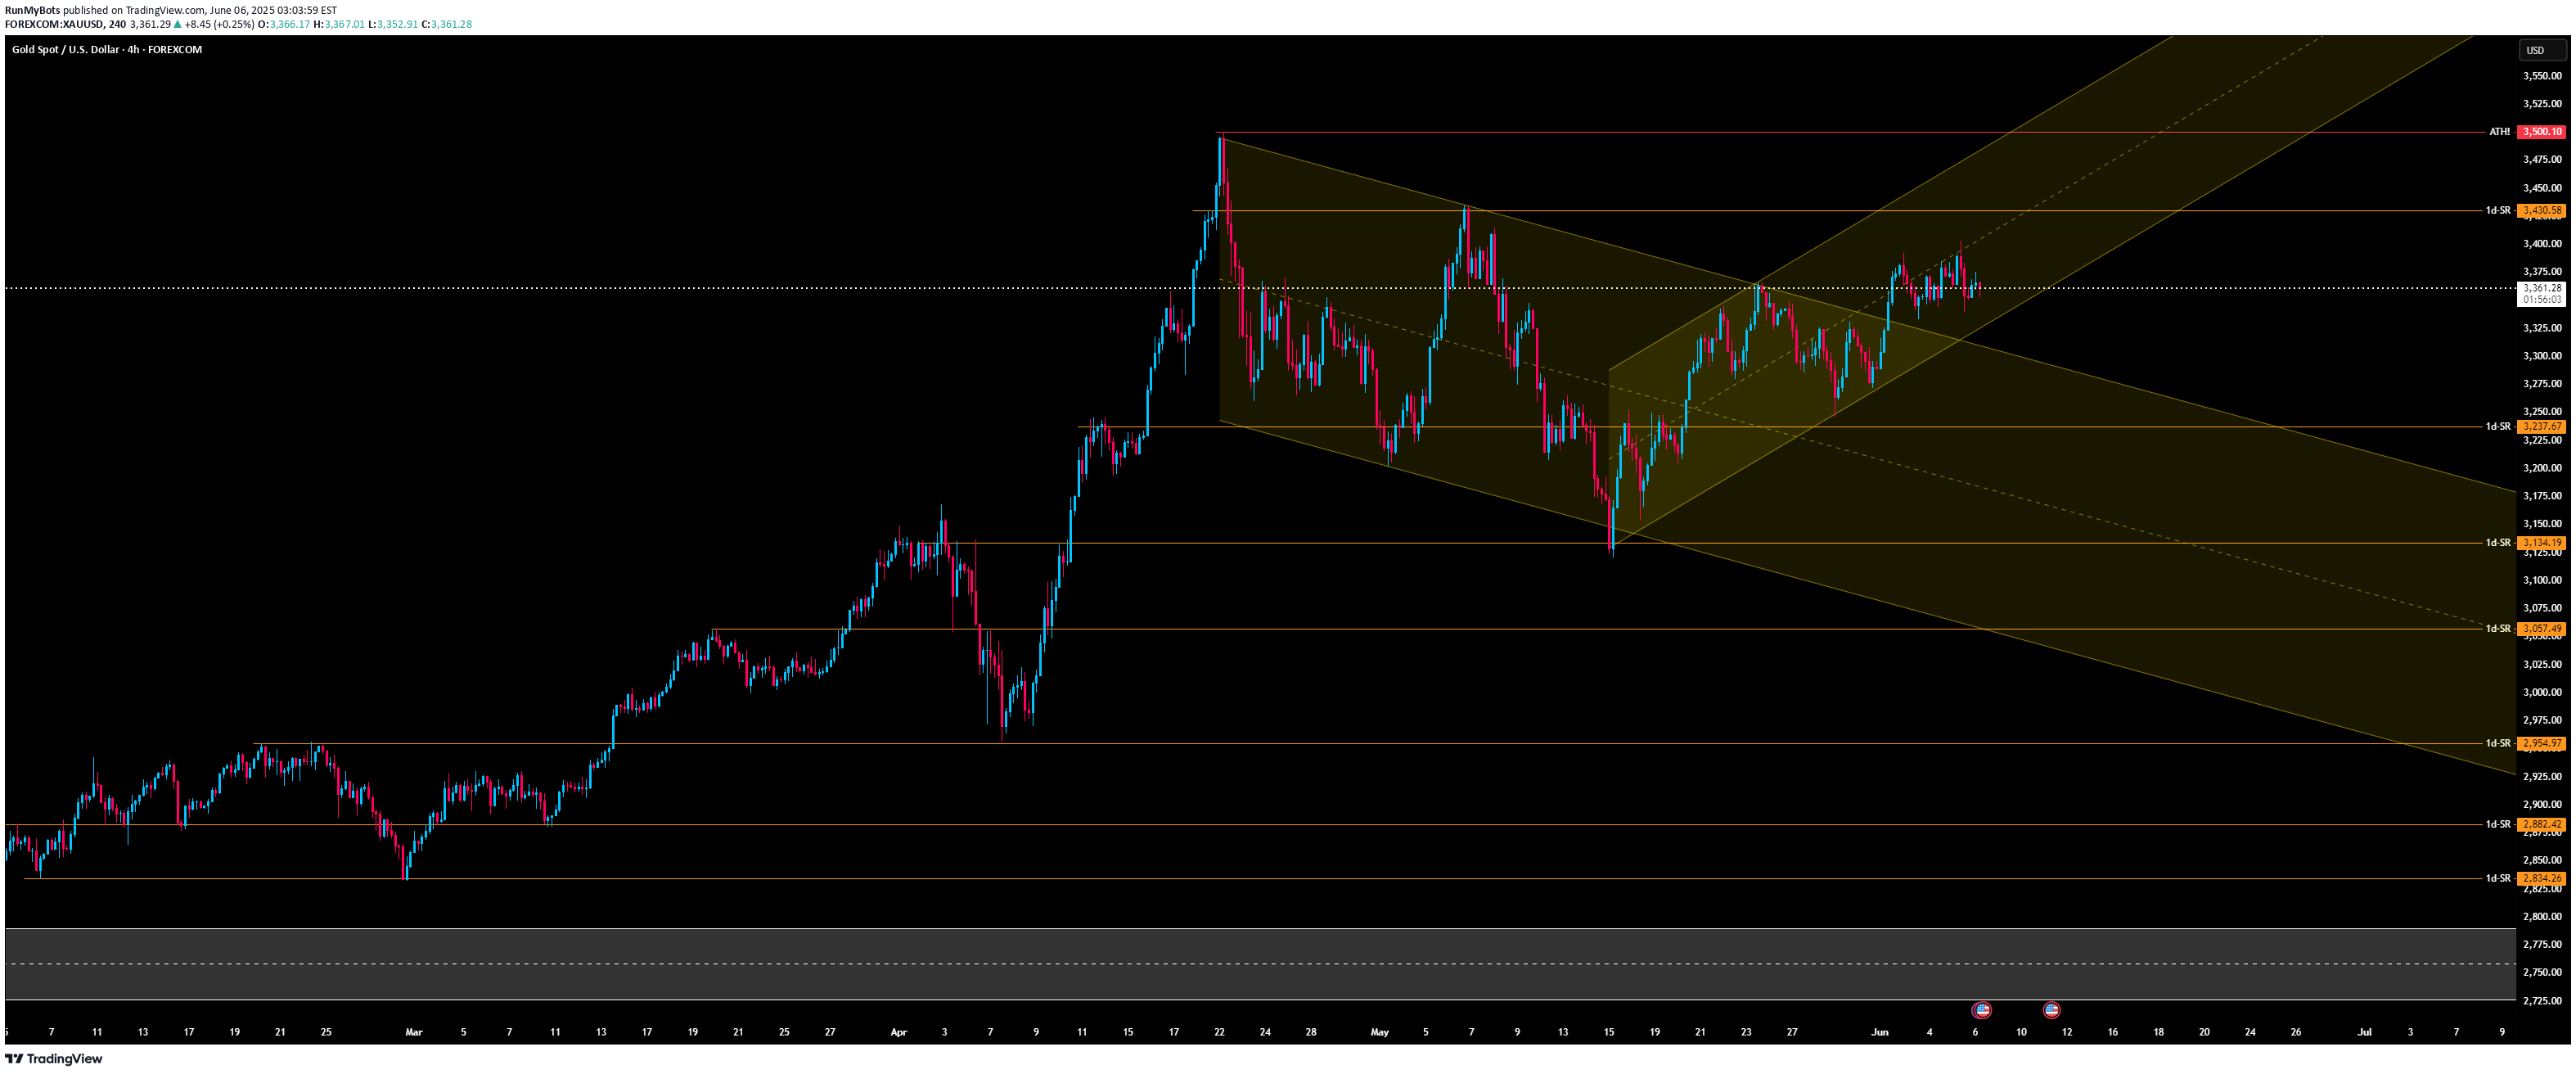
The current H4 chart structure shows that price has recently broken out of a descending channel and is now trading inside a potential ascending channel. This breakout indicates a possible shift in market sentiment from bearish to bullish. Key Observations: Downtrend Break: The previous bearish channel (highlighted in yellow) has been broken to the upside, suggesting that selling pressure has weakened. New Bullish Channel: Price is now respecting a newly formed upward-sloping channel, indicating buyers are gaining control. Support/Resistance Levels: Strong resistance at $3,430 and the ATH (All-Time High) at $3,500.10. Immediate support near $3,287, followed by a stronger zone at $3,114. Below that, key levels include $3,057 and $2,965. Forecast Scenario: Bullish Case: If price holds above the $3,287 support and stays inside the bullish channel, a retest of the $3,430 resistance is likely. A break above this level could open the path toward the ATH at $3,500. Bearish Case: If price fails to hold the current level and breaks back below $3,287, a move toward $3,114 or even $3,057 becomes probable. A breakdown below these levels would invalidate the bullish channel and could resume the downtrend. Conclusion: The market currently shows early bullish momentum, but confirmation above $3,430 is required for continuation. Traders should watch price behavior closely around support levels to confirm whether buyers can sustain this upward pressure.
