Technical analysis by arash.ne about Stock عیار on 3/24/2025
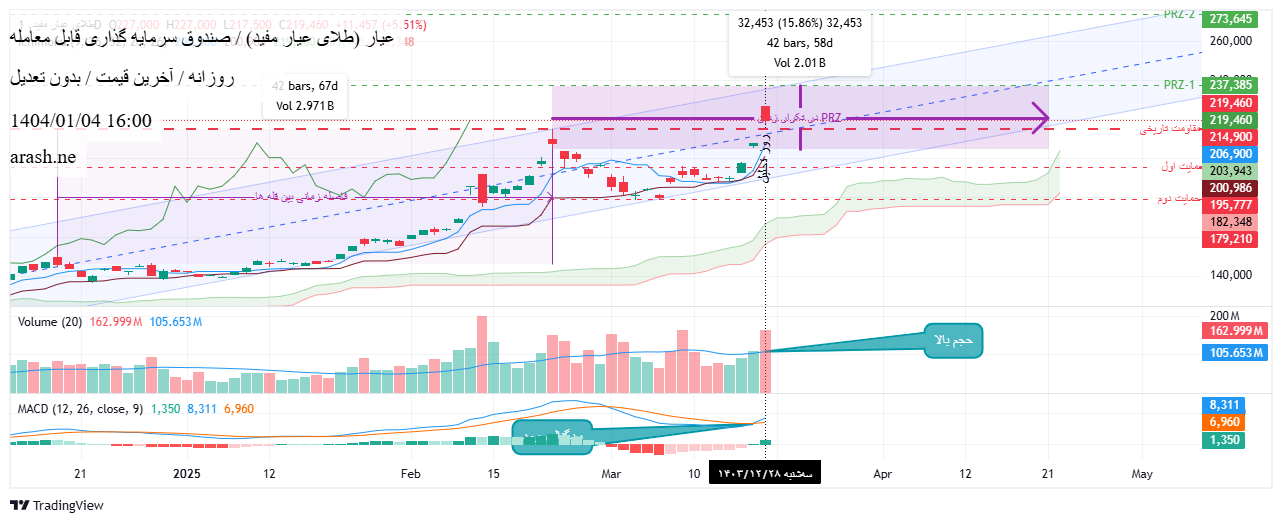
This analysis is the previous analysis of the previous analysis to the address below https://rahavard365.com/posts/15585516 As can be seen in the previous analysis, the price is out of the short -term descending channel and is on the way to the long/mid -term channel. So the previous analysis of the degree of validity is abolished and requires reforms In the last four candles, the candles start from the previous one but do not have a strong body. The last day candle is a strong descending candle that may be in response to two ascending candles before it. The power index (which is not plotted due to the limitation) is over seventy in the sellers' saturation scope, which is in line with the last day candle. But the divergence between this indicator and the price did not look at me, and a look at the volume of transactions shows that transactions are still in high level. Ichimoko also confirms the uptrend for the price why the entire chart is high, but the candles still do not have the power to comment. Tenxannon and Kijonsen are climbing with a steep slope, so one can expect a sharp climb, but it should not be forgotten that the price is still in response to its historical resistance. So we still have two possible scenarios. The first scenario is that the successful price did not effectively pass the resistance and re -modified, in which case the historical resistance preserved its role, and the next probable goal was the first support in the 195,000 to 196,000 range and the second support in the 180000 range. The second scenario is to pass the price out of historical resistance and give it a supportive role, so there is no choice but to guess the potential points of return as usual using Fibonacci techniques and hope to make the right guesses. What is derived from my paintings is one goal of 237000 and the other 273000 A look at the time gap between the summit and shows that the peaks have recently occurred between 20 and 40 days, so if we were to criterion for 40 days from the previous historical peak, it would probably be the next summit in early May. On the diagram at this time interval, the first goal, which was 237,000, is more likely. Which scenario only specifies time (maybe even a third scenario that has not happened), but between these two scenarios, if we fight the trend and now accept the upward trend given the high volume of transactions, in my opinion, the weight of the second scenario was slightly higher. Summary: If you have a share, you are certainly not at a loss, but if you have the misfortune of your purchase at the historic peak or around it, you are in danger, so you can sell or keep the share depending on whether you are risky or not. If you don't have a share like me, the matter may be complicated because the market has not yet reached its certainty and there are agreement and disagreement to climb the price, so if you are a risky trader, buying a stupid job will not seem to be a stupid job, but if you are a cautious trader, you will still have to wait for the market to clarify.
 Rahavard