Technical analysis by Finance City about Symbol BTC on 4/8/2025

Finance City
اموزش اندیکاتور SAR / قبل از همه متوجه شو تغییر روند داریم
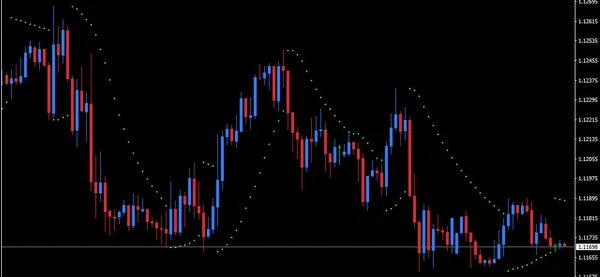
📊 Parabolic SAR: Technical Analysis Tool and Parabolic Price SAR is a technical analysis indicator that is mainly used to identify stops and change the direction of the trend. In fact, SAR stands for "stop and reverser" means "stopping and reversing". This indicator creates a contributing or parabolic path that falls below the asset price, and in the downtrend, high prices. The price crossing of this line can be seen as a buy or sales signal as well as the trend change. History J. WELLES WILDER, the creator of the SAR parabolic, introduced the indicator in his book "New Concepts in Technical Trading Systems". Published in Year 2, this book contains several classic indicators such as the relative power index (RSI), the real domain average (ATR), and the Oriental Motion Index (DMI). As other indicators mentioned, the SAR parabolic has a special place in the technical analysis. We have adopted how to calculate the main SAR parabolic algorithm as described by J. WELLES Wilder. The following is the general steps of calculating this indicator: The first day of entry or change: SAR is the first day of the previous EP (critical point); in the uptrend: EP is equal to the highest recorded ceiling (or the lowest price in the previous sales transaction). And we calculate the current day and multiply it by AF. Then add the result to the current SAR until the SAR will be achieved the next day. The initial amount of the AF is usually 0.02 and if the price of a new peak, the AF value will be added and limited to 0.2. The new floor is increased at a maximum of 0.2. Final constraints: In the uptrend, SAR should not be higher than the lowest price of the day before or the previous day. In the downward trend, the SAR should not be lower than the highest price of the day before or the previous days. If the calculation is out of this range, the new value should be used (lower or higher). SAR pass, the probability of change (from up to rising to descending) is issued. In the downtrend, the price crossing the top of the SAR can indicate the reversal of the trend and the onset of the uptrend. Many traders use the price of the parabolic line to determine the entry points, exit and other orders. Transaction not to be used; Rather, combine with indicators such as DMI or RSI so that its process and strength can be comprehensively measured. The SARP summary is a compact and useful tool that uses time and price, direction and timeframe. Although this index is very effective in determining the point of direction, it is best to use along with other indicators because of the restriction on the actual power measurement. Reminder: Always use several confirmations and use proper risk management before entering the transaction. Be successful and use accurate analysis for your trading decisions! 🚀📈