Technical analysis by seyefactory about Symbol PAXG: Sell recommendation (4/1/2025)

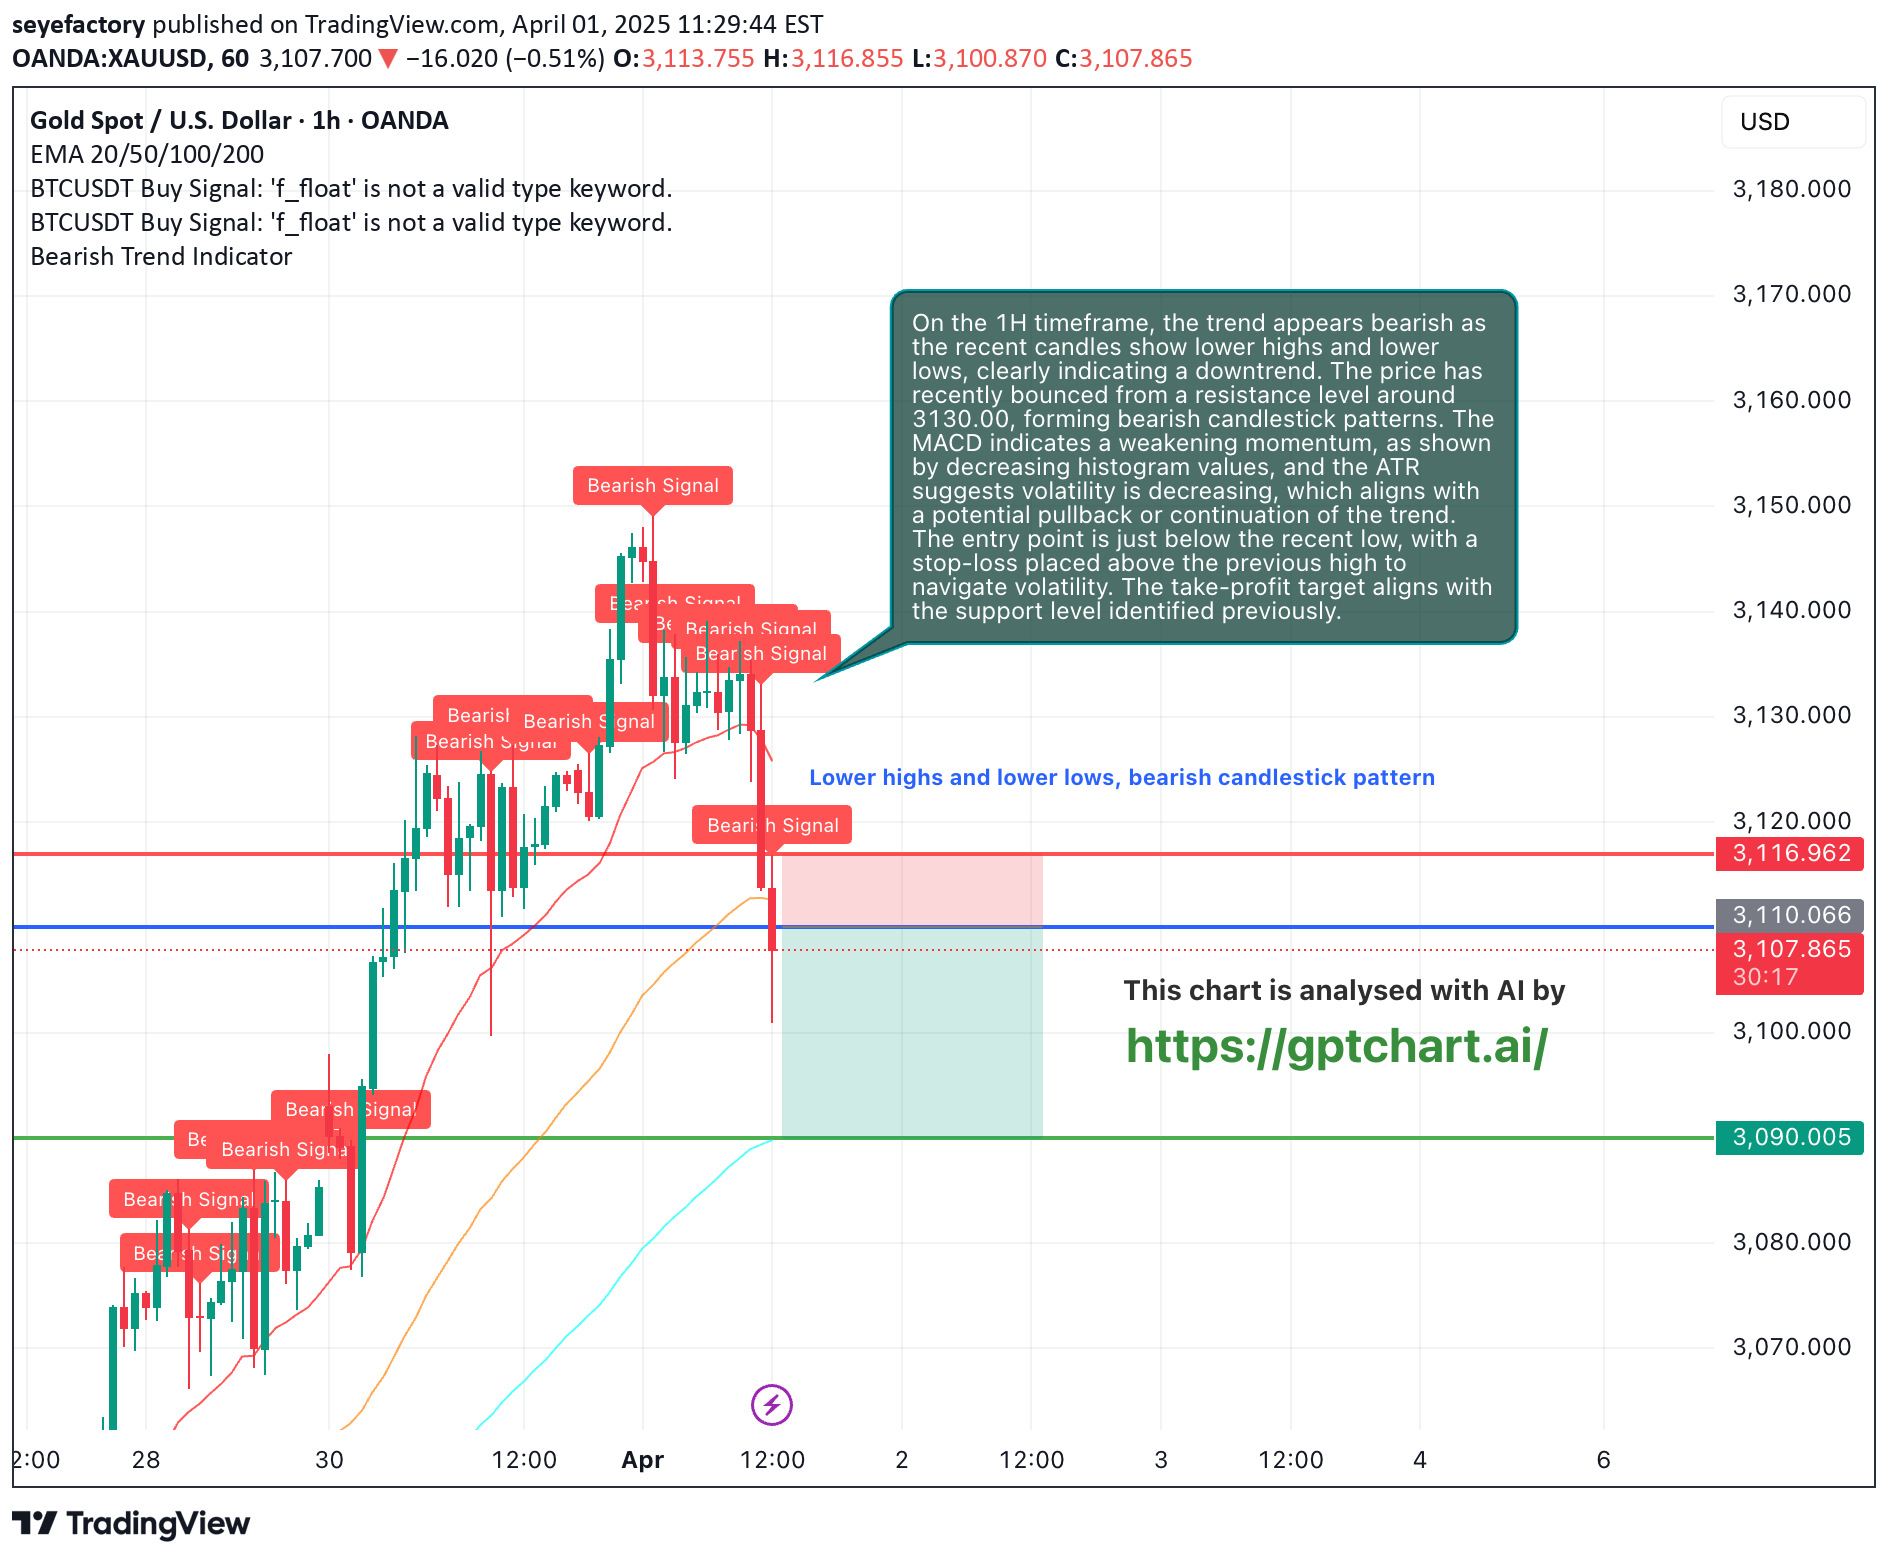
On the 1H timeframe, the trend appears bearish as the recent candles show lower highs and lower lows, clearly indicating a downtrend. The price has recently bounced from a resistance level around 3130.00, forming bearish candlestick patterns. The MACD indicates a weakening momentum, as shown by decreasing histogram values, and the ATR suggests volatility is decreasing, which aligns with a potential pullback or continuation of the trend. The entry point is just below the recent low, with a stop-loss placed above the previous high to navigate volatility. The take-profit target aligns with the support level identified previously.Entry Price:$3110.0000Stop Loss:$3117.0000Take Profit:$3090.0000Risk-Reward Ratio:2Confluence: Lower highs and lower lows, bearish candlestick patternIndicators: ATR, EMA, MACD
