Technical analysis by TradeGeniusPro about Symbol PAXG on 10/18/2023

TradeGeniusPro
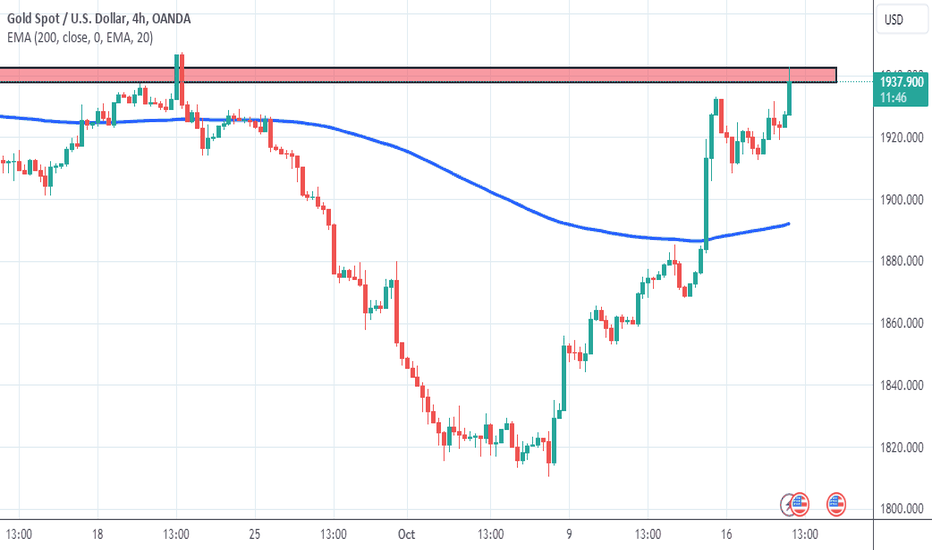
In the dynamic world of trading, spotting key price levels and breakouts can lead to profitable opportunities. We've observed a notable event on the H4 (4-hour) chart of Gold: a strong resistance breakout followed by a price test at the 1938 level. Let's keep it simple and explore this setup. Chart Setup: Asset: Gold Timeframe: 4-Hour (H4) Event: Resistance Breakout and Retest Key Observation: The H4 chart for Gold shows a recent resistance breakout, and the price has tested the significant 1938 level. Trading Idea: Here's a straightforward trading idea based on this setup: Entry: Consider entering a long position if Gold convincingly breaks and closes above the 1938 resistance level. This breakout could signal further upward momentum. Stop Loss: To manage risk, place a stop-loss order just below the breakout point, providing a buffer for potential price fluctuations. Take Profit: Set a take-profit level at your desired target. Given the 1938 resistance breakout, you may consider setting your initial target based on your risk-reward ratio and market conditions. Risk Management: Always prioritize risk management by calculating your position size to align with your risk tolerance. Adjust your stop-loss and take-profit levels accordingly. Final Thoughts: As of the time this post was written, Gold is testing the 1938 level after a resistance breakout. Markets can be unpredictable, so proceed with caution and maintain a disciplined approach to trading. Wishing you successful trades! 📈💰
