Technical analysis by keshihrk43020 about Symbol TIA on 3/12/2024

keshihrk43020
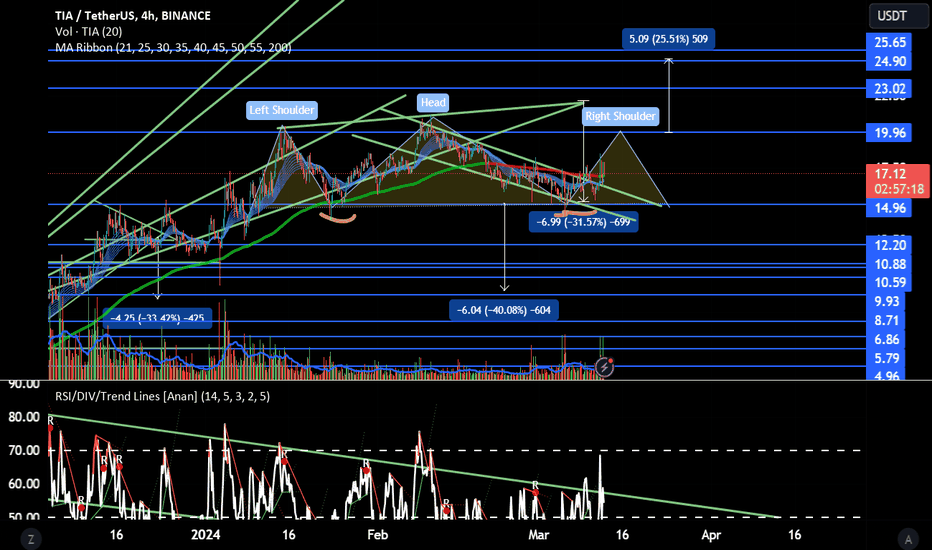
well as you can see in the chart below we fell down from a bearish rising wedge and got its target of $14.91; by touching again this static resistance that I highlighted with yellow for you, it was made a double button can make a W pattern and get $24.9 if we'll complete pattern and retest $19.96 then we go $24,9. Else if rejected from the 19.96 area and won't break $21.14 it will make a head and shoulders and have the potential to fall to the $8.71 area. I should mention it has a big divergence in Daily TimeFrame RSI and has made a bullish flag pattern in RSI; one of our confirmations for a bullish scenario can be breaking this flag and retesting this. let's appose you haven't bought any Tia yet. What should I do? nobody knows what will happen so do DCA. Assign how much you see matches your Money management strategy and stake it. ( try to have at least 10) #DYOR #NFAif we wanna get an average from the breakpoint to the ideal target the answer is 11.65; of course, the 8.71-9 area is sweat but if you're doing DCA for TIA, 11.65 is a good place to add your bag for stakedrops and long term holding. it can help you to not fall behind from market jumps. (At least 5 from 10 you wanna stake ) #DYOR #NFA
