Technical analysis by mailtobmdtech01 about Symbol PAXG: Buy recommendation (1/22/2025)

mailtobmdtech01
XAUUSD
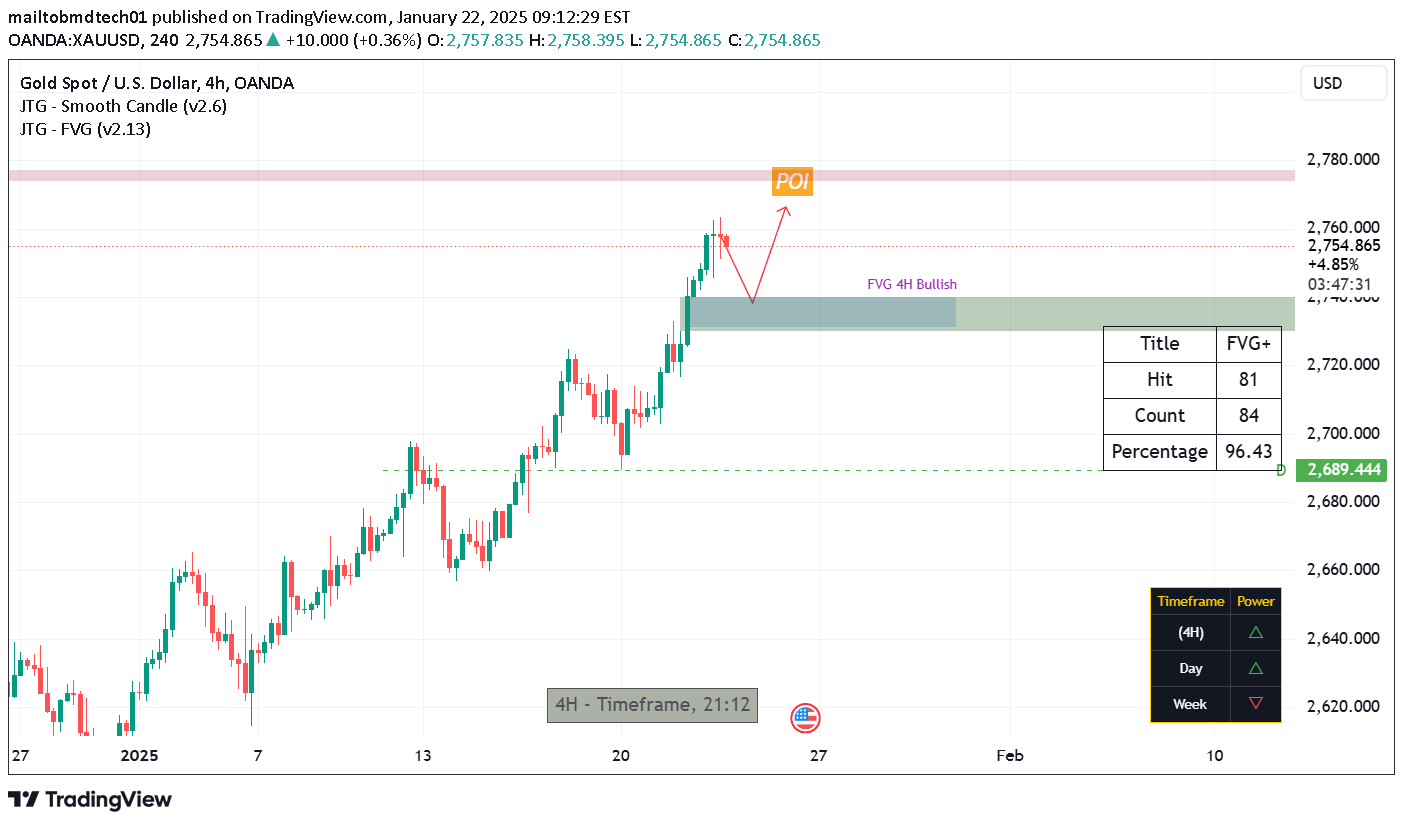
This chart represents the price action of Gold (XAU/USD) on the 4-hour (4H) timeframe. Let me break down the components: Price Movement: The chart shows a bullish (upward) price trend, as indicated by the higher highs and higher lows in the candlesticks. Point of Interest (POI): A specific area marked with "POI!" suggests a critical level where the price is expected to react. This could indicate a potential reversal or continuation zone for traders. Fair Value Gap (FVG): The label "FVG 4H Bullish" marks a zone of imbalance, where price movement has left a gap without significant trade. Traders often consider this an area where the price may retrace before continuing in the trend direction. Forecasted Movement: The red arrow predicts a pullback into the FVG zone before resuming the upward trend. This aligns with a bullish outlook, where price retests support zones for confirmation. Data Table (Title: FVG+): Hit: 81 - The number of times this FVG pattern has been effective historically. Count: 84 - Total occurrences of this pattern. Percentage: 96.43% - The success rate of the pattern, indicating its reliability. Power Table (Bottom Right): Timeframe (4H): Bullish (▲), suggesting strong upward momentum on this timeframe. Day and Week: These indicate overall sentiment on longer timeframes, with mixed signals. If you’re trading Gold, this chart suggests looking for a buy opportunity after the pullback into the FVG zone. Let me know if you want more details or analysis!