Technical analysis by abadan110 about Stock شاخص کل on 12/11/2024
https://sahmeto.com/message/3074979
abadan110
Rank: 1067
Analytical Power:
1.9
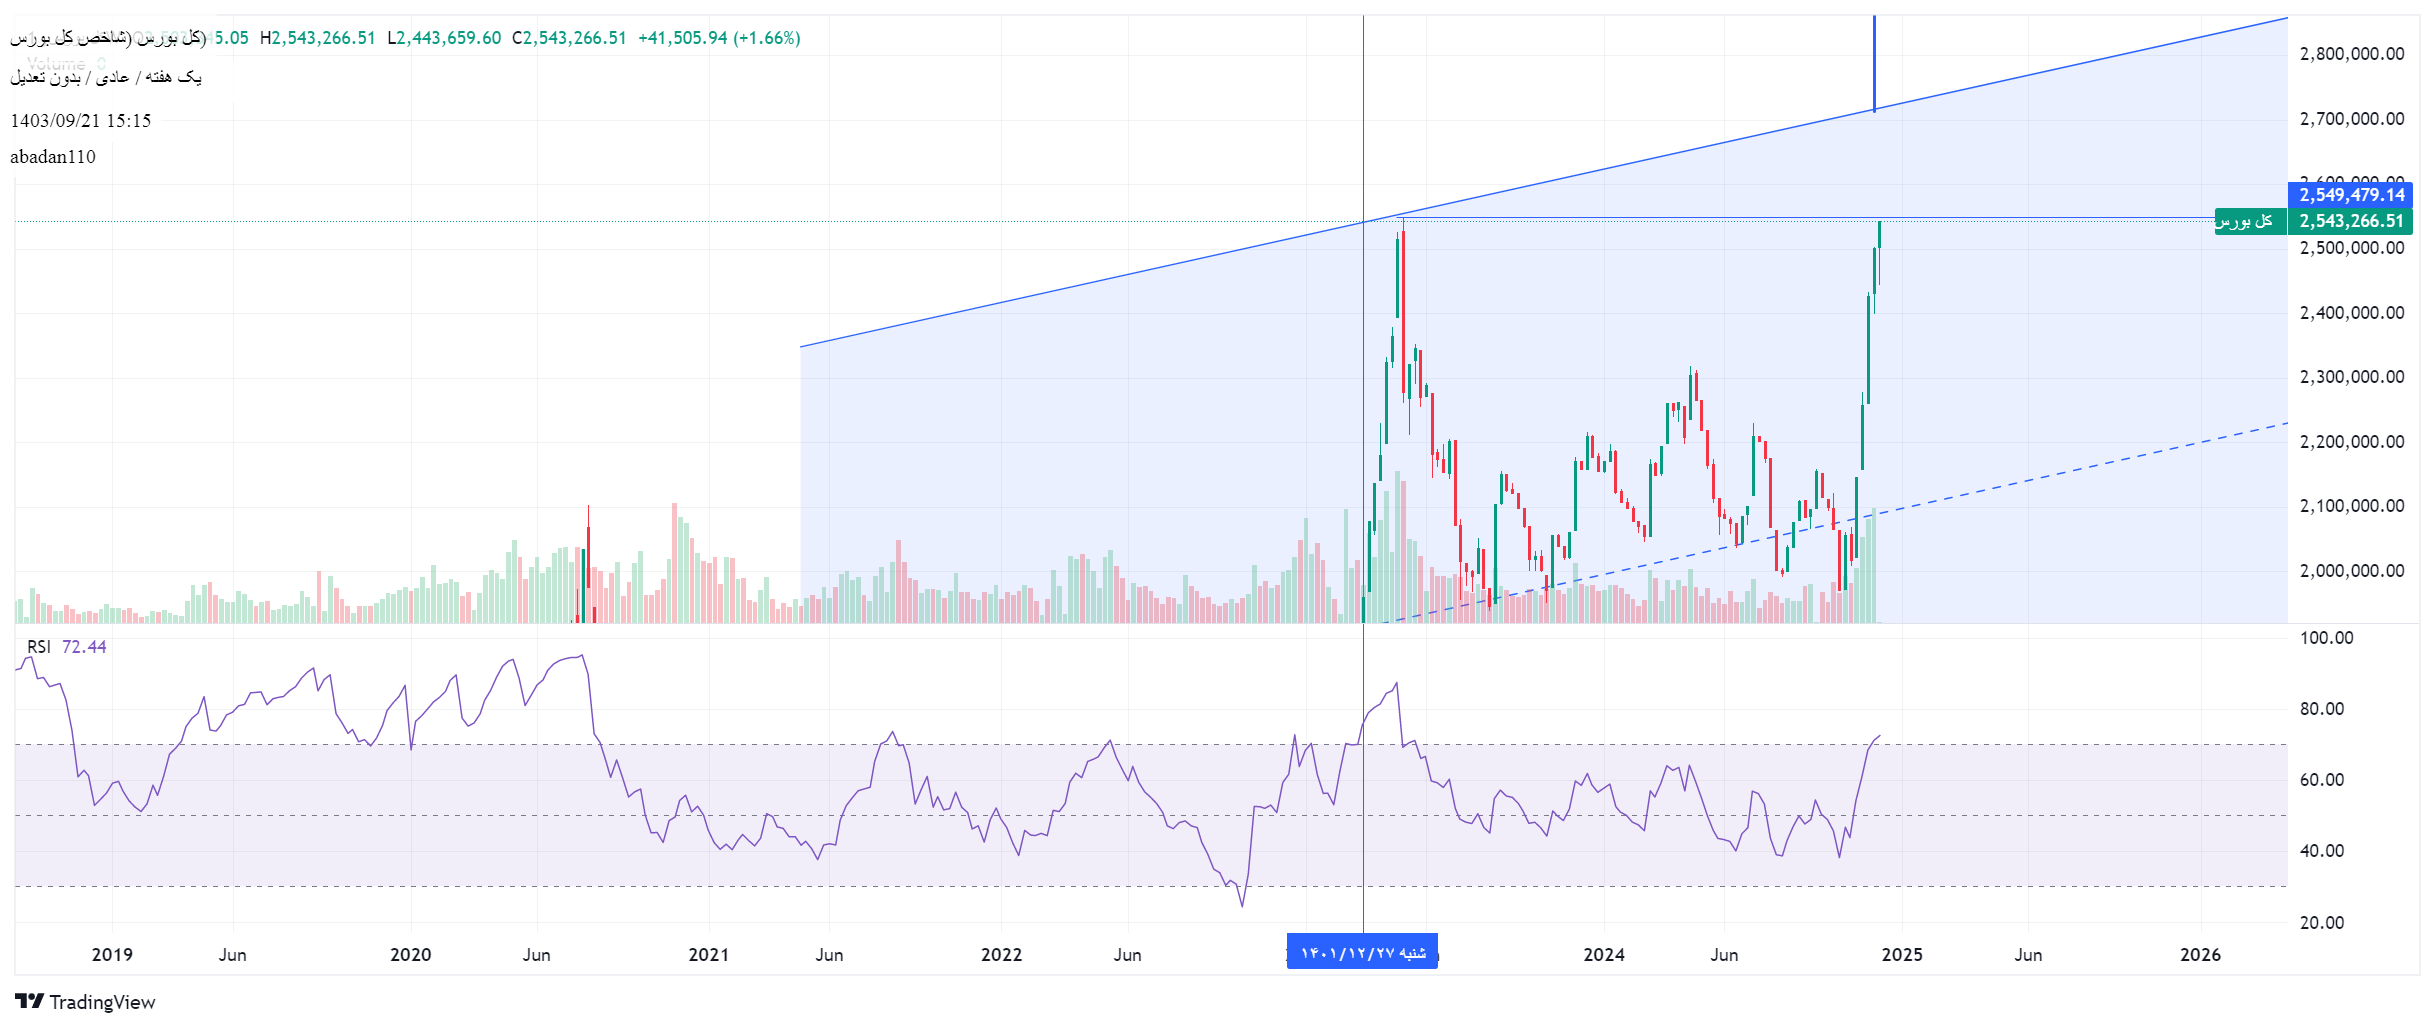
I was looking at the analysis and comments of some friends. The RSI's negative divergence is properly referred to, but because of the fractal of time frames, we see that the RSI is in the right time in the weekly time. I mean buying or selling in this fool. I just wanted friends to consider the timing of their analysis and investment. The RSI shows 79 daily and, of course, had advanced up to 85 days ago, while the weekly RSI shows the highest number of 72 and has not yet reached the saturation point. Again, this analysis is merely a personal opinion
Translated from: Farsi
Show Original Message
Signal Type: Neutral
Source Message: Rahavard
RahavardTime Frame:
1 weekPrice at Publish Time:
930