
ZK
zkSync
| تریدر | نوع سیگنال | حد سود/ضرر | زمان انتشار | مشاهده پیام |
|---|---|---|---|---|
 asilturkRank: 32241 | خرید | حد سود: تعیین نشده حد ضرر: تعیین نشده | 1/6/2026 |
Price Chart of zkSync
سود 3 Months :
سیگنالهای zkSync
Filter
Sort messages by
Trader Type
Time Frame

Cryptojobs
$ZK - Bullish breakout

ZK - Bullish breakout I'm waiting for lower fib retest before to jump in
asilturk
ZK Tehlikeli Olabilir

"ZK Coin" (ZK) refers to the native token of the zkSync protocol in the cryptocurrency market. zkSync is one of the most popular Layer-2 projects that offers a solution to the biggest problem faced by Ethereum: scalability (speed and cost). As of now, we see that its price is 0.03800 cents and continues with a transaction volume of $150 million. ZKsync is seen as an important part of Ethereum's future scaling solution, providing an efficient platform for both developers and users. Technically, volume and momentum are very good, money inflow is very healthy, short and sharp movements may occur. I wish you good luck.

ZK - Long idea

ZKUSDT.P Zk idea! This is not a setup. It's just an idea. If we create a similar model, then we're in. If we fail, we skip it.Part fixed. stop at no loss.

SpartaBTC
ZK Local Trend. Wedge. Reversal Zone and %. 2025 12 27
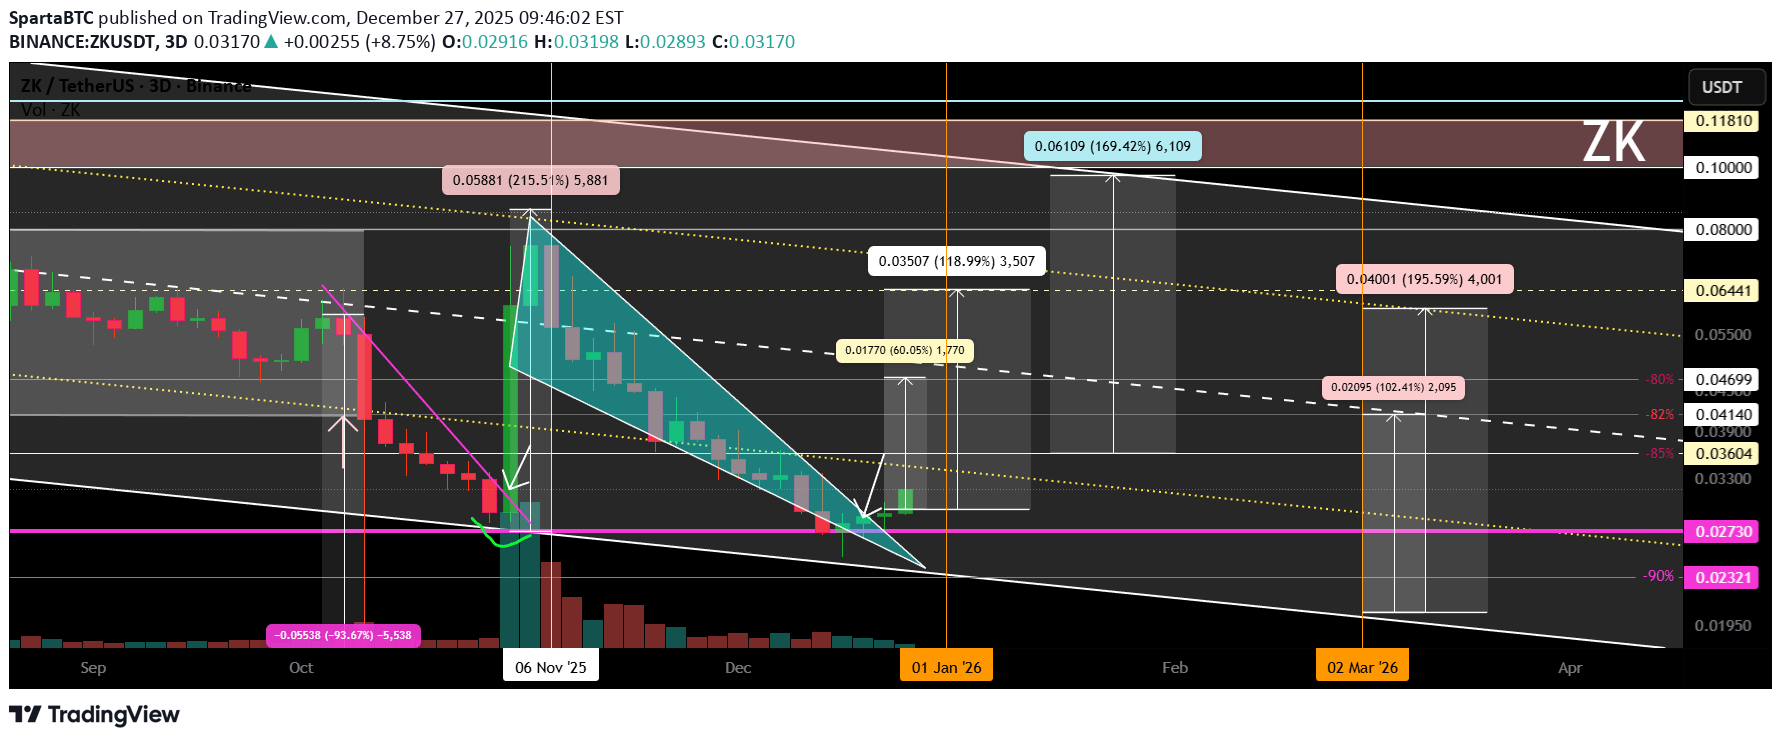
Logarithm. 3-day timeframe. Main trend for clarity (lower zone of the descending channel). Declines from the high ("funds are buying 458 million worth of nothing") - 90%. The long squeeze, due to the extremely low liquidity of the former hyped "saving the world" instrument, was carried out by a phenomenal -93% on a half-empty order book. Secondary and local trends . The key is a breakout of the descending wedge and local resistance zone. Reversal zones and % of key support/resistance levels for building a trading plan and risk management. Most market participants find it very unpleasant and difficult (they can't bring themselves to) to buy low (fear) and sell high (greed). For them, it's the other way around. Manage your risks and stick to your trading plan. Don't get caught up in market and news noise, which shapes the opinions and illogical actions of the majority, who are doomed to lose in the future.

cennetkusu60
Zkda güzel bir yükseliş bekliyorum

Zk daki düşüş yönlü trend yukarı doğru kırılırsa 0.043 e kadar yükseliş bekliyorum
ZK 1 Day

This is not investment advice, my expectation is this way. ZK sometimes it gets very bullish A certain amount can be held either on spot or on leverage.

Bithereum_io
تحلیل فوری ZK/USDT: آیا گوه نزولی شکسته شد؟ اهداف صعودی پس از پولبک به SMA50
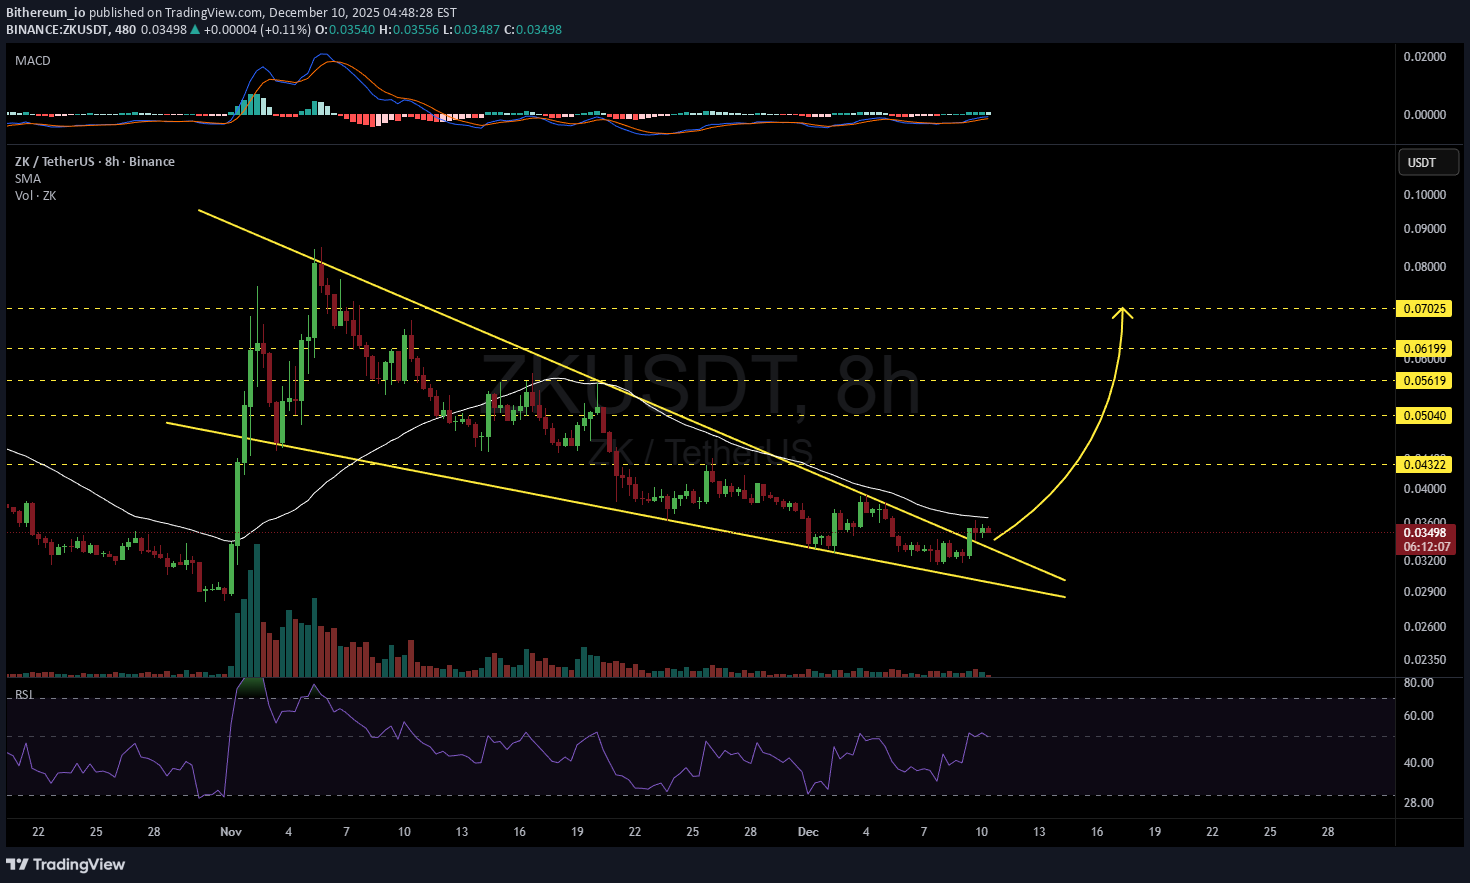
#ZK has broken above the falling wedge pattern on the 8H timeframe. It is currently facing the SMA50, and a retest is in progress. In case of a successful bounce and a breakout above the SMA50, the potential targets are: 🎯 $0.04322 🎯 $0.05040 🎯 $0.05619 🎯 $0.06199 🎯 $0.07025 ⚠️ Always remember to use a tight stop-loss and maintain proper risk management.

CryptoNuclear
آینده ZK/USDT: شکستن گُوِه نزولی یا سقوط نهایی در منطقه حساس؟
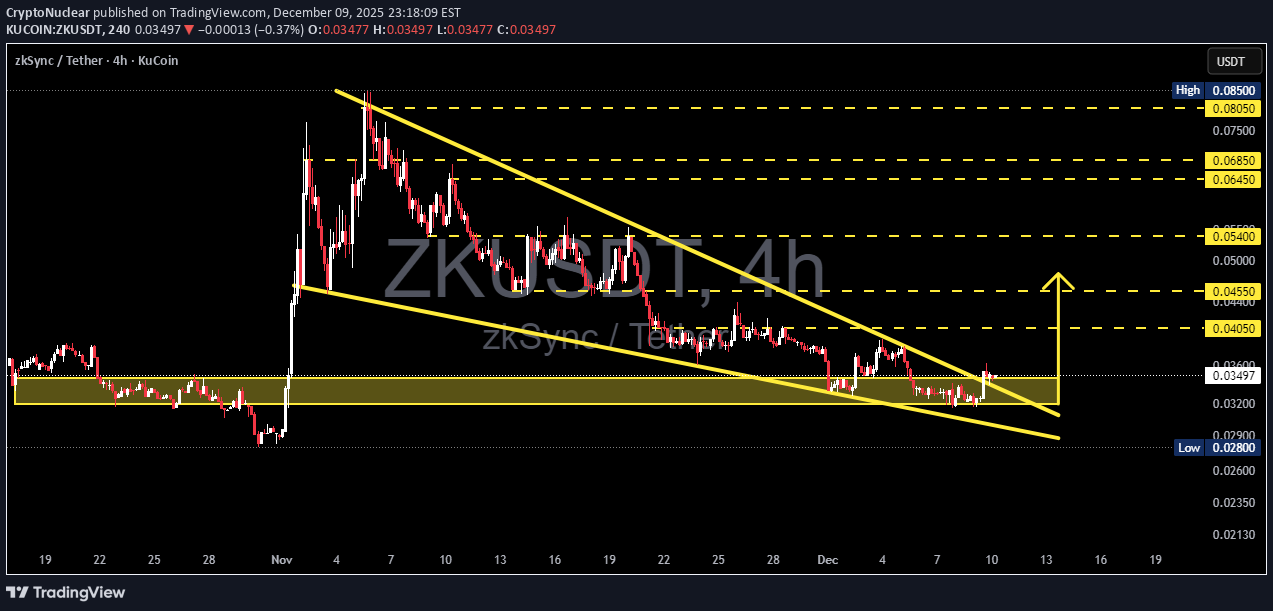
ZK/USDT is entering a critical phase after a prolonged decline since early November. Price is now holding right above the 0.0347–0.0320 demand zone, the same area that previously triggered a strong bullish reaction. At the same time, sellers have been compressing price into a falling wedge structure, a pattern that historically carries a high probability of triggering major trend reversals. This narrowing wedge signals that volatility is being compressed to its maximum point. The tighter the structure becomes, the stronger the potential breakout. If buyers manage to break above the upper wedge trendline, ZK may release weeks of accumulated bearish pressure and shift into a new bullish phase. But this demand zone is also the bulls’ final line of defense. A clean breakdown below 0.0320 would invalidate the structure and open the door for deeper downside toward previous lows. --- Bullish Scenario (High Probability Reversal if Confirmed) Bullish confirmation checklist: 1. A strong 4H candle closes above the upper wedge. 2. A successful retest of the trendline as new support. 3. Increased volume on the breakout (momentum confirmation). If confirmed, ZK’s upside potential opens toward: Target 1: 0.0405 Target 2: 0.0455 Target 3: 0.0540 Major extension: 0.0645 – 0.0685 This structure often appears just before mid-trend to major reversals. --- Bearish Scenario (Trend Continuation if Support Fails) Bearish confirmation checklist: 1. Price rejects the upper wedge and loses upward momentum. 2. A decisive 4H close below 0.0320. 3. Retest of 0.0320 acting as new resistance. Downside targets if breakdown occurs: Target 1: 0.0280 Target 2: 0.021–0.023 if bearish momentum accelerates. A breakdown at this zone would re-establish a deeper bearish structure with new lower lows. --- Why This Zone Matters 1. The 0.0347–0.0320 demand zone has acted as a strong accumulation area before. 2. Falling wedges are often used by smart money as a transition pattern from distribution to accumulation. 3. Extended consolidation at support usually precedes large directional moves. 4. Low-volume dips into demand often indicate the final phase before reversal. This makes the current price zone not just a support level, but a decision point for the next major trend. #ZKSync #ZKUSDT #CryptoAnalysis #PriceAction #FallingWedge #DemandZone #BreakoutSetup #CryptoTrading #AltcoinAnalysis
ZK is approaching its lows. I'm expecting a rebound. Full plan.
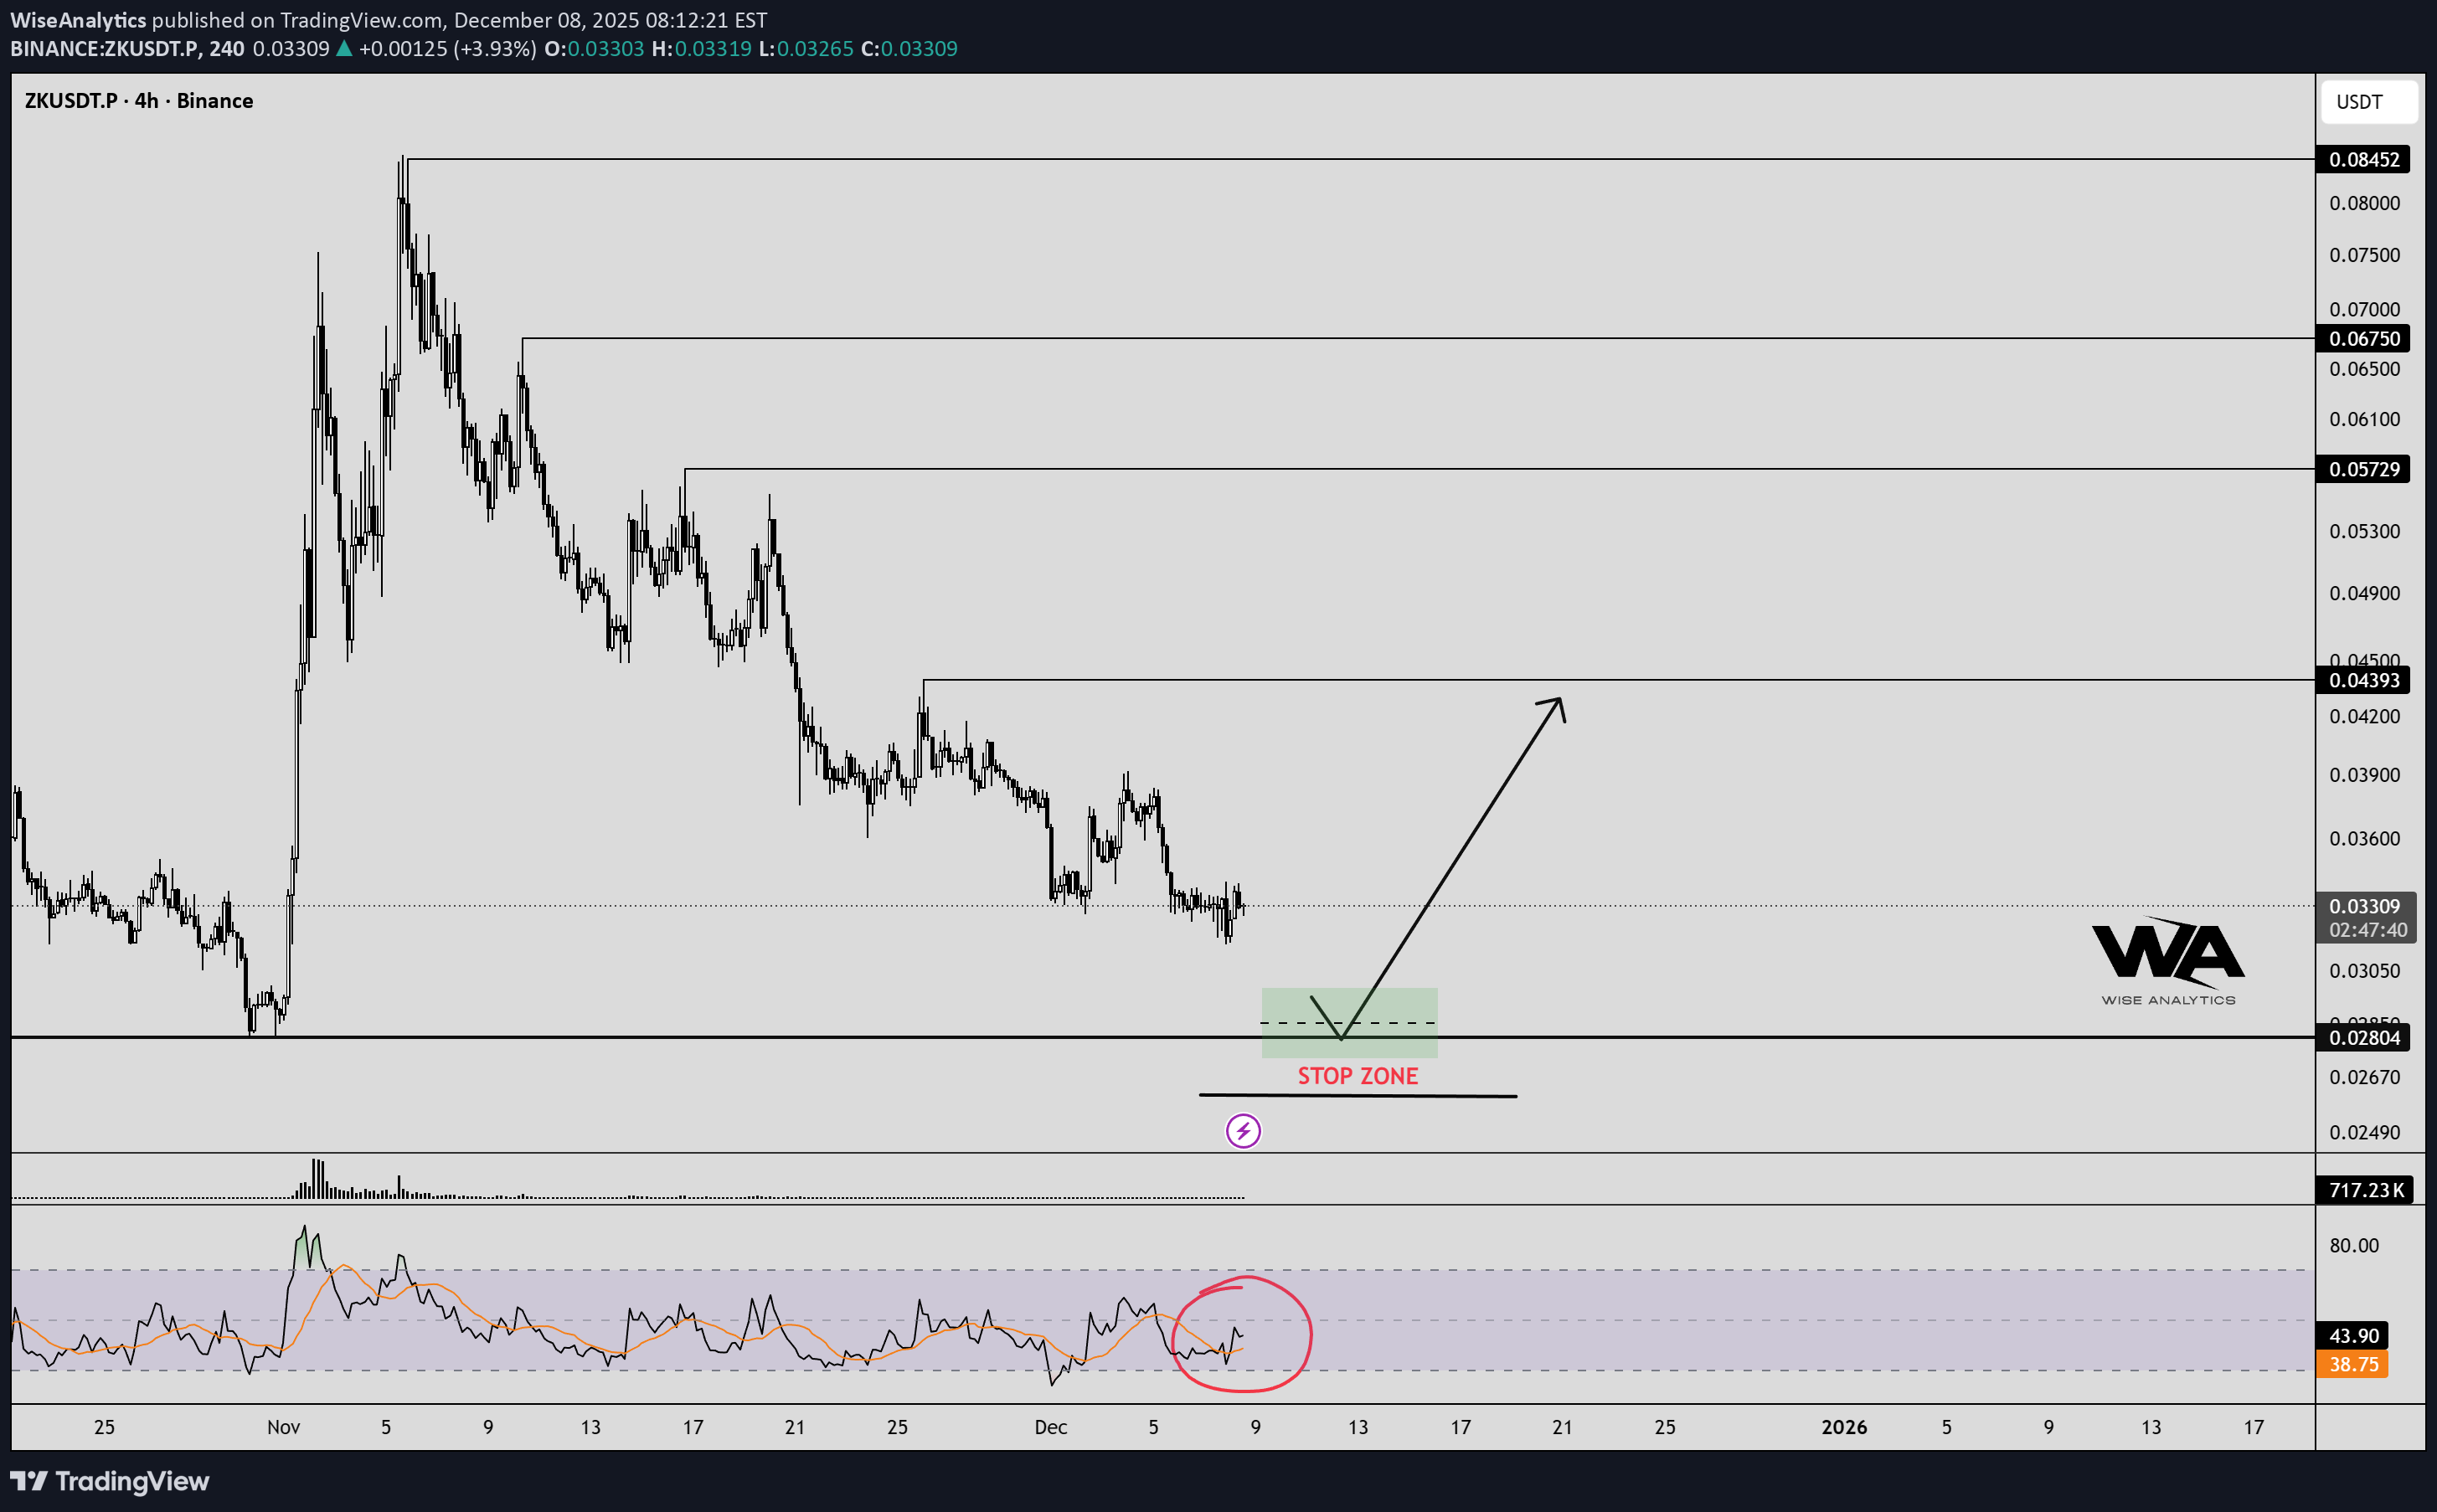
ZK is slowly approaching its lows. It is dangerous to enter at the current level because the RSI clearly shows that we are approaching it. I have marked the approximate buy zone in green and indicated the stop zone. Please proceed with caution. I have also shown the targets for taking profits on the chart, so you can make informed decisions. Personally, I will exit at the first zone and move the stop to BU. If it goes up, great! If not, we've already made money with stops at BU.I've fixed part of it. Stop at "no kill." I'm leaving the lower limits as they are. However, I'm not setting them; I'm setting alerts! If prices re-enter the zone, I will make a decision based on actual market conditions.

CryptoAnalystSignal
فرصت طلایی خرید ZK/USDT: نقطه ورود دقیق و اهداف هیجانانگیز برای صعود!
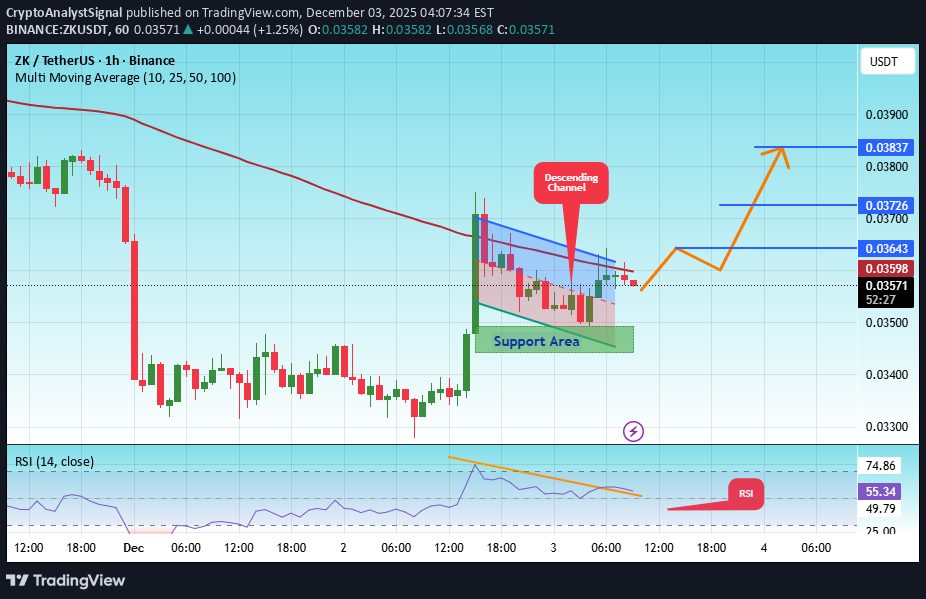
#ZK The price is moving in a descending channel on the 1-hour timeframe. It has reached the lower boundary and is heading towards breaking above it, with a retest of the upper boundary expected. We have a downtrend on the RSI indicator, which has reached near the lower boundary, and an upward rebound is expected. There is a key support zone in green at 0.03466. The price has bounced from this level multiple times and is expected to bounce again. We have a trend towards consolidation above the 100-period moving average, as we are moving close to it, which supports the upward movement. Entry price: 0.03580 First target: 0.03640 Second target: 0.03720 Third target: 0.03830 Don't forget a simple principle: money management. Place your stop-loss order below the support zone in green. For any questions, please leave a comment. Thank you.#ZK First target: 0.03640 Reached Second target: 0.03720 Reached Third target: 0.03830 Reached
Disclaimer
Any content and materials included in Sahmeto's website and official communication channels are a compilation of personal opinions and analyses and are not binding. They do not constitute any recommendation for buying, selling, entering or exiting the stock market and cryptocurrency market. Also, all news and analyses included in the website and channels are merely republished information from official and unofficial domestic and foreign sources, and it is obvious that users of the said content are responsible for following up and ensuring the authenticity and accuracy of the materials. Therefore, while disclaiming responsibility, it is declared that the responsibility for any decision-making, action, and potential profit and loss in the capital market and cryptocurrency market lies with the trader.