
XVS
Venus
| تریدر | نوع سیگنال | حد سود/ضرر | زمان انتشار | مشاهده پیام |
|---|---|---|---|---|
No results found. | ||||
Price Chart of Venus
سود 3 Months :
سیگنالهای Venus
Filter
Sort messages by
Trader Type
Time Frame

تحلیل قیمت XVS: منتظر پرواز بزرگ پس از تثبیت بالای 5.30 دلار!
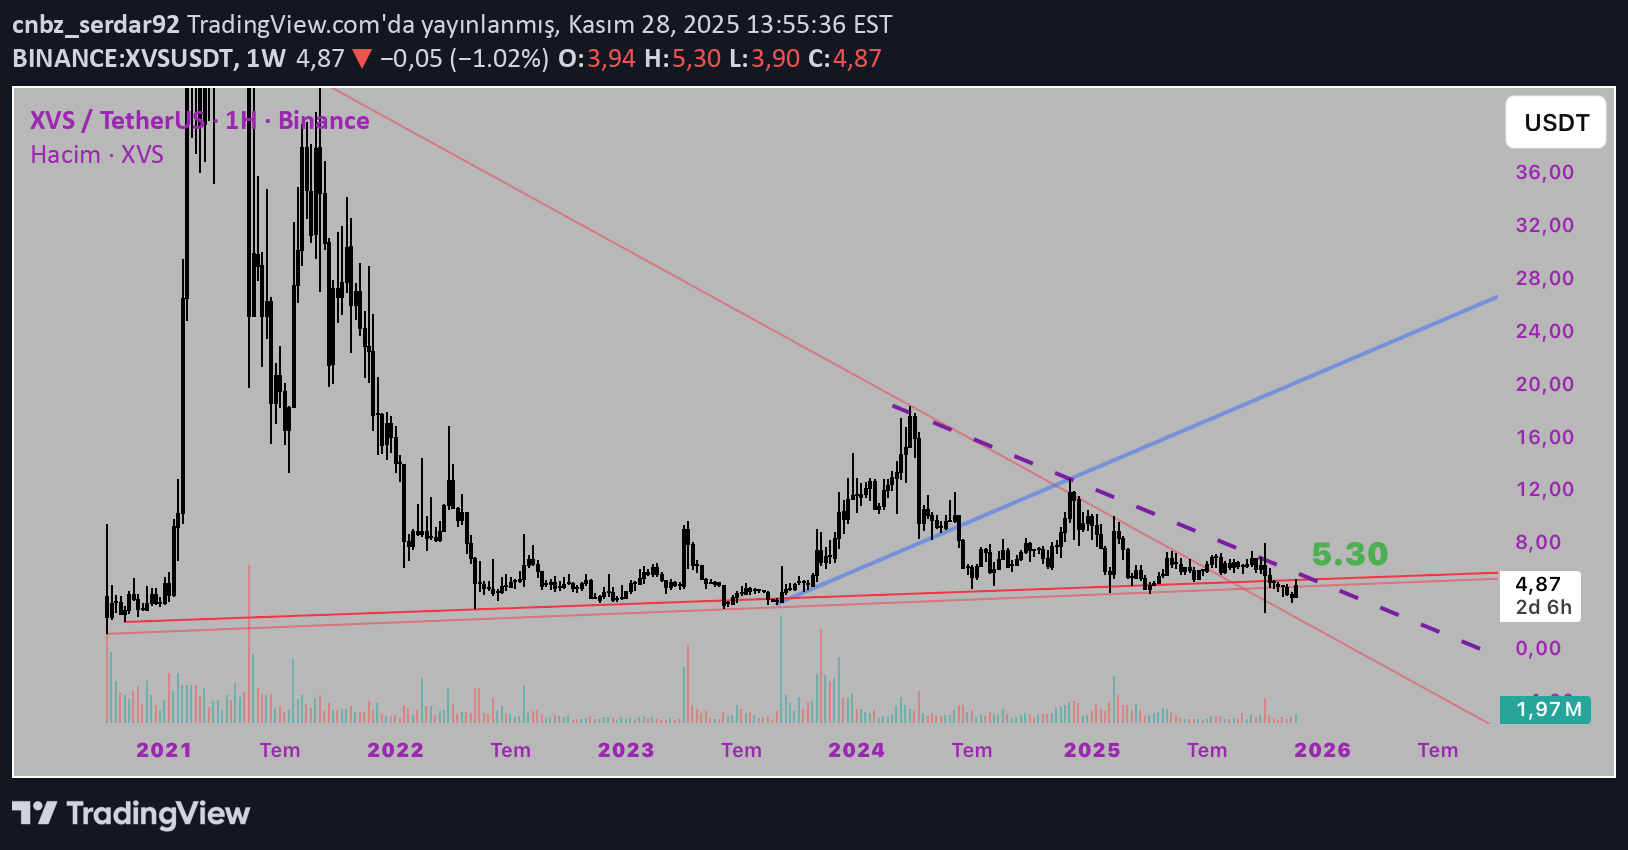
It is breaking the main resistance, but to pass the time, it is hanging on to the 2nd resistance. The intersection with the support trend is above 5.30. I expect rapid rises. I will continue to lose time unless there is more than 5.30.

SaykoCrypto
تحلیل هفتگی XVS/USDT: آیا قیمت به سقف محدوده بازمیگردد؟ (هدف 3 برابری!)
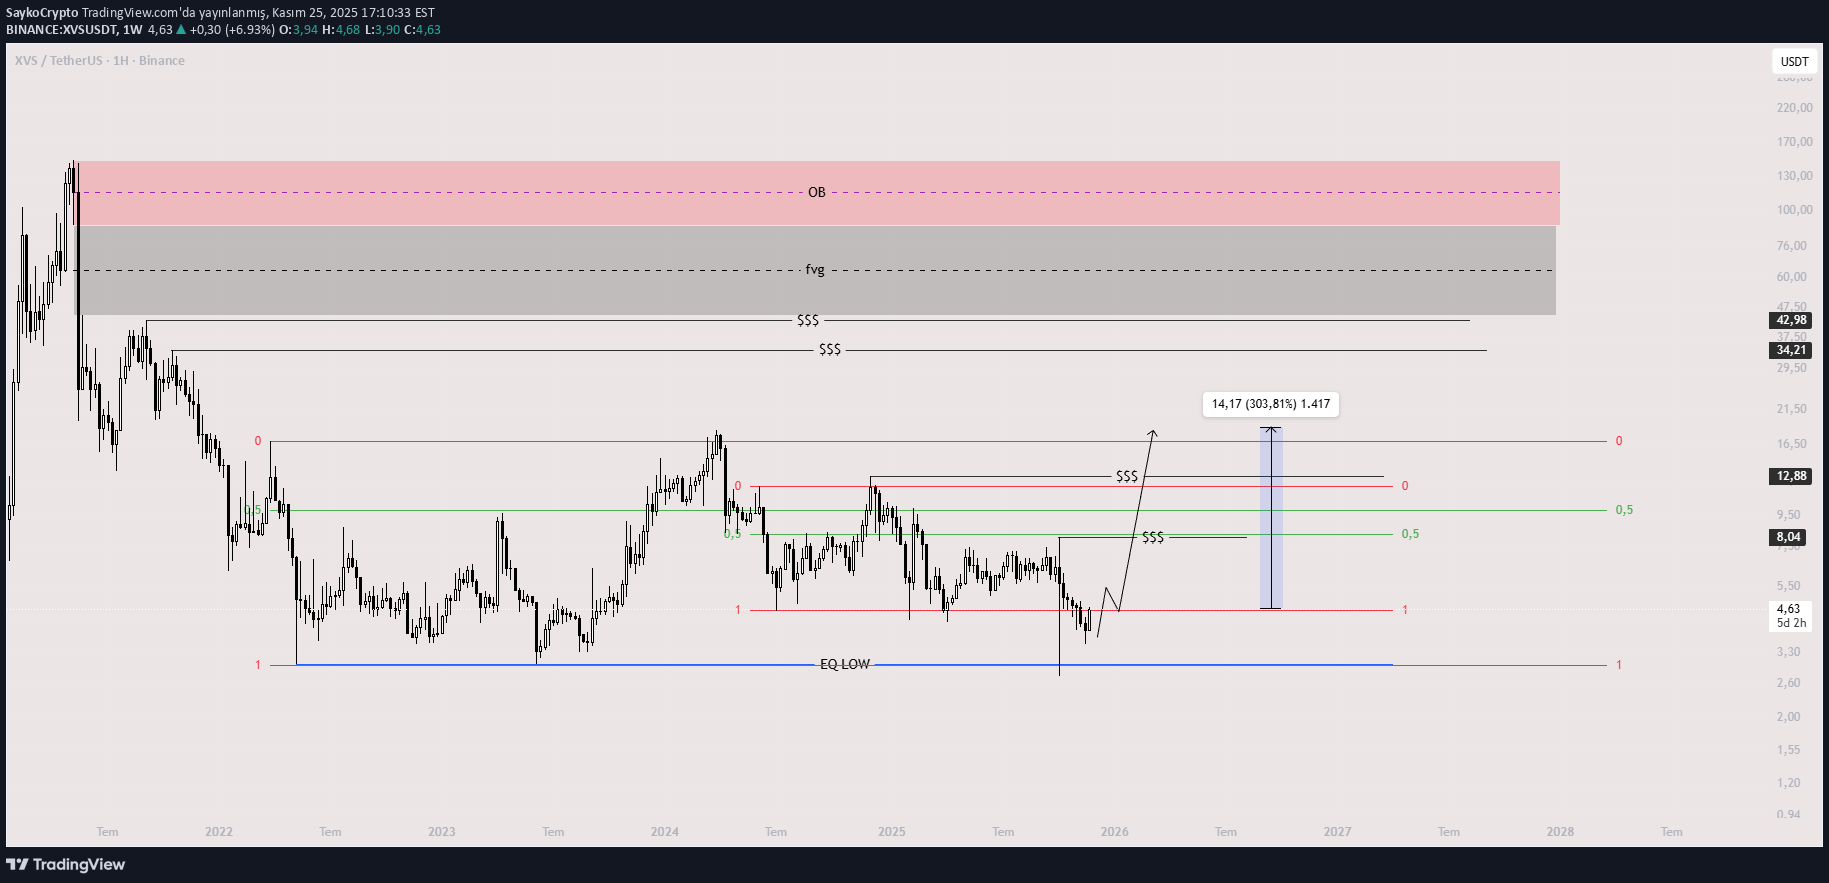
EQ low points are highlighted on the weekly chart. As the price moves back into the range, the range midpoint and high zone will be the target. (my total target is 3x) I stated in the chart The chart is for tracking purposes. It does not contain investment advice!!!!
SaykoCrypto
تحلیل هفتگی XVS/USDT: آماده پرش ۳ برابری؟ (اهداف میانی و نهایی)
EQ low points are highlighted on the weekly chart. As the price moves back into the range, the range midpoint and high zone will be the target. (my total target is 3x) I stated in the chart The chart is for tracking purposes. It does not contain investment advice!!!!
SaykoCrypto
تحلیل هفتگی XVS/USDT: هدف سهبرابری در محدوده نوسان!
EQ low points are highlighted on the weekly chart. As the price moves back into the range, the range midpoint and high zone will be the target. (my total target is 3x) I stated in the chart The chart is for tracking purposes. It does not contain investment advice!!!!

asilturk
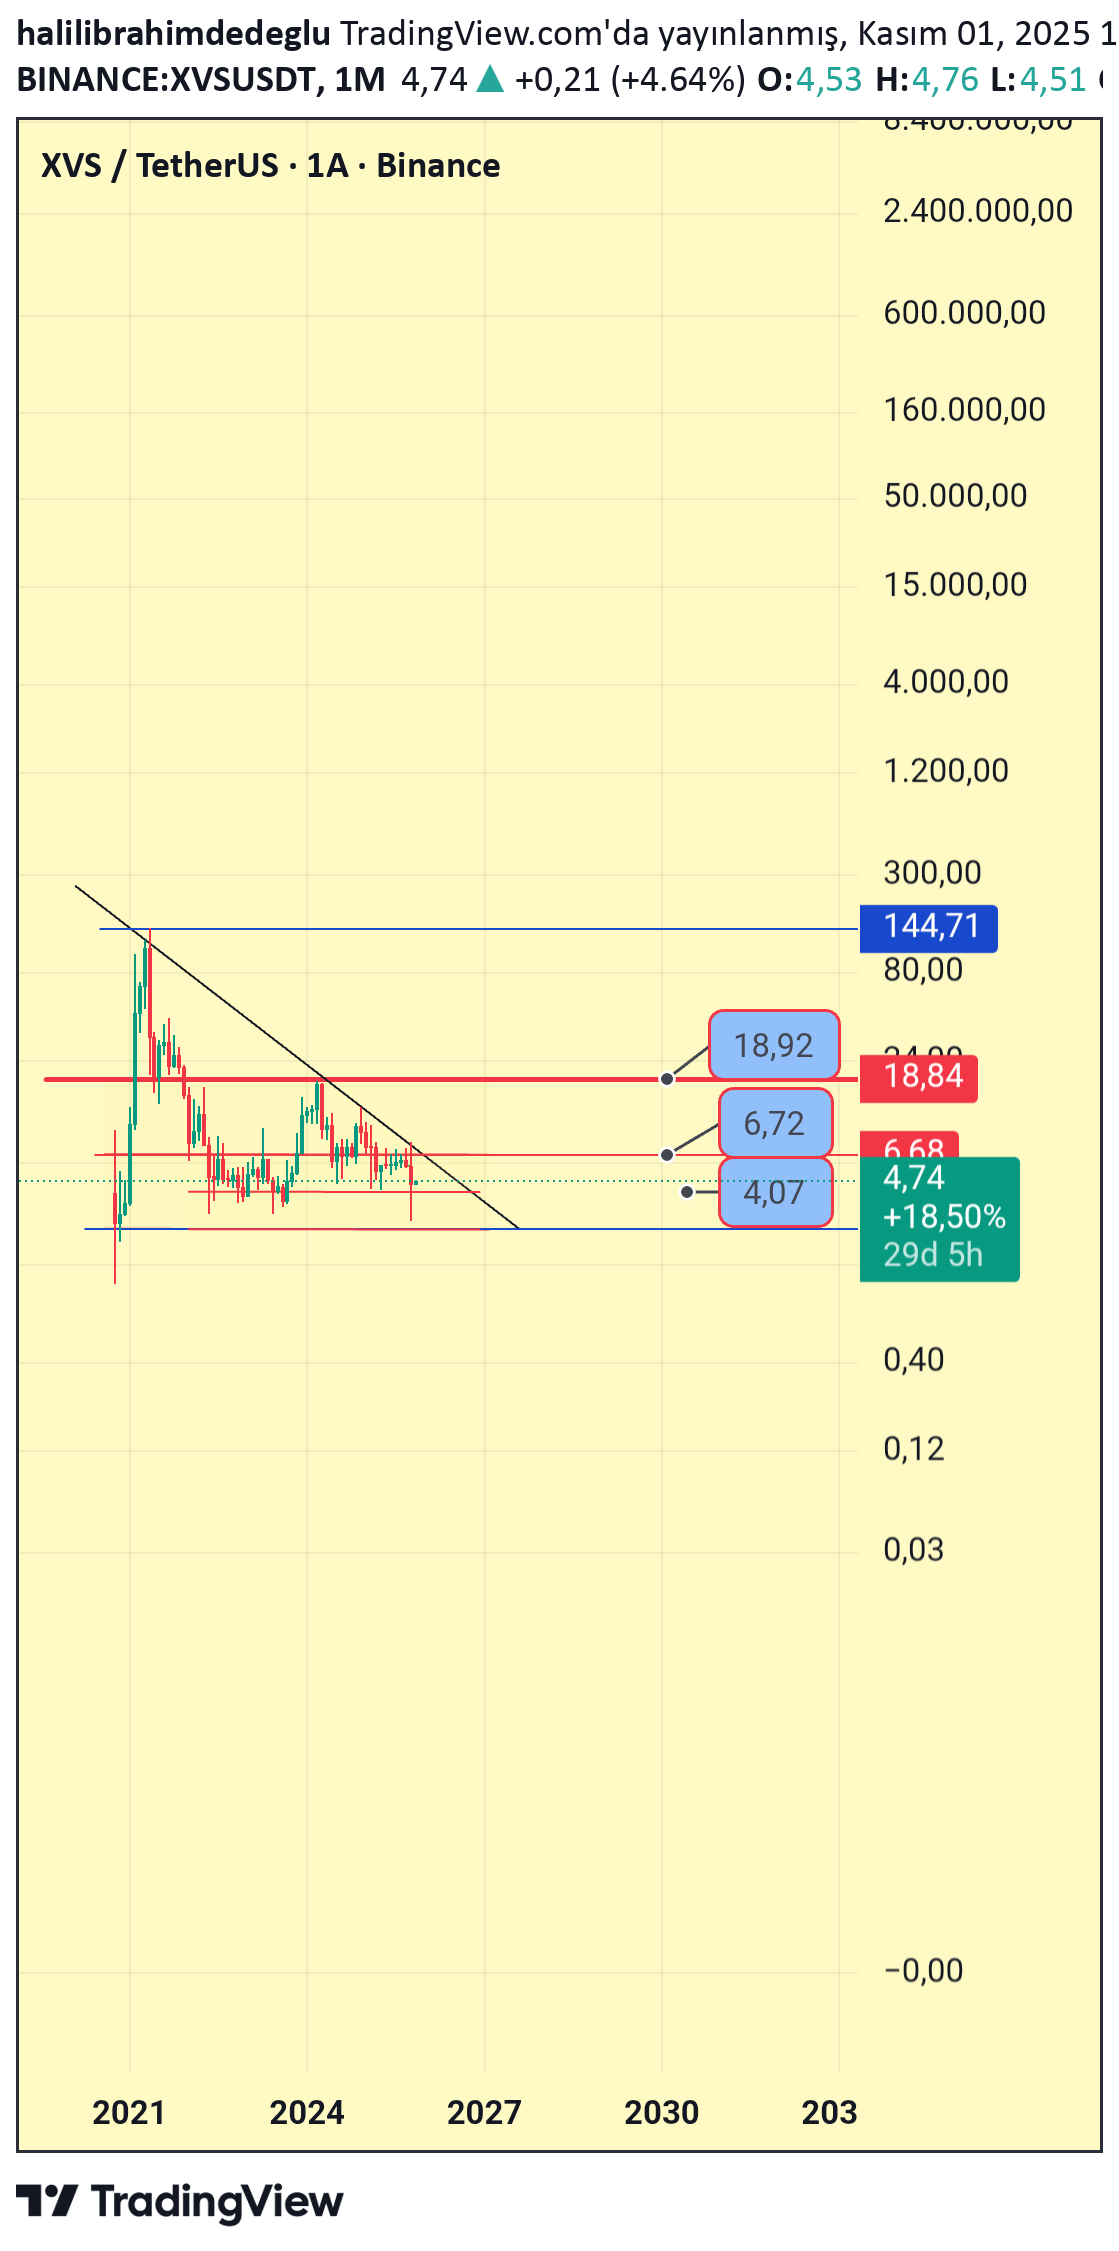
پیشبینی هفتگی XVS (Venus): فرصت خرید و اهداف صعودی بزرگ!

XVS (Venus) is a lending and borrowing protocol built on the Binance Smart Chain (BSC) network and operating in the field of decentralized finance (DeFi). The main purpose of Venus is to enable users to borrow money by collateralizing their crypto assets or earn interest by locking their assets into the system. Venus also has its own synthetic stablecoin pegged to the US Dollar called VAI. As of now, its price is 4$, market value is 123Million$, historical bottom is 2$, highest level is 147$, platform concentration value is 3.58 (must be careful), 16Million in circulation and 30Million total maximum supply. From a technical perspective, we observe the formation of a weekly trend. It would be wrong to look for formations other than DUK, like all other cryptos, but it is worth noting that with the support of the indicators, the price will gradually recover as there is no conflict in the chart and it is at investable levels for medium and long term investors. It is beneficial for those who will open futures transactions to pay attention to liquidity levels (margin). BTC/ETH comparative charts can be interpreted more clearly than the USD chart. I have indicated the sequential targets in the chart. I predict that harsh movements can be expected in the coming days. I wish you pleasant spending.

CryptoNuclear
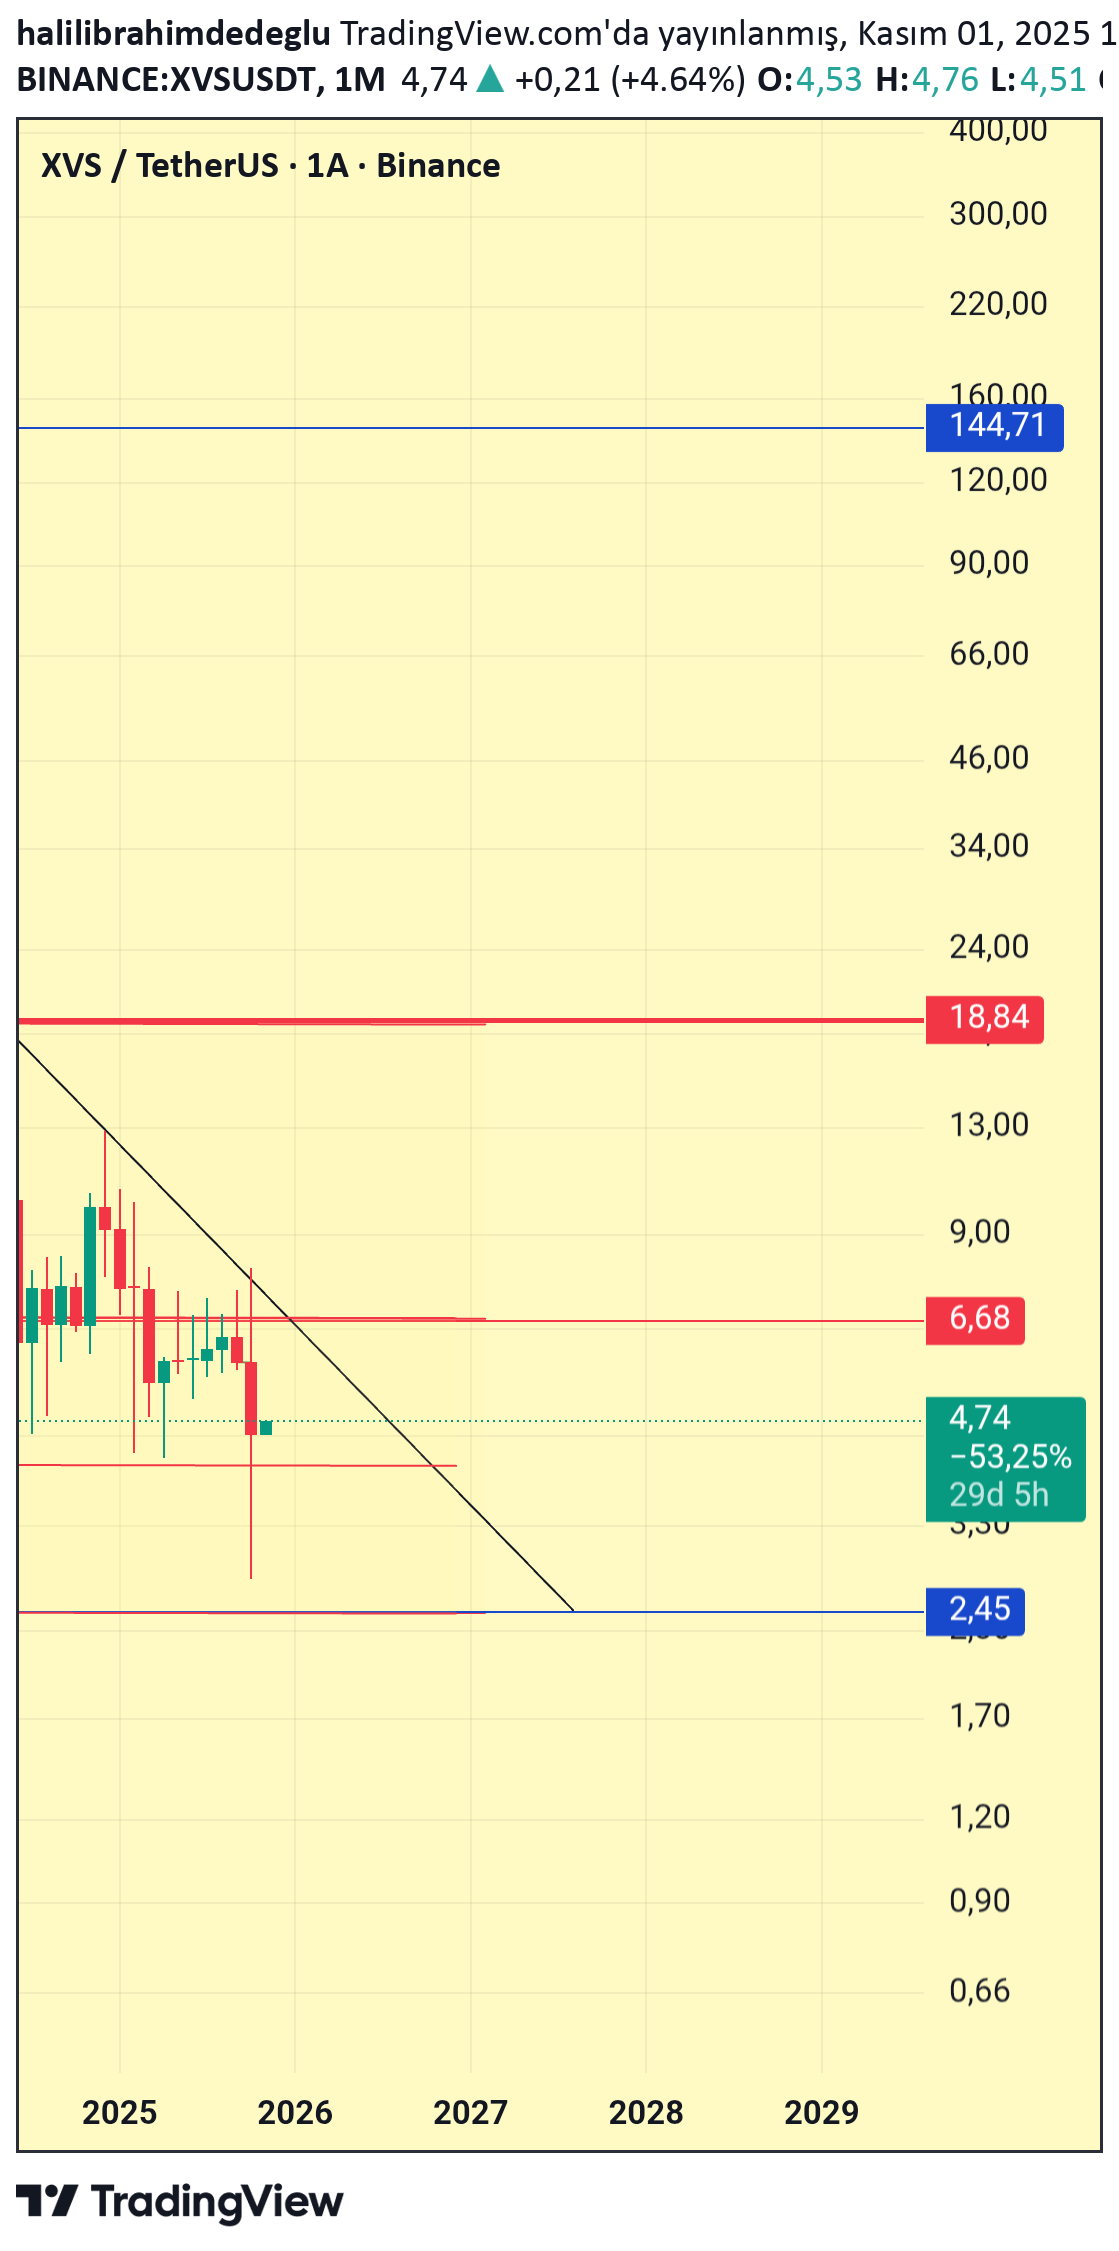
نقطه حیاتی XVS: آیا کفسازی بزرگ آغاز شده یا سقوط نهایی در راه است؟
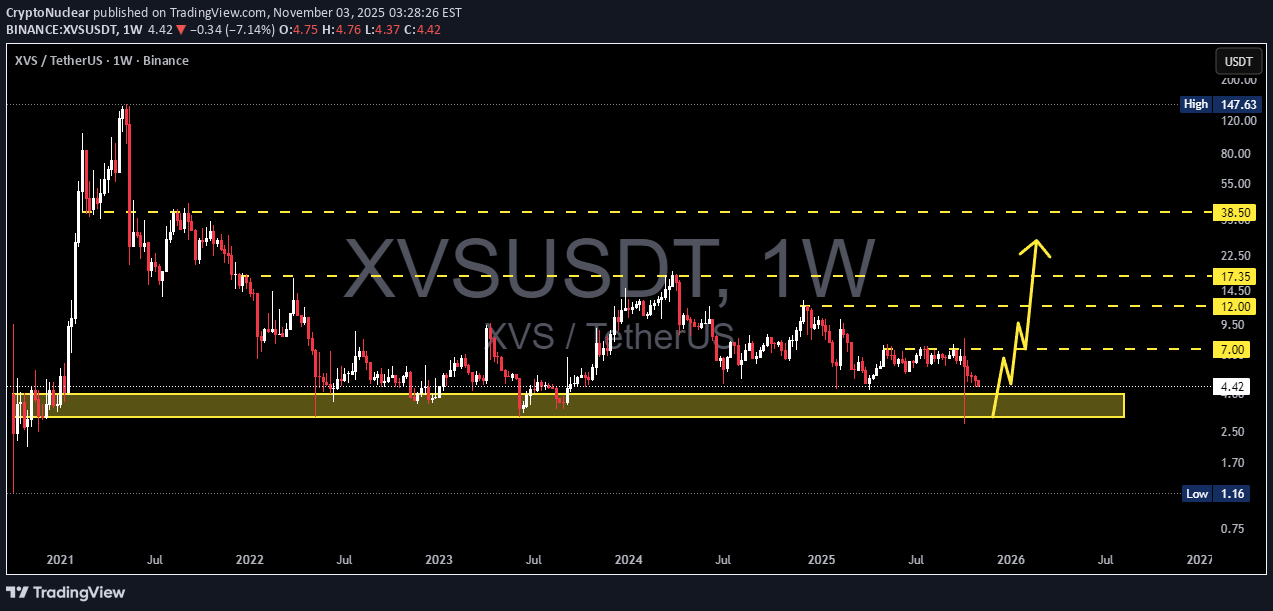
XVS is once again standing at a critical historical zone between $4.00 and $3.00, a level that has defined market direction for more than three years. Every touch on this area has led to either a major bullish reversal or a sharp continuation to the downside. Recently, price printed a deep wick below the zone and quickly recovered — a classic sign of a liquidity grab, where smart money sweeps retail stop-losses before deciding the real direction. From a technical perspective, XVS has been trading in a massive sideways range since 2022, with strong demand around 3–4 and multi-layer resistance levels above. Every time this base has held, a strong rally followed — making this area one of the most decisive zones in XVS’s chart history. --- Bullish Scenario A weekly close above $4.50 would confirm that buyers are defending the zone, indicating potential accumulation by strong hands. A follow-up breakout above $7.00 would shift the mid-term structure to bullish, confirming the start of a new upward phase. Upside targets stand at $7.00 → $12.00 → $14.50 → $17.35, with a macro extension toward $38.50, the previous major supply zone. Bullish narrative: The 3–4 area may represent a final liquidity sweep before a new accumulation phase begins. If volume confirms, XVS could trigger a short-covering rally leading to sharp price recovery. --- Bearish Scenario A weekly close below $3.00 would invalidate the support zone and confirm a macro breakdown. In that case, price could slide toward $1.70 – $1.16, the historical demand base from previous cycles. Losing this zone could spark a capitulation phase, as major stop clusters are likely resting below it. Bearish narrative: Failure to defend the 3–4 range would mark the start of a deeper markdown phase — a potential final leg before a long-term bottom forms. --- Pattern Overview XVS is forming a macro horizontal accumulation structure since 2022. The latest wick below the support zone indicates a possible shakeout event — an early hint of reversal if confirmed by higher closes. Still, without confirmation above resistance levels, this remains a high-stakes battleground between bulls and bears. --- The 3–4 zone isn’t just a number — it’s the defining line between recovery and collapse. If the level holds, XVS could enter a powerful recovery phase toward mid-range resistance. But if it breaks, the chart opens room for a capitulation wave toward historical lows. The upcoming weekly closes will determine the next major chapter of this asset. --- #XVS #XVSUSDT #Crypto #CryptoTrading #SupportZone #LiquiditySweep #SmartMoney #Accumulation #TechnicalAnalysis #Altcoins #RangeTrading #MarketStructure

halilibrahimdedeglu
halilibrahimdedeglu
تحلیل هفتگی XVS/USDT: فراتر از خطوط نمودار - رازهای پنهان قیمت!
Xvsusdt weekly chart is not all about lines, you cannot get anywhere without general analysis, it is not an investment advice.

CryptoAnalystSignal
آلتکوین XVS در آستانه انفجار قیمتی؛ زمان ورود و اهداف هیجانانگیز!
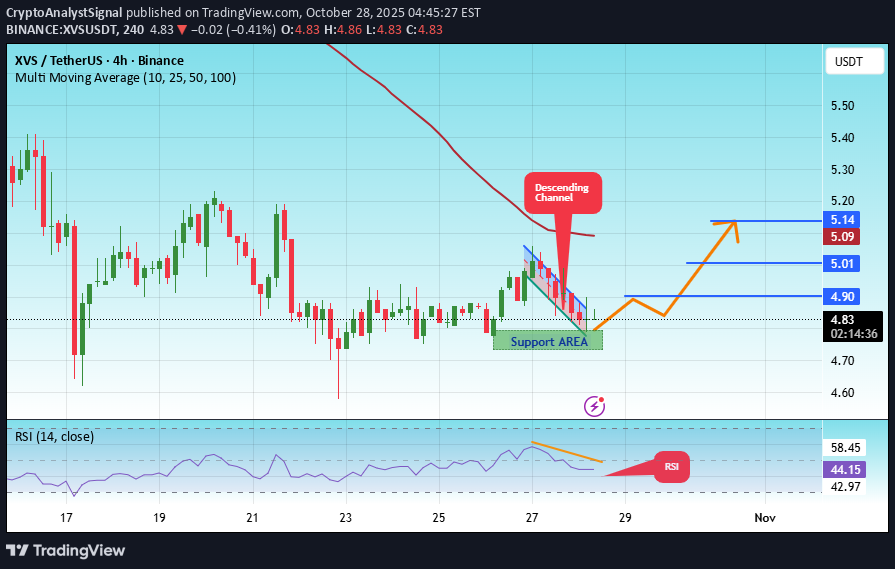
#XVS The price is moving in an ascending channel on the 1-hour frame, adhering well to it, and is heading for a strong breakout and retest. We have a bearish trend on the RSI indicator that is about to be broken and retested, which supports the upward breakout. There is a major support area in green at 4.77, representing a strong support point. We are heading for consolidation above the 100 moving average. Entry price: 4.80. First target: 4.90. Second target: 5.01. Third target: 5.14. Don't forget a simple matter: capital management. When you reach the first target, save some money and then change your stop-loss order to an entry order. For inquiries, please leave a comment. Thank you.#XVS First target: 4.90 Reached Second target: 5.01 Reached Third target: 5.14 Reached
CryptoNuclear
پایان انباشت XVS/USDT: آیا انفجار بزرگ قیمتی در راه است؟

For over two years, XVS/USDT has been locked inside a massive multi-year accumulation phase, forming a clear Symmetrical Triangle pattern on the weekly timeframe. Each move has been creating higher lows and lower highs, showing a tightening range and volatility compression — a classic setup before a major expansion phase begins. Now, price action is once again testing the apex area of the triangle, suggesting that a decisive breakout is approaching. This type of structure often precedes powerful reversals or trend continuations, depending on which direction the breakout confirms. --- 📈 Bullish Scenario Breakout Confirmation: A weekly close above the descending trendline (around 7.0–9.2) with strong volume expansion. Once confirmed, the medium-term targets are 11.87 → 17.70 → 21.60, with a possible extended rally toward 38.30 if broader market sentiment turns bullish. The structure suggests that buyers have been quietly accumulating — and when this compression releases, momentum could accelerate quickly. 💡 Interesting Note: The longer a triangle forms, the stronger the breakout potential. XVS has been building this base for over 100 weeks, indicating a significant amount of pent-up energy waiting to be released. --- 📉 Bearish Scenario Failure to break above resistance followed by a weekly close below the rising trendline (~5.0) would shift momentum bearish. Downside targets sit near 3.8 – 3.01, which represents the final historical demand zone. A confirmed breakdown below 3.0 could invalidate the structure and potentially extend the downtrend further. --- 🔍 Pattern Analysis & Interpretation Pattern Type: Symmetrical Triangle — a sign of prolonged accumulation and tightening market pressure. Meaning: Such structures often mark a pivotal transition zone between accumulation and expansion. Volume: Watch for a clear increase in trading volume during the breakout; without it, false breakouts are common. --- 🧭 Summary XVS is entering a critical decision zone after years of sideways action. A confirmed breakout above 9.2 could trigger the next major bullish cycle, while a breakdown below the lower boundary would confirm renewed weakness toward long-term support. This is not just another consolidation — it’s a battle between accumulation and distribution, and its resolution could define XVS’s direction into 2026 and beyond. --- #XVS #XVSUSDT #CryptoAnalysis #AltcoinBreakout #DeFi #TechnicalAnalysis #SymmetricalTriangle #CryptoChart #CryptoSetup #AccumulationPhase #CryptoMarket #BullishSetup
Disclaimer
Any content and materials included in Sahmeto's website and official communication channels are a compilation of personal opinions and analyses and are not binding. They do not constitute any recommendation for buying, selling, entering or exiting the stock market and cryptocurrency market. Also, all news and analyses included in the website and channels are merely republished information from official and unofficial domestic and foreign sources, and it is obvious that users of the said content are responsible for following up and ensuring the authenticity and accuracy of the materials. Therefore, while disclaiming responsibility, it is declared that the responsibility for any decision-making, action, and potential profit and loss in the capital market and cryptocurrency market lies with the trader.