
XEM
NEM
| تریدر | نوع سیگنال | حد سود/ضرر | زمان انتشار | مشاهده پیام |
|---|---|---|---|---|
No results found. | ||||
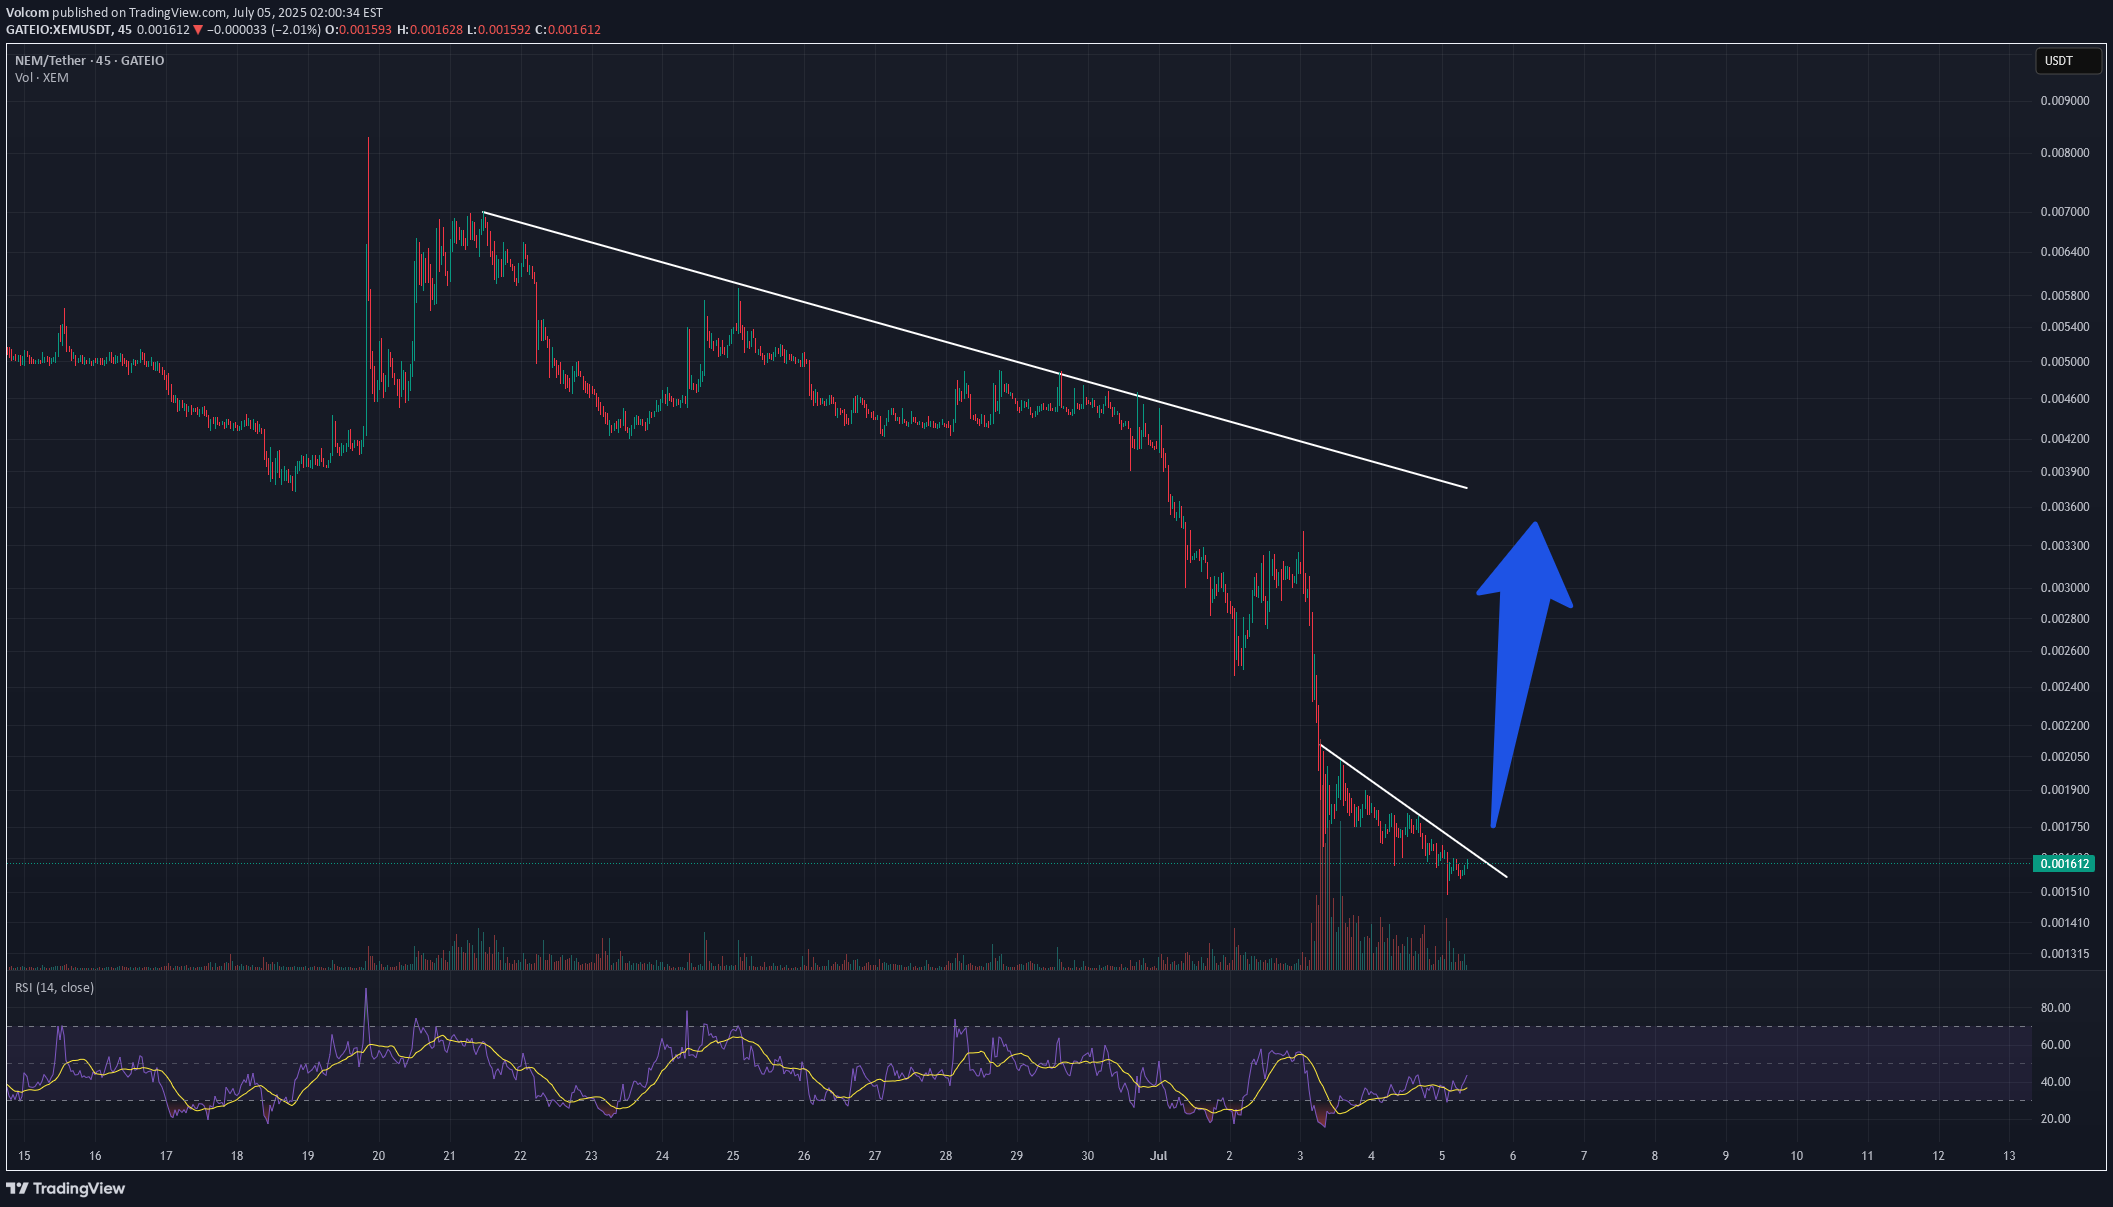
Price Chart of NEM
سود 3 Months :
سیگنالهای NEM
Filter
Sort messages by
Trader Type
Time Frame

Djasas
قیمت ارز دیجیتال X در آستانه سقوط! حذف (Delist) بایننس و پیشبینی ریزش شدید

Enter .0018 short to .0016 bybit delisting soon expecting decline

Volcom
XEM pump past downtrend
Delisting from the IObit exchange caused a strong price drop, the project is alive, several wallets have large amounts, someone here will try to pump it strongly and return to 0.0042

DARKMEX
XEM longterm trade + high risk fundamentally

these trades reflect my trading histrory .....any update will be on the same post .
DARKMEX
XEM

these trades reflect my trading histrory .....any update will be on the same post .

TOUTTE
XEMUSD LONGTERM

Sharing longterm chart for XEMUSDStop loss : monthly close below 0.01$First target 15$Second target open

Zorroreny
XEM (NEM) - ready for strong push up

XEM finished corrective pattern, created double bottom structure with higher low a similar pattern that we have seen on Tara before it pumped up. Expecting strong push up to target range where we have confluence of different resistances:- major diagonal resistance line- pivot above fibb 0.618 (that pivot was Target for Tara)- fibb 0.786 level - that level was reached by XEM in last bull run (2021)If super bullish than we can also wick Mar 2021 level (0.85$) but in any case once impulse is done we will get a significant correction to reveal future potential trade setups....so even if you exit trade too soon, nothing is lost, you secured profits and are waiting for next trade opportunity.Dipped lower so adjusting the outlook. Whole move since Jan 2018 seems like giant ABC correction bringing price back down to Wave 4 range (as per EW Theory). We are oversold, with local bull divergence and similar wave structure in A and C waves. Therefore plan remains - bounce up and test of fibb 0.786 range aka diagonal resistance line.

vagada
Long Entry Signal for XEM/USDT

Based on the daily chart for XEMUSDT on Bybit, here's a concise analysis:MLR vs. SMA: The MLR (blue) is above the SMA (pink), indicating a bullish trend.MLR vs. BB Center: The MLR is above the BB Center Line (orange), suggesting bullish momentum.PSAR: The PSAR dots (black) are under the price, confirming a bullish trend.Price vs. SMA 200: The price is above the 200-period SMA (red), supporting a long-term bullish trend.Current Strategy: Since all entry conditions for a long position are met (MLR above SMA, MLR above BB Center, PSAR under price, price above SMA 200), you might consider entering a long position. Stop Loss (SL): Set the stop loss at the current level of the PSAR dots to manage risk.Monitor My Idea: Keep monitoring my idea for any changes in trend or for potential profit-taking opportunities.Trade is still active; don't forget to move the stop loss (SL) to the Parabolic SAR (PSAR) and wait for the Middle Line Regression (MLR) to cross the Simple Moving Average (SMA) for the exit.

MetaShackle
XEM may be a late bloomer, and is one to keep an eye on!

XEM made a decent move during the 'Trump Pump' after the November elections, but this move was nothing compared to the gains it has made in the past. For the past 8 months, it has been cheaper than it has been since 2017. I think this could be a late bloomer in terms of the pump we've seen in the altcoin market so far, but it will likely catch up and ride the wave of alt season to the top of the defined area, potentially offering around a 12X gain.But, like most things in life, nothing is guaranteed.Good luck, and always use a stop loss!

mr_linechart
look at xem

broken trend line in weeklypullback donefirst target is 0.050have a good x3 future. lol....

libradii
XEM breakout downtrendline

XEM potensial to be something big gainalready breakout downtrendlinecan be breakout or retest first before PUMPvolume increase in past daybuy and hold in this bullseasonsell if invalid bullseason :)
Disclaimer
Any content and materials included in Sahmeto's website and official communication channels are a compilation of personal opinions and analyses and are not binding. They do not constitute any recommendation for buying, selling, entering or exiting the stock market and cryptocurrency market. Also, all news and analyses included in the website and channels are merely republished information from official and unofficial domestic and foreign sources, and it is obvious that users of the said content are responsible for following up and ensuring the authenticity and accuracy of the materials. Therefore, while disclaiming responsibility, it is declared that the responsibility for any decision-making, action, and potential profit and loss in the capital market and cryptocurrency market lies with the trader.