
UMA
UMA
| تریدر | نوع سیگنال | حد سود/ضرر | زمان انتشار | مشاهده پیام |
|---|---|---|---|---|
No results found. | ||||
Price Chart of UMA
سود 3 Months :
سیگنالهای UMA
Filter
Sort messages by
Trader Type
Time Frame

gohani140
هنوز زود است! آیا این نقطه عطف بازار است یا فقط یک دام؟
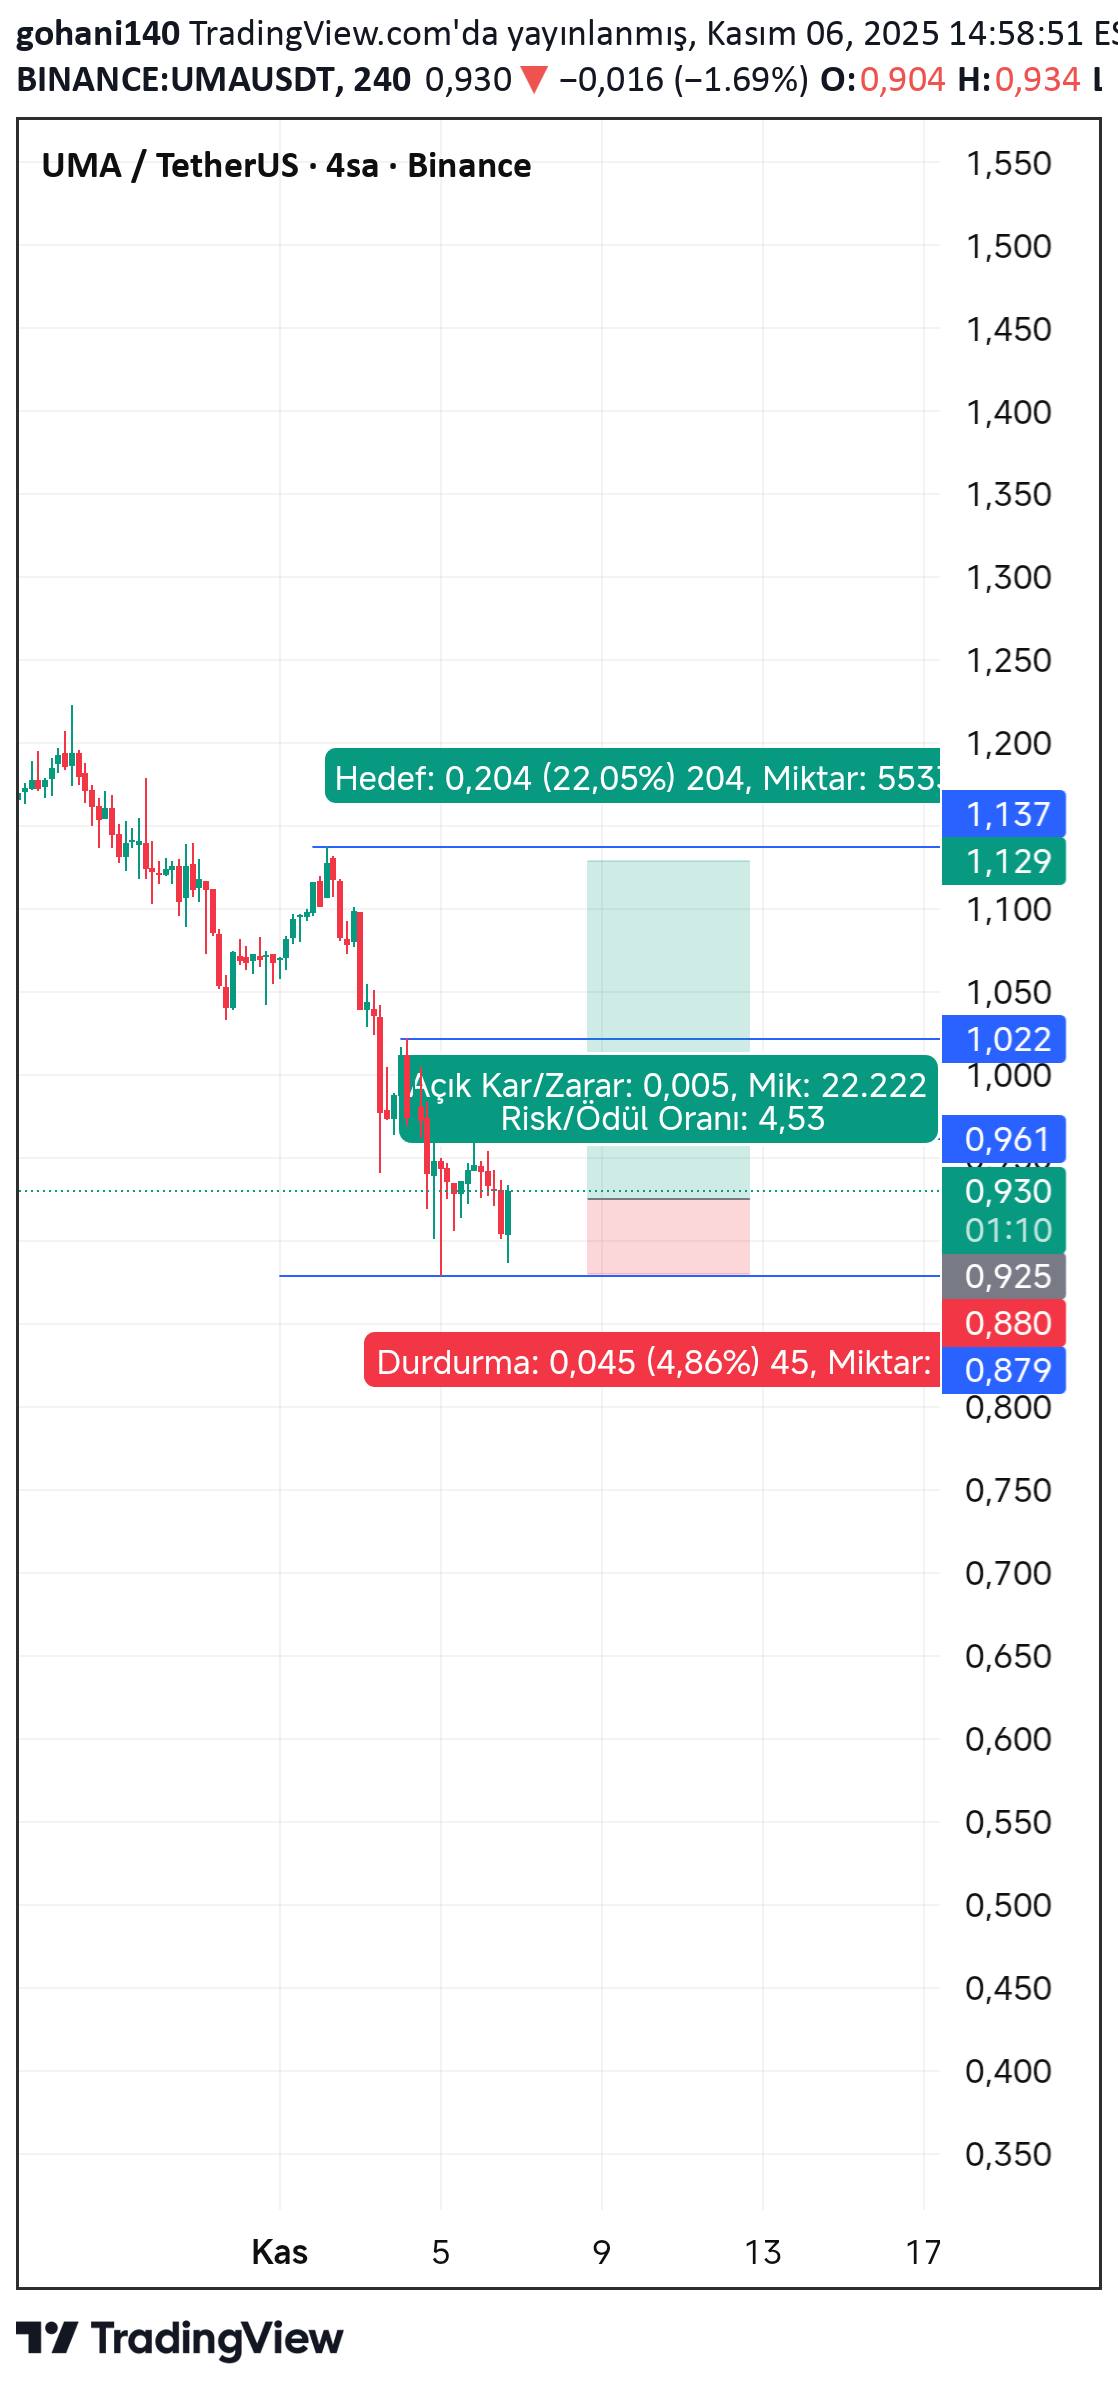
Now, if we think that there is no breakout here, we should hurry up and come back anyway, we will do a test considering 5% loss and see what the result will be, let's see if we are back down or not.

soheylifar
پیشبینی صعودی کوتاهمدت UMA/USDT: هدفهای قیمتی جدید!
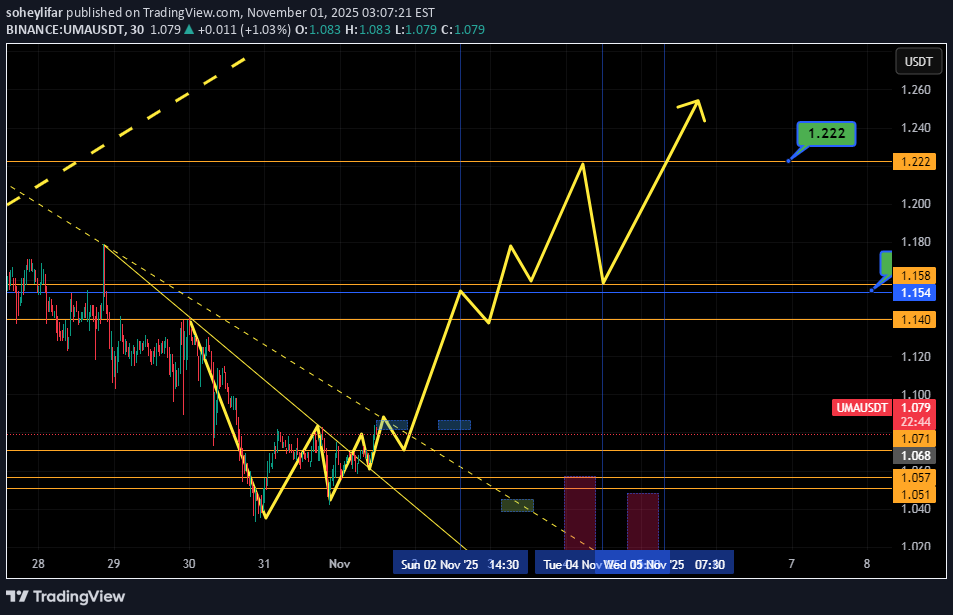
Dear Friends, as i left comments for UMA , i exepect to hit to 0.9 usdt. it has been already touched the 0.95 USDT and rejected from there, i think there is no room to hit 0.95 or 0.9 again in order to make a double bottom. SO , i expect 1.071 1.087 1.1 1.14 1.154 1.222 after that we'll review the chart in due course. this is just an idea and for your trade, please investigate more. my regards,

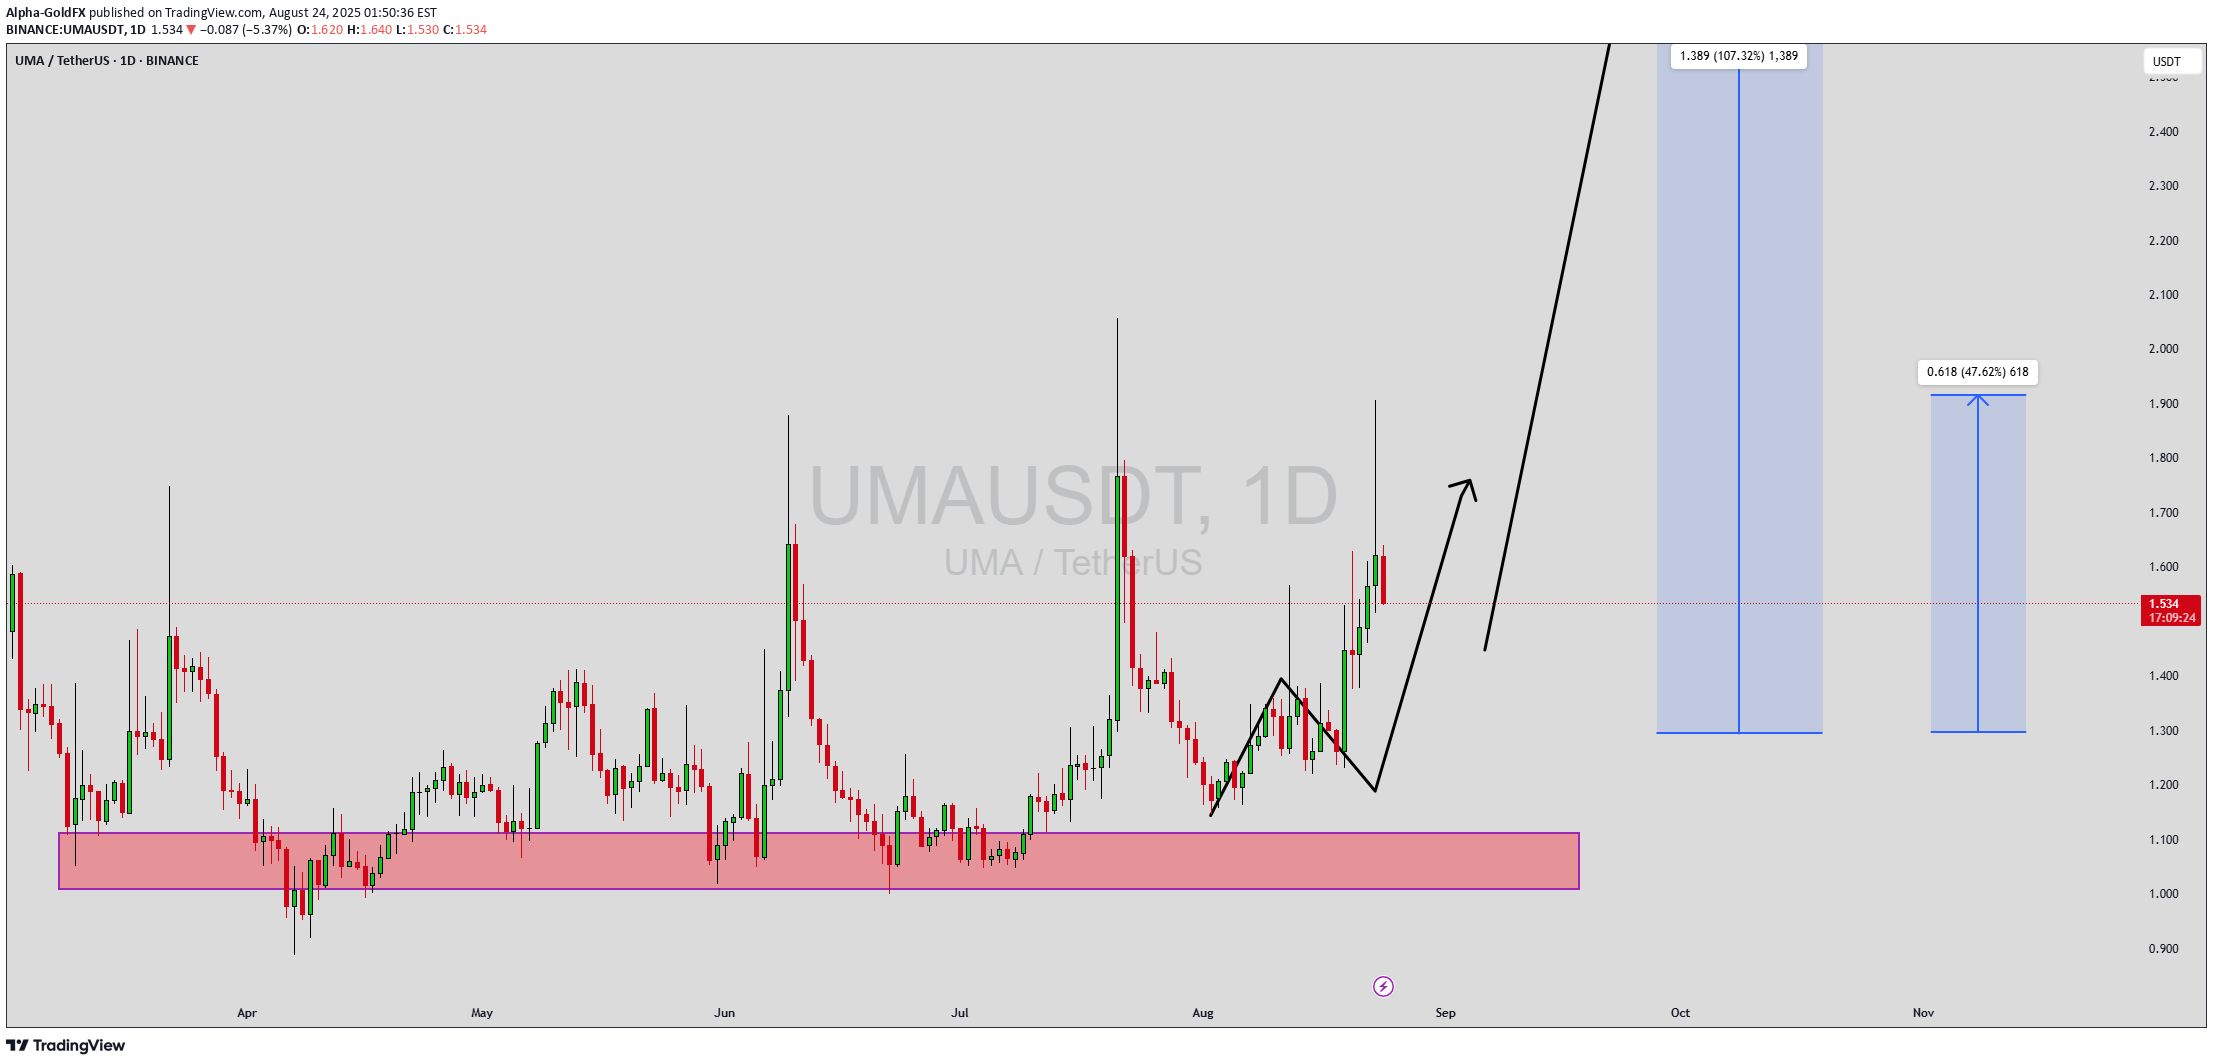
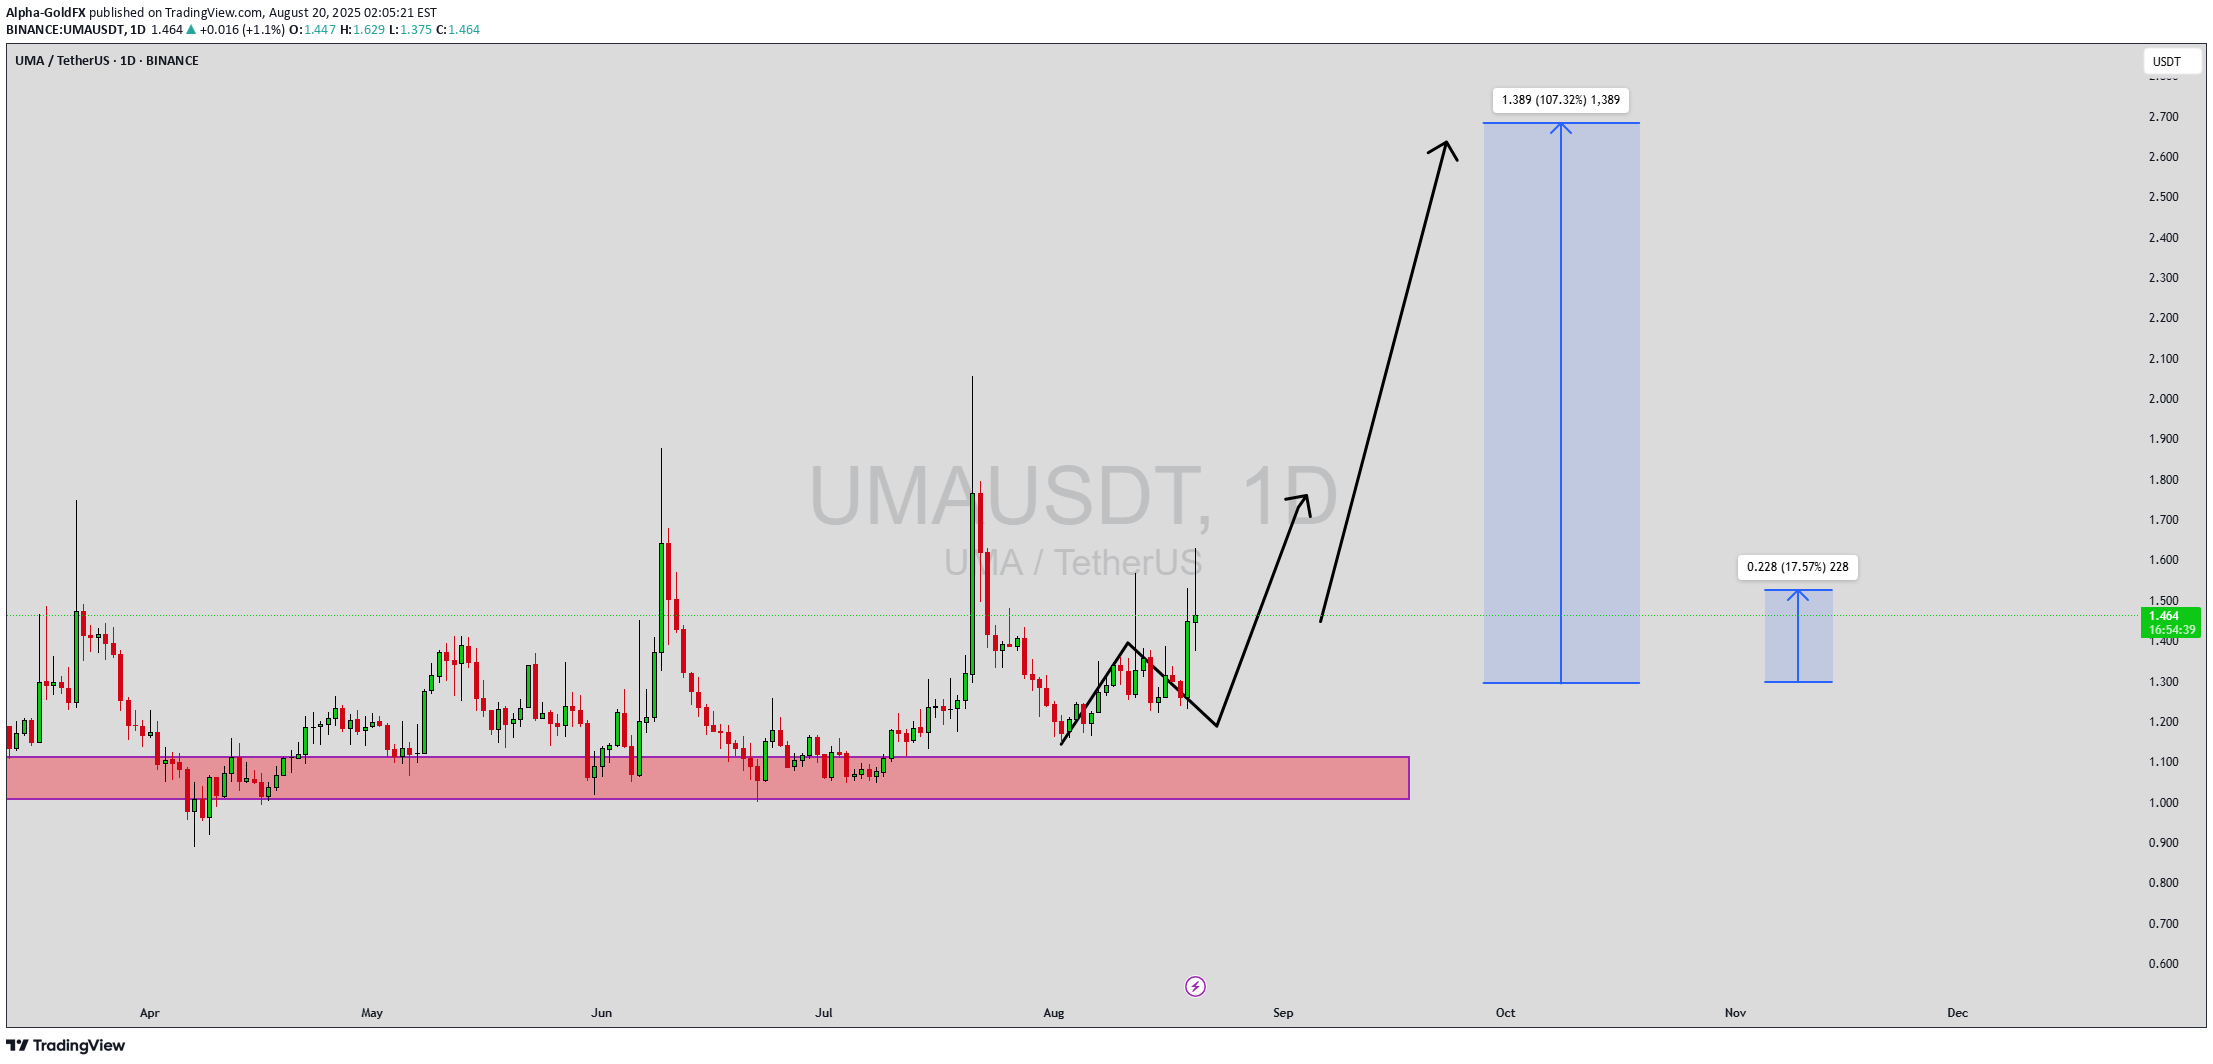
Alpha-GoldFX
سیگنال صعودی قوی UMAUSDT: آیا منتظر رشد ۹۰ درصدی هستیم؟

UMAUSDT is showing a falling wedge pattern, which is widely recognized as a bullish reversal indicator in technical analysis. This pattern typically forms during a downtrend when price movements begin to narrow, suggesting that bearish momentum is losing strength and a potential breakout to the upside may be near. The good trading volume observed reinforces this outlook, indicating that accumulation may already be taking place as traders anticipate a strong upward push. If a breakout occurs above the resistance line, UMAUSDT could see impressive gains of 90% to 100%+ in the coming sessions. From a chart perspective, the falling wedge formation often precedes major bullish rallies when confirmed by increasing volume and consistent higher lows. UMAUSDT’s current setup fits this narrative perfectly, with clear signs of consolidation before an expected surge. Technical traders often view such patterns as prime opportunities to enter ahead of a reversal, especially when supported by favorable market sentiment and growing investor interest. The recent uptick in attention from market participants further supports the bullish potential of UMAUSDT. Investors appear to be positioning early, recognizing the value opportunity as the token approaches a critical technical breakout zone. This growing confidence could fuel a strong buying wave once confirmation is achieved, setting the stage for a sustained upward trend. ✅ Show your support by hitting the like button and ✅ Leaving a comment below! (What is You opinion about this Coin) Your feedback and engagement keep me inspired to share more insightful market analysis with you!

Bithereum_io
تحلیل UMA/USDT: فرصت خرید در کف کانال نزولی و اهداف انفجاری پس از شکست!

#UMA is moving inside a falling wedge pattern on the daily chart. Consider buying here and near the support levels of: $1.013 and $0.826 In case of a breakout above the wedge resistance and the daily SMA100, the potential targets are: 🎯 $1.352 🎯 $1.518 🎯 $1.684 🎯 $1.920 🎯 $2.220 ⚠️ Always remember to use a tight stop-loss and maintain proper risk management.

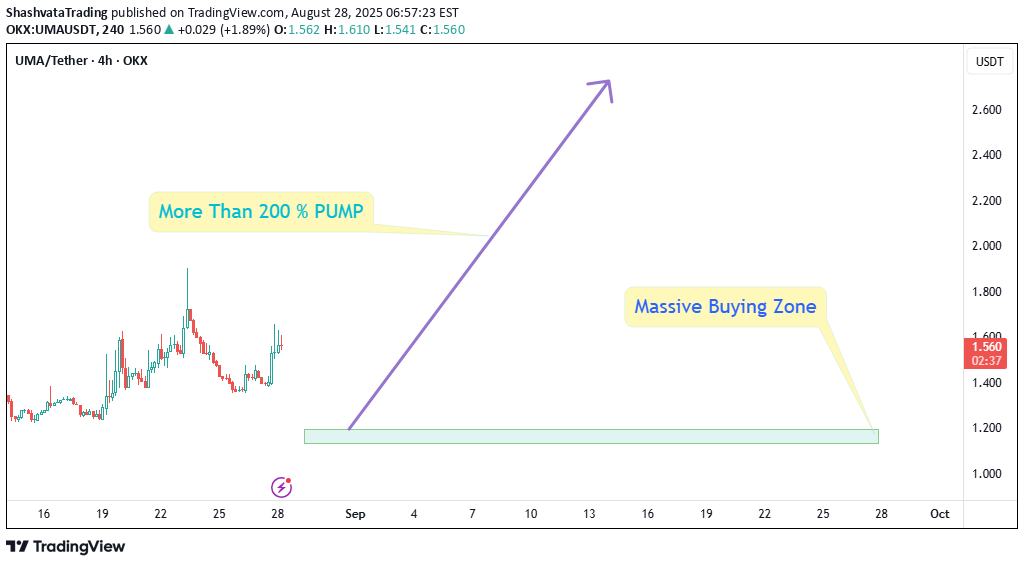
ShashvataTrading
Alpha-GoldFX
UMAUSDT Forming Bullish Wave
UMAUSDT is currently demonstrating a bullish wave pattern, signaling strong upward momentum and trend continuation. This wave formation suggests that the coin has entered a healthy impulsive phase, where higher highs and higher lows are forming consistently. The recent price action shows accumulation at key support levels, followed by breakout moves that align with this bullish structure, indicating renewed confidence among buyers. Volume has remained consistently strong, which adds further credibility to the bullish wave pattern. Increasing trading volume during each leg up is a key confirmation that institutional and retail traders alike are stepping in. UMA, the native token of the UMA protocol focused on decentralized finance derivatives, is gaining traction again, fueled by both technical momentum and renewed interest in DeFi utility tokens. With an expected gain range of 40% to 45%+, UMA appears poised for a substantial upside move if the current pattern plays out. Key resistance levels will need to be tested and broken, but the wave structure suggests buyers are in control. This setup presents an appealing opportunity for swing traders and trend followers who look for high-potential breakout trades with strong volume support. ✅ Show your support by hitting the like button and ✅ Leaving a comment below! (What is You opinion about this Coin) Your feedback and engagement keep me inspired to share more insightful market analysis with you!

CryptoNuclear
UMAUSDT — Major Battle at Demand Zone, Waiting for Breakout?
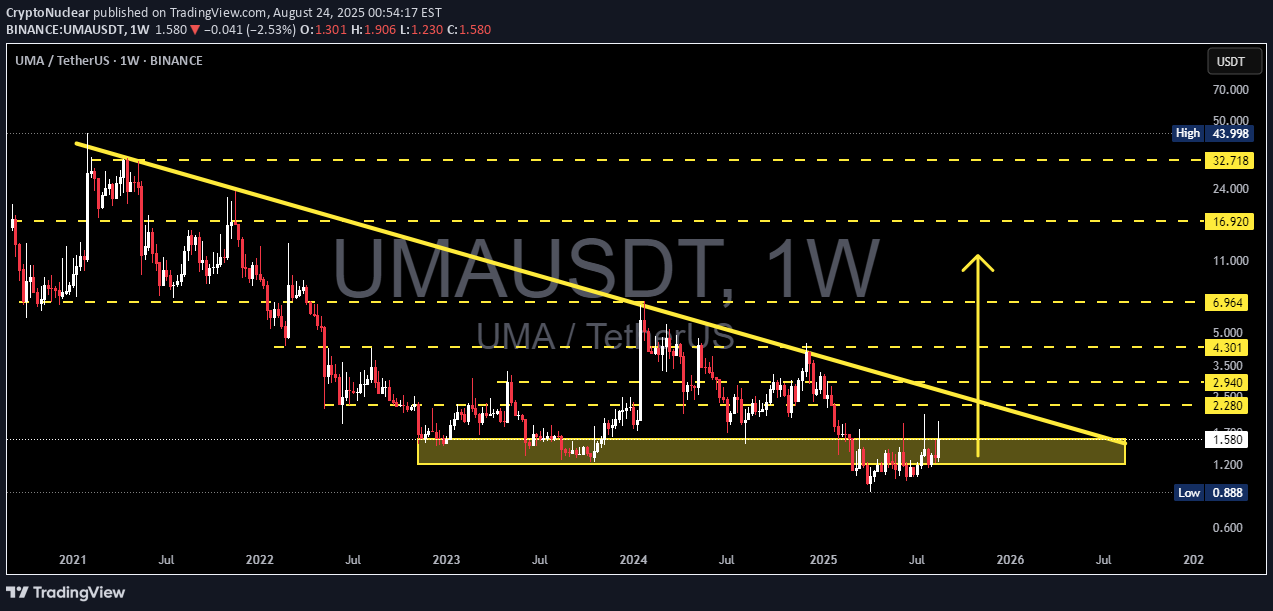
🔎 Overview The weekly chart of UMA/USDT is showing a very interesting setup: Since 2021, price action has been consistently forming lower highs, capped by a long-term descending trendline (yellow line). On the other side, buyers continue to defend the strong demand zone at 1.20 – 1.70 (yellow box). This structure has formed a multi-year descending triangle/base — a strong sign of long-term accumulation and compression. In short, UMA is now at a crucial decision point: either a breakout that may spark a new bullish phase, or a breakdown toward new lows. --- 🟢 Bullish Scenario 1. The first confirmation will be a weekly close above the descending trendline and key horizontal level 2.28 USDT. 2. If confirmed, potential upside targets are: 2.94 USDT → minor resistance 3.50 USDT → psychological level & prior supply zone 4.30 USDT → major resistance 6.96 USDT → extended target for strong momentum 3. A high-volume breakout could trigger a short squeeze, accelerating price movement upward. 📌 Key point: A breakout above 2.28 could open the door toward the 4–7 USDT range. --- 🔴 Bearish Scenario 1. If the price fails to hold 1.20 – 1.30 USDT, the major demand zone collapses. 2. Next key downside target will be 0.888 USDT (the historical low). 3. Losing that level would push UMA into new price discovery to the downside, with no strong support below. 📌 Key point: Below 1.20, bearish pressure dominates, with risk of retesting 0.888 USDT. --- 📐 Pattern & Current Setup Pattern: Multi-year descending triangle with flat demand vs sloping supply. Current state: Sideways inside demand, waiting for a decisive move. Sentiment: Neutral → Bullish if breakout confirmed, Bearish if demand breaks. Weekly timeframe: Always wait for weekly close confirmations, not just intraday wicks. --- ⚖️ Trading Plan & Risk Management Conservative traders: Wait for a confirmed breakout and retest above 2.28 before entering. Aggressive traders: May accumulate small positions inside 1.20–1.70 demand zone with tight stop-loss below 1.20. Risk/Reward: Attractive setup since downside is limited (tight invalidation), while upside targets are layered and potentially exponential. --- 🔥 Final Takeaway: UMA is at a multi-year inflection point. As long as the demand zone holds, it remains an attractive accumulation area. A breakout above the descending trendline could trigger a strong bullish reversal, while losing 1.20 would expose UMA to retest its historical low at 0.888. #UMA #UMAUSDT #CryptoAnalysis #TechnicalAnalysis #PriceAction #DescendingTriangle #SupportResistance #BreakoutSetup #CryptoTrading #AltcoinAnalysis
Bithereum_io
UMAUSDT 1D
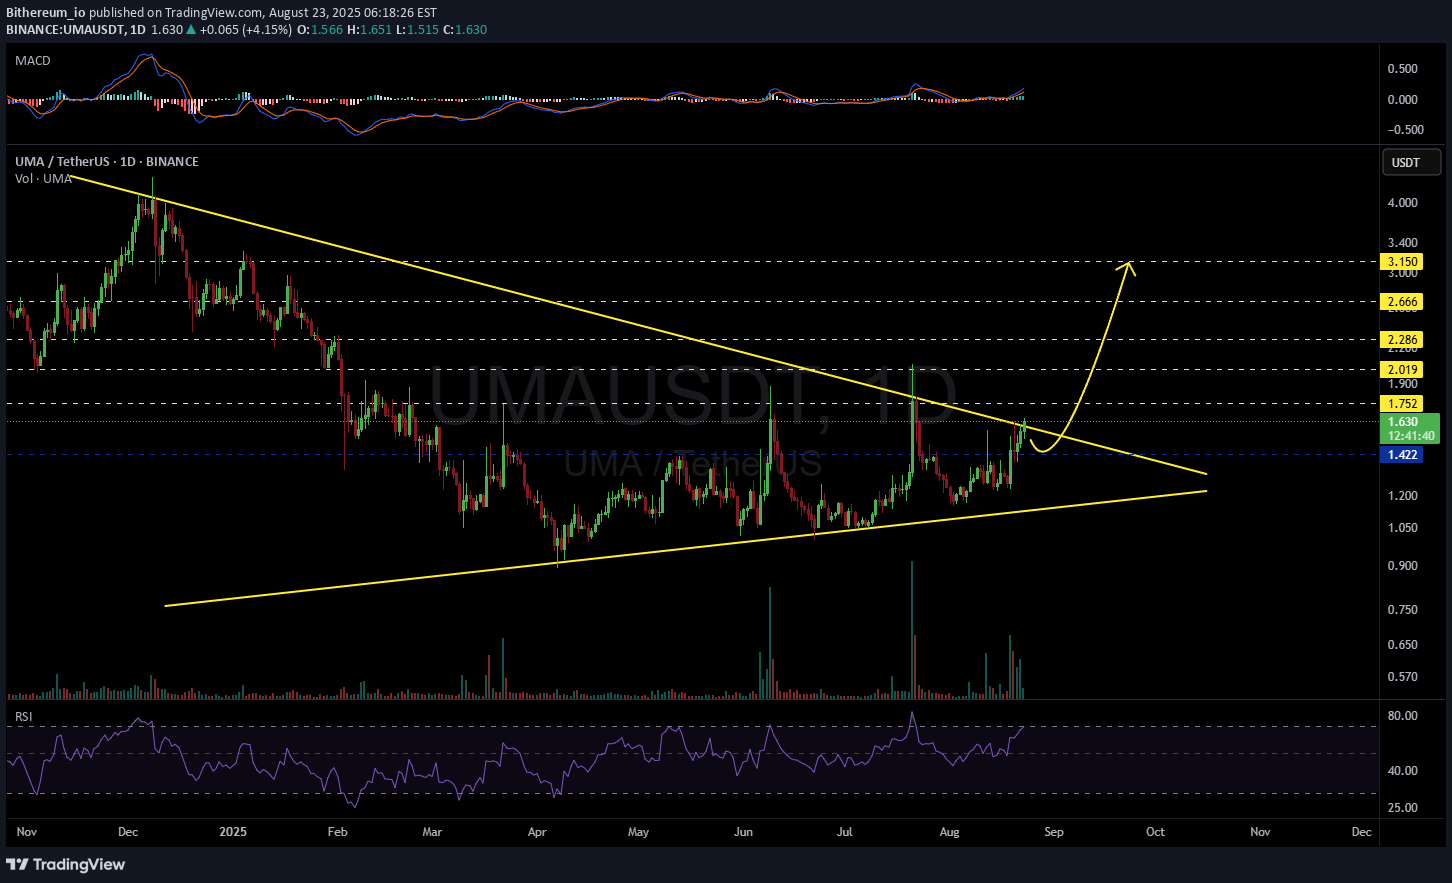
#UMA is moving inside a symmetrical triangle on the daily chart and is on the verge of breaking out above it. Consider buying at the current price and near the support level of $1.422. If the breakout is confirmed, the potential targets are: 🎯 $1.752 🎯 $2.019 🎯 $2.286 🎯 $2.666 🎯 $3.150 ⚠️ As always, use a tight stop-loss and apply proper risk management.

Heruprabowo
UMA Loading a Big Move – Don’t Miss This Setup!
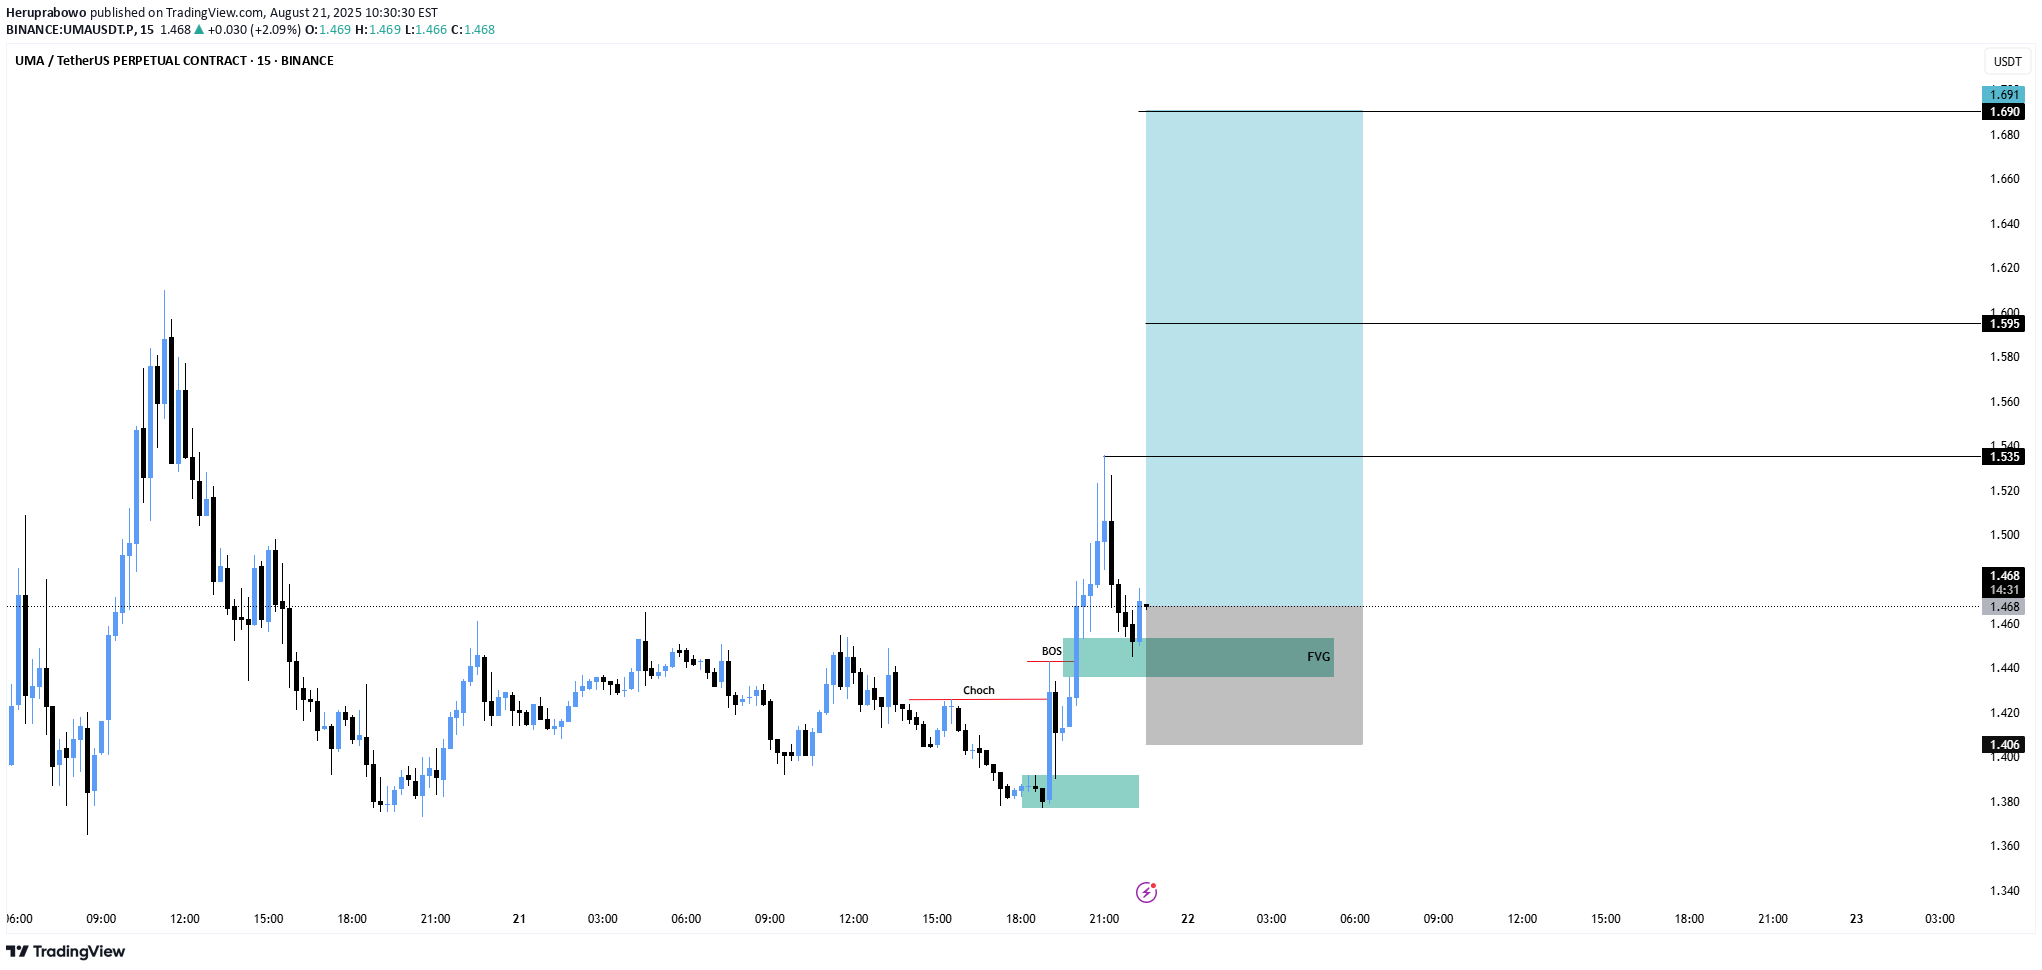
UMA has shown a clear change of character with a bullish break of structure. Price is now retesting the fair value gap (FVG) area, setting up for a possible continuation move upward. Entry: 1.47 Stoploss: 1.406 Targets: 1.535 1.595 1.691 If buyers defend the FVG zone, UMA could rally toward higher targets with strong momentum.
Alpha-GoldFX
UMAUSDT Forming Bullish Wave
UMAUSDT is currently demonstrating a bullish wave pattern, signaling strong upward momentum and trend continuation. This wave formation suggests that the coin has entered a healthy impulsive phase, where higher highs and higher lows are forming consistently. The recent price action shows accumulation at key support levels, followed by breakout moves that align with this bullish structure, indicating renewed confidence among buyers. Volume has remained consistently strong, which adds further credibility to the bullish wave pattern. Increasing trading volume during each leg up is a key confirmation that institutional and retail traders alike are stepping in. UMA, the native token of the UMA protocol focused on decentralized finance derivatives, is gaining traction again, fueled by both technical momentum and renewed interest in DeFi utility tokens. With an expected gain range of 90% to 100%+, UMA appears poised for a substantial upside move if the current pattern plays out. Key resistance levels will need to be tested and broken, but the wave structure suggests buyers are in control. This setup presents an appealing opportunity for swing traders and trend followers who look for high-potential breakout trades with strong volume support. ✅ Show your support by hitting the like button and ✅ Leaving a comment below! (What is You opinion about this Coin) Your feedback and engagement keep me inspired to share more insightful market analysis with you!
Disclaimer
Any content and materials included in Sahmeto's website and official communication channels are a compilation of personal opinions and analyses and are not binding. They do not constitute any recommendation for buying, selling, entering or exiting the stock market and cryptocurrency market. Also, all news and analyses included in the website and channels are merely republished information from official and unofficial domestic and foreign sources, and it is obvious that users of the said content are responsible for following up and ensuring the authenticity and accuracy of the materials. Therefore, while disclaiming responsibility, it is declared that the responsibility for any decision-making, action, and potential profit and loss in the capital market and cryptocurrency market lies with the trader.