
ULTIMA
Ultima
| تریدر | نوع سیگنال | حد سود/ضرر | زمان انتشار | مشاهده پیام |
|---|---|---|---|---|
No results found. | ||||
Price Chart of Ultima
سود 3 Months :
سیگنالهای Ultima
Filter
Sort messages by
Trader Type
Time Frame

Crypto_Inside_trading
ULTIMA در بازار نزولی میتازد: راز رشد انفجاری و فرصت طلایی خرید بالای 5746 دلار!
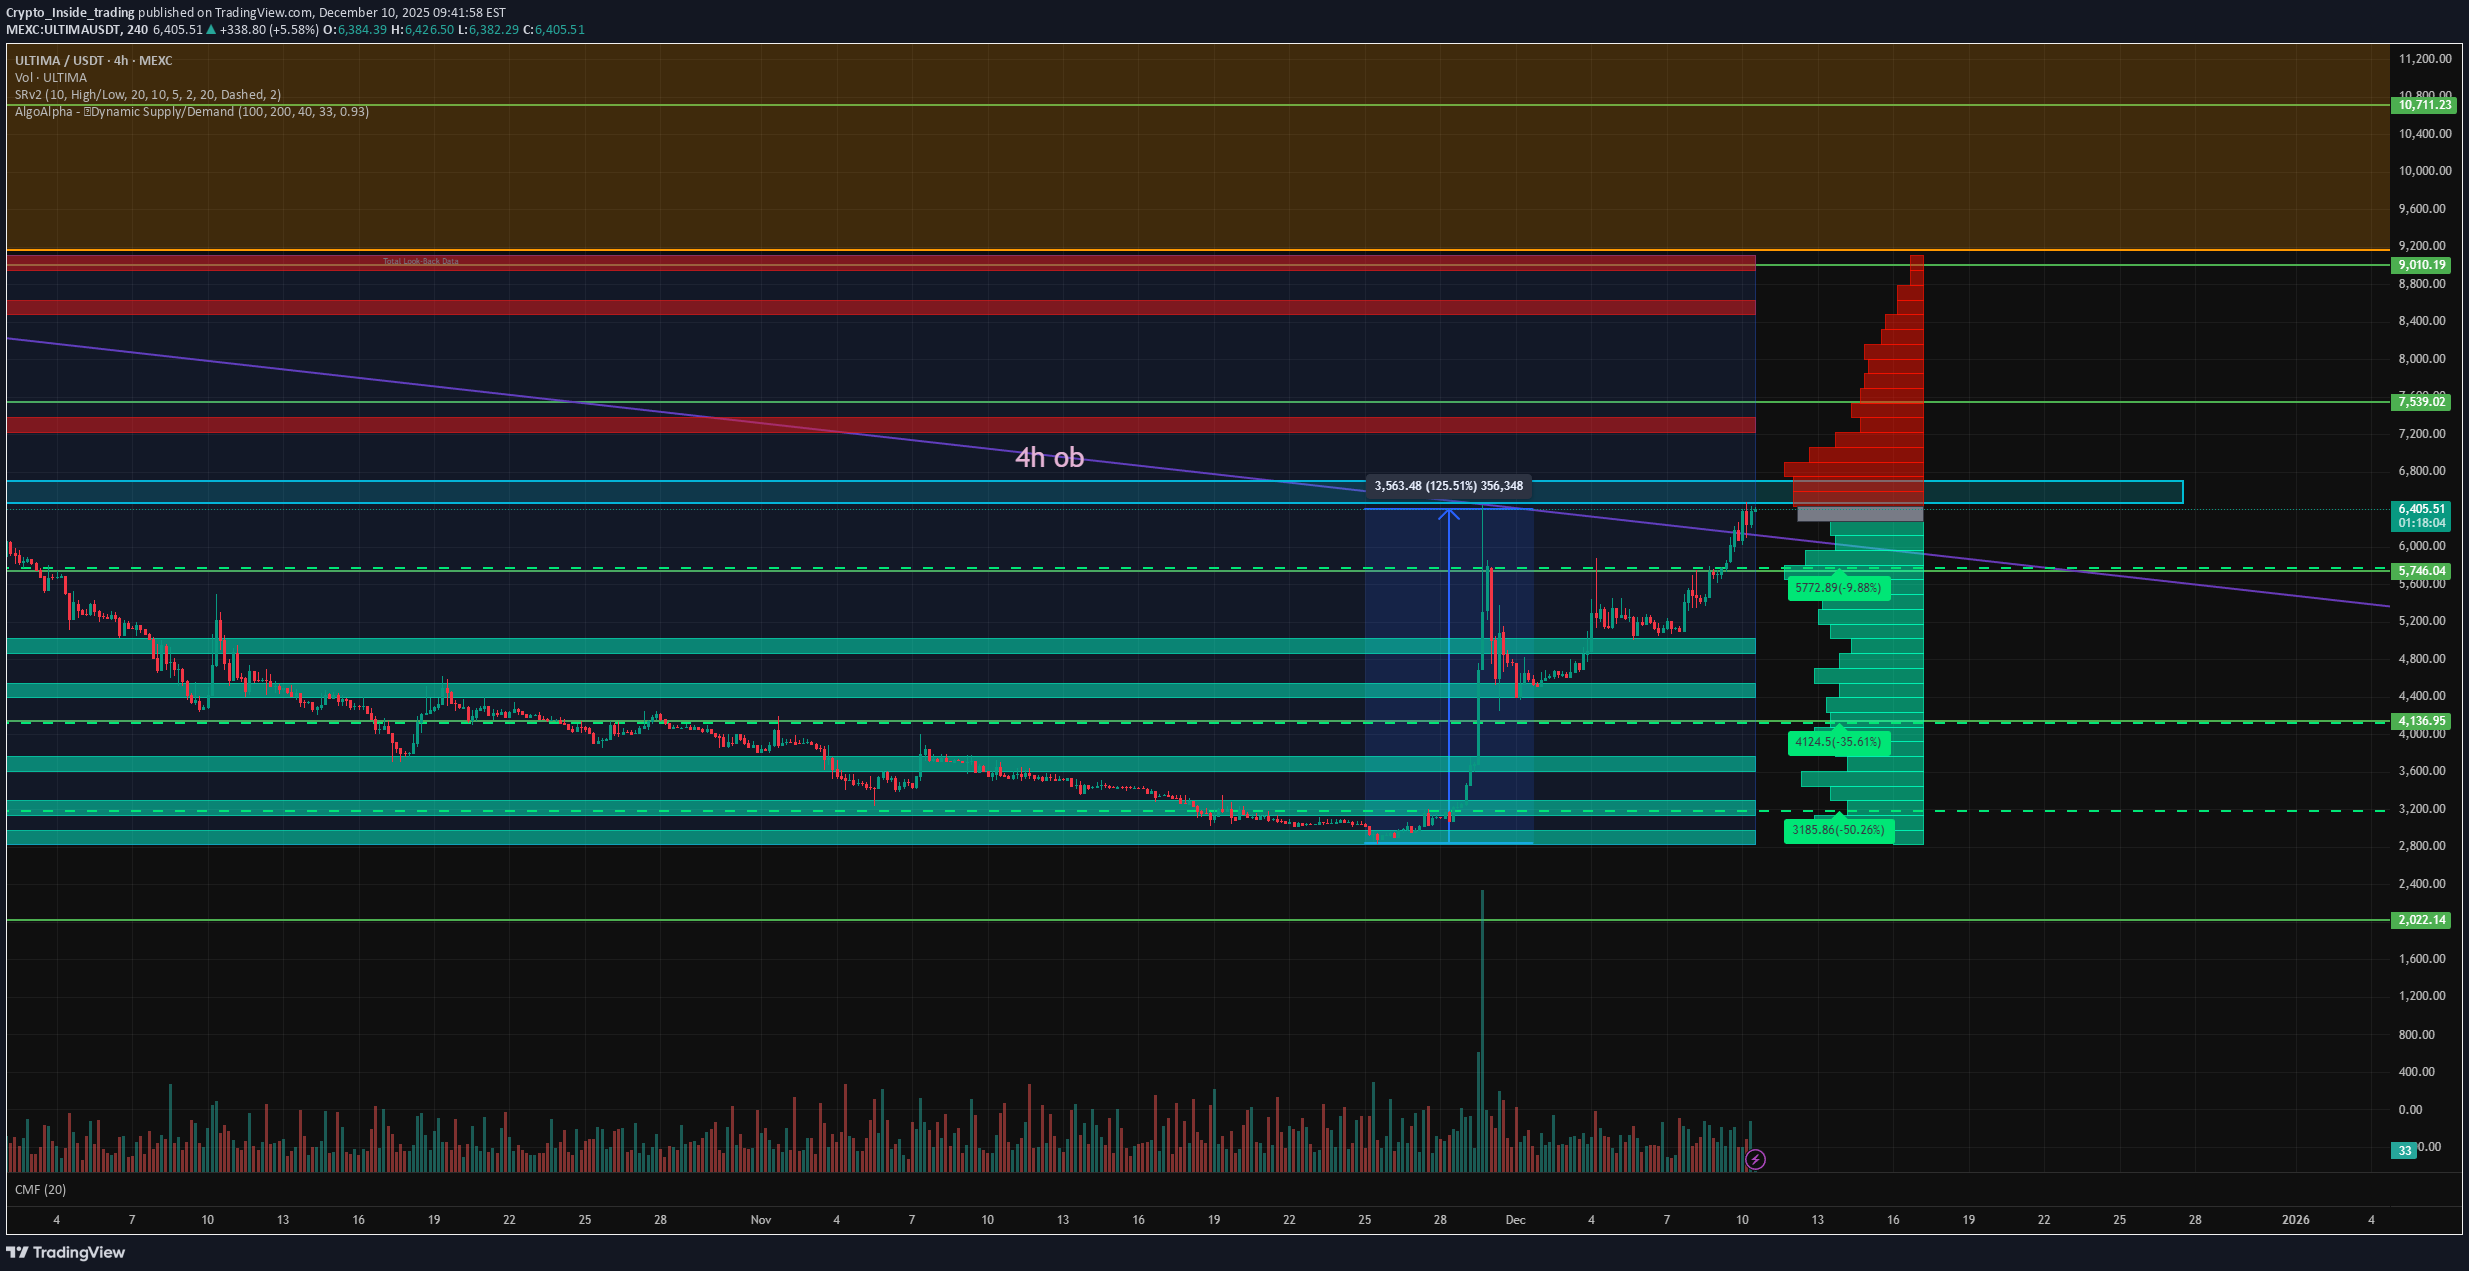
Over the past month, markets have been in far from the best condition, to put it mildly. But even in such periods, there are tokens that continue to perform. I’ve been following ULTIMA for a long time, and this token always shows its strength during tough market phases. 📈 This recurring pattern many times over leads to the idea that large players are likely reallocating capital into ULTIMA during such periods. This theory is supported by the fact that ULTIMA’s price moves are always large and fast. In just the last two weeks, the token has gained more than 100% in price! And this is not a one-time pump and dump — it’s a consistent pattern that has been working for many years. ✅ At the moment, the price has consolidated above the key level at $5,746. Holding this level opens the path to a quick move to $7,539, where the next major support level is located. ✅ The price has also broken the descending resistance, marking the end of the bearish trend and a transition into a growth phase. ✅ The Supply and Demand indicator shows that at these levels, large demand zones are forming in the price, which now significantly exceed supply. This means there are almost no sellers left at current prices. ✅ Also, a halving is planned soon in ULTIMA, which will only increase the value of each coin. ✅ And let me remind you that after its peak, the price dropped significantly, likely due to selling by large players. As a result, there are no major resistance zones or order blocks above — instead, there are large gaps, which, if the price reaches them, will be very easy to close.

WaveRiders2
آپدیت ULTIMA: آیا مقاومت قرمز شکسته میشود یا روند صعودی متوقف میگردد؟
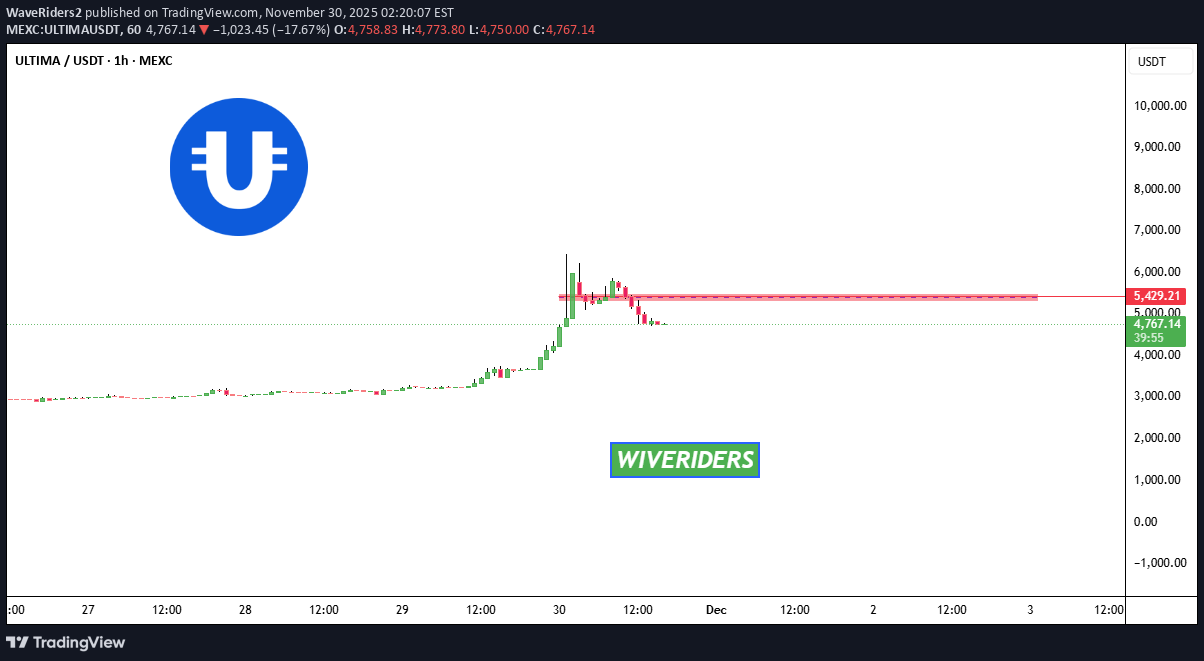
🚨📊 ULTIMA Update ULTIMA, after having a strong uptrend, has now formed a new resistance zone in red 🔴. This level is acting as a strong ceiling, and price must break out above this red resistance to continue its bullish momentum. Until that breakout happens, upside stays limited and sellers may hold control at this zone.
Crypto_Inside_trading
ULTIMA back to the game
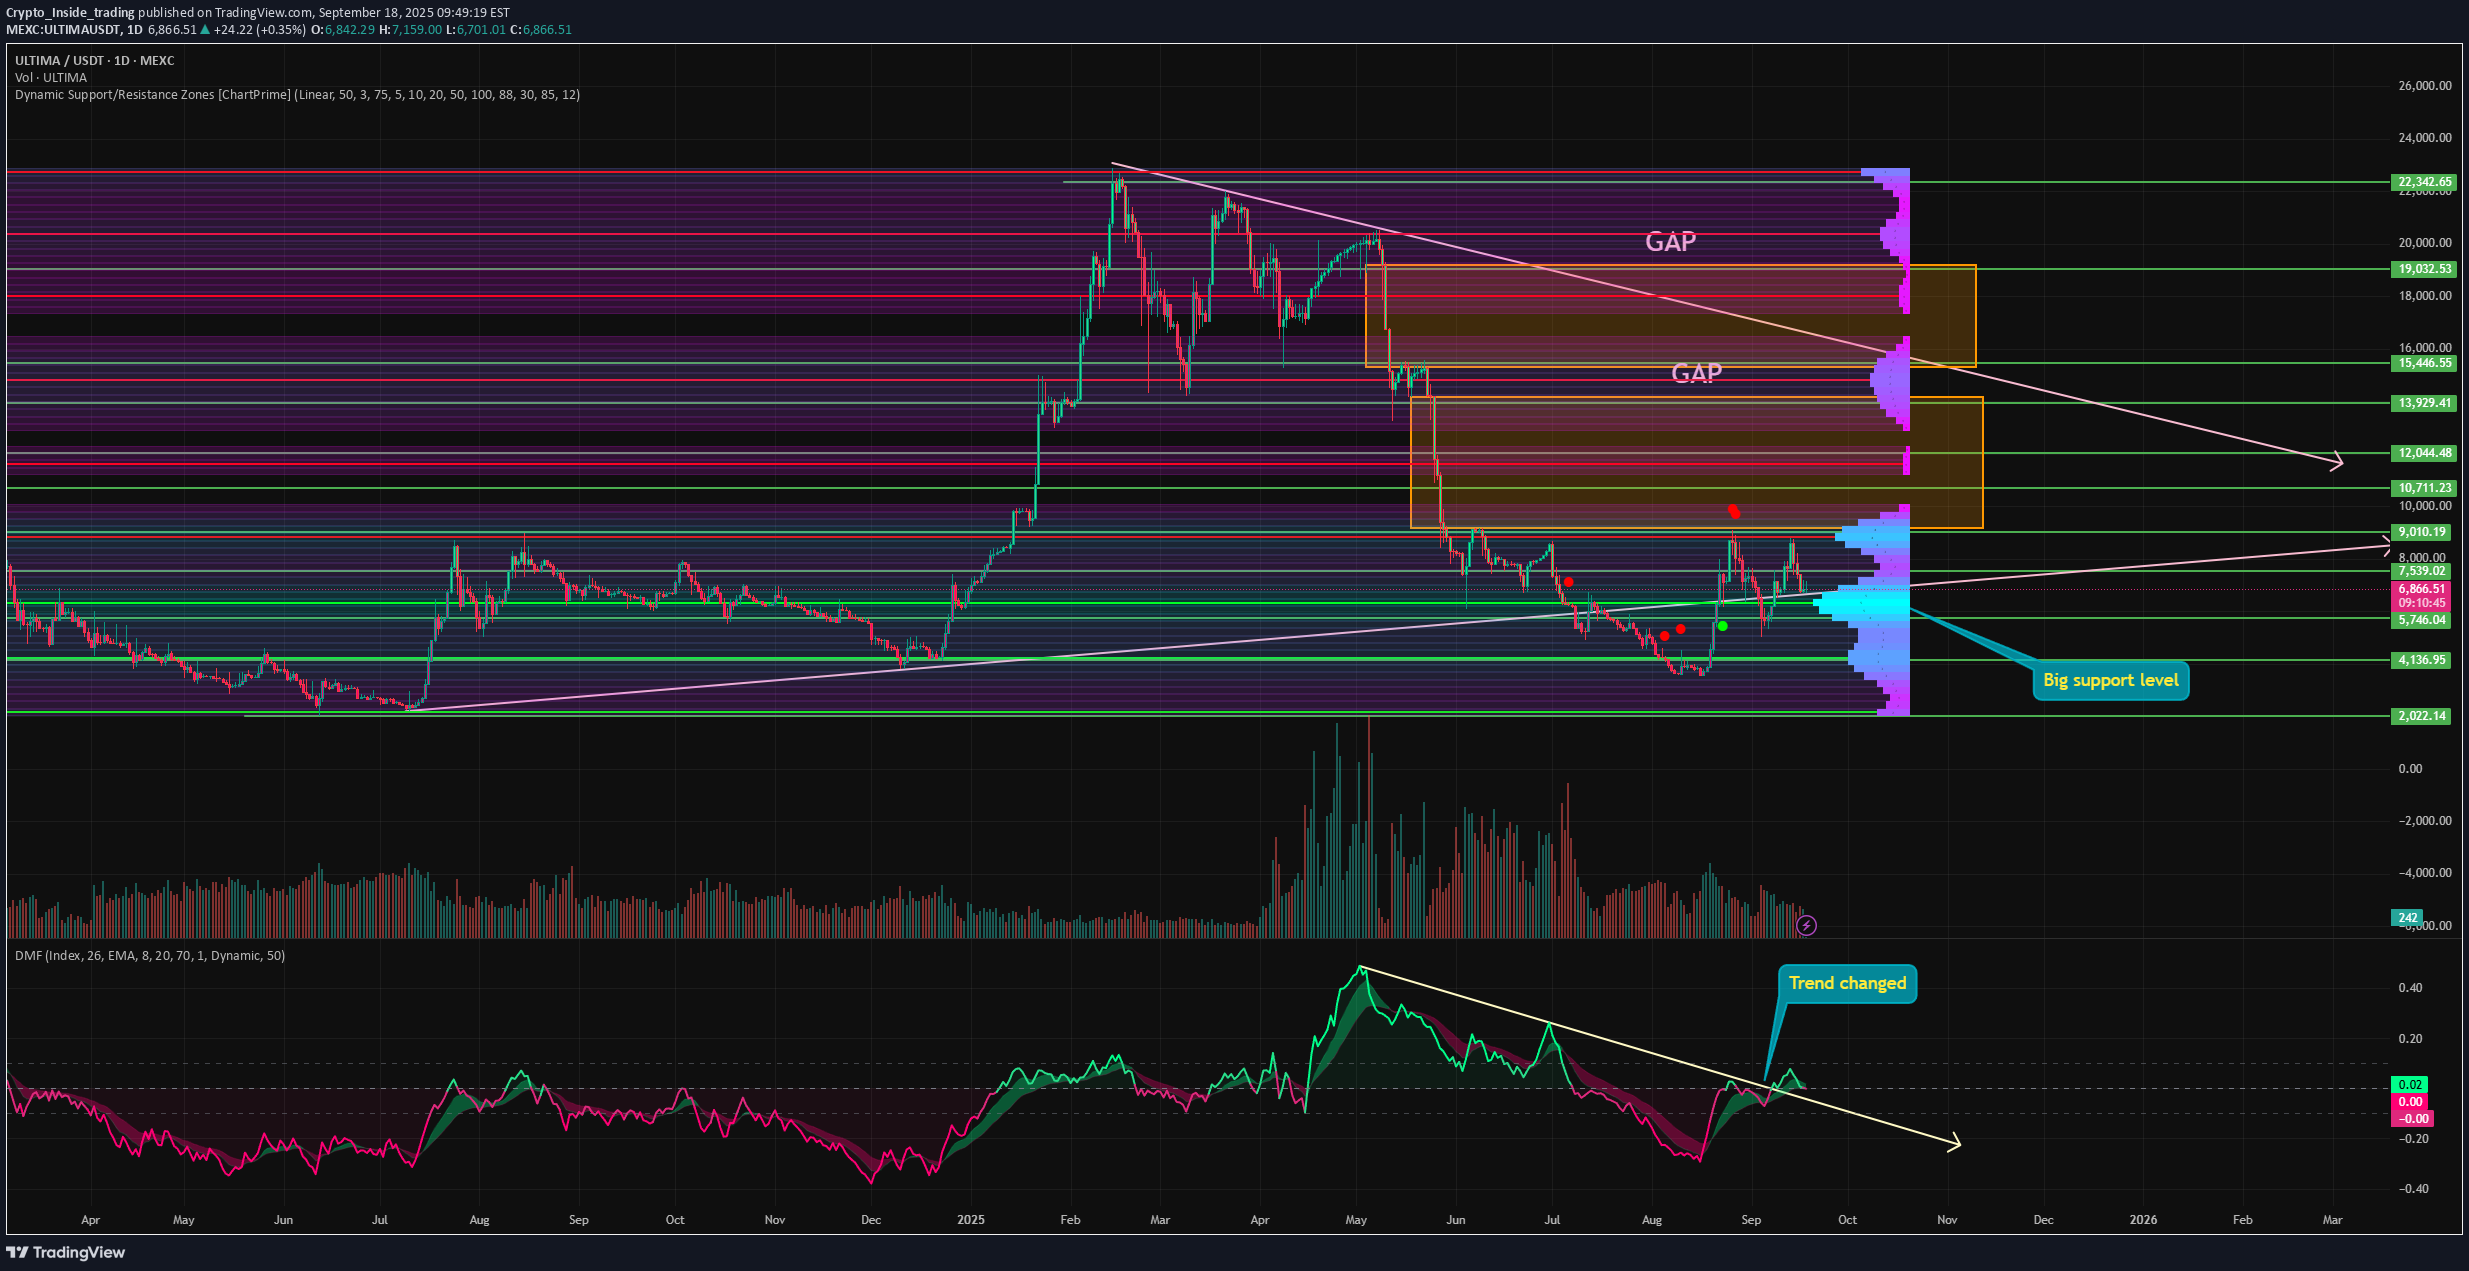
⚡️ Over the past month, ULTIMA has grown by more than 100% — and it looks like this might be just the beginning of a new long-term trend. Here’s why: ➡️ The price has returned to the flag pattern after a long squeeze. Having flushed out overleveraged traders, the token can now return to organic growth driven by spot buying. Considering the company’s hyper-deflationary model (which I haven’t seen anywhere else), the token’s value is likely to keep rising. ➡️ The liquidity outflow trend that had persisted since May has finally been broken, which means outflows are over and capital is flowing back into the asset. This could spark a fresh wave of money into ULTIMA in the near future. ➡️ The Support/Resistance indicator shows a large demand zone has formed around $6,303, just below the current price. This means any dip below could be quickly bought back up. ➡️ Selling volumes have been declining since March and are now at cycle lows. Historically, the end of sell-offs signals a trend reversal and a shift in control to buyers. And don’t forget about the two upside GAPs, which continue to pull the price toward them — and as you know, 99% of GAPs get filled sooner or later. 📌 Overall, nearly all factors now point to a trend reversal in ULTIMA. Combined with the recent U.S. rate cut and the Altseason Index hitting 100, this could make ULTIMA one of the main beneficiaries of the coming months.
Crypto_Inside_trading
A new trend leg in ULTIMA has already begun
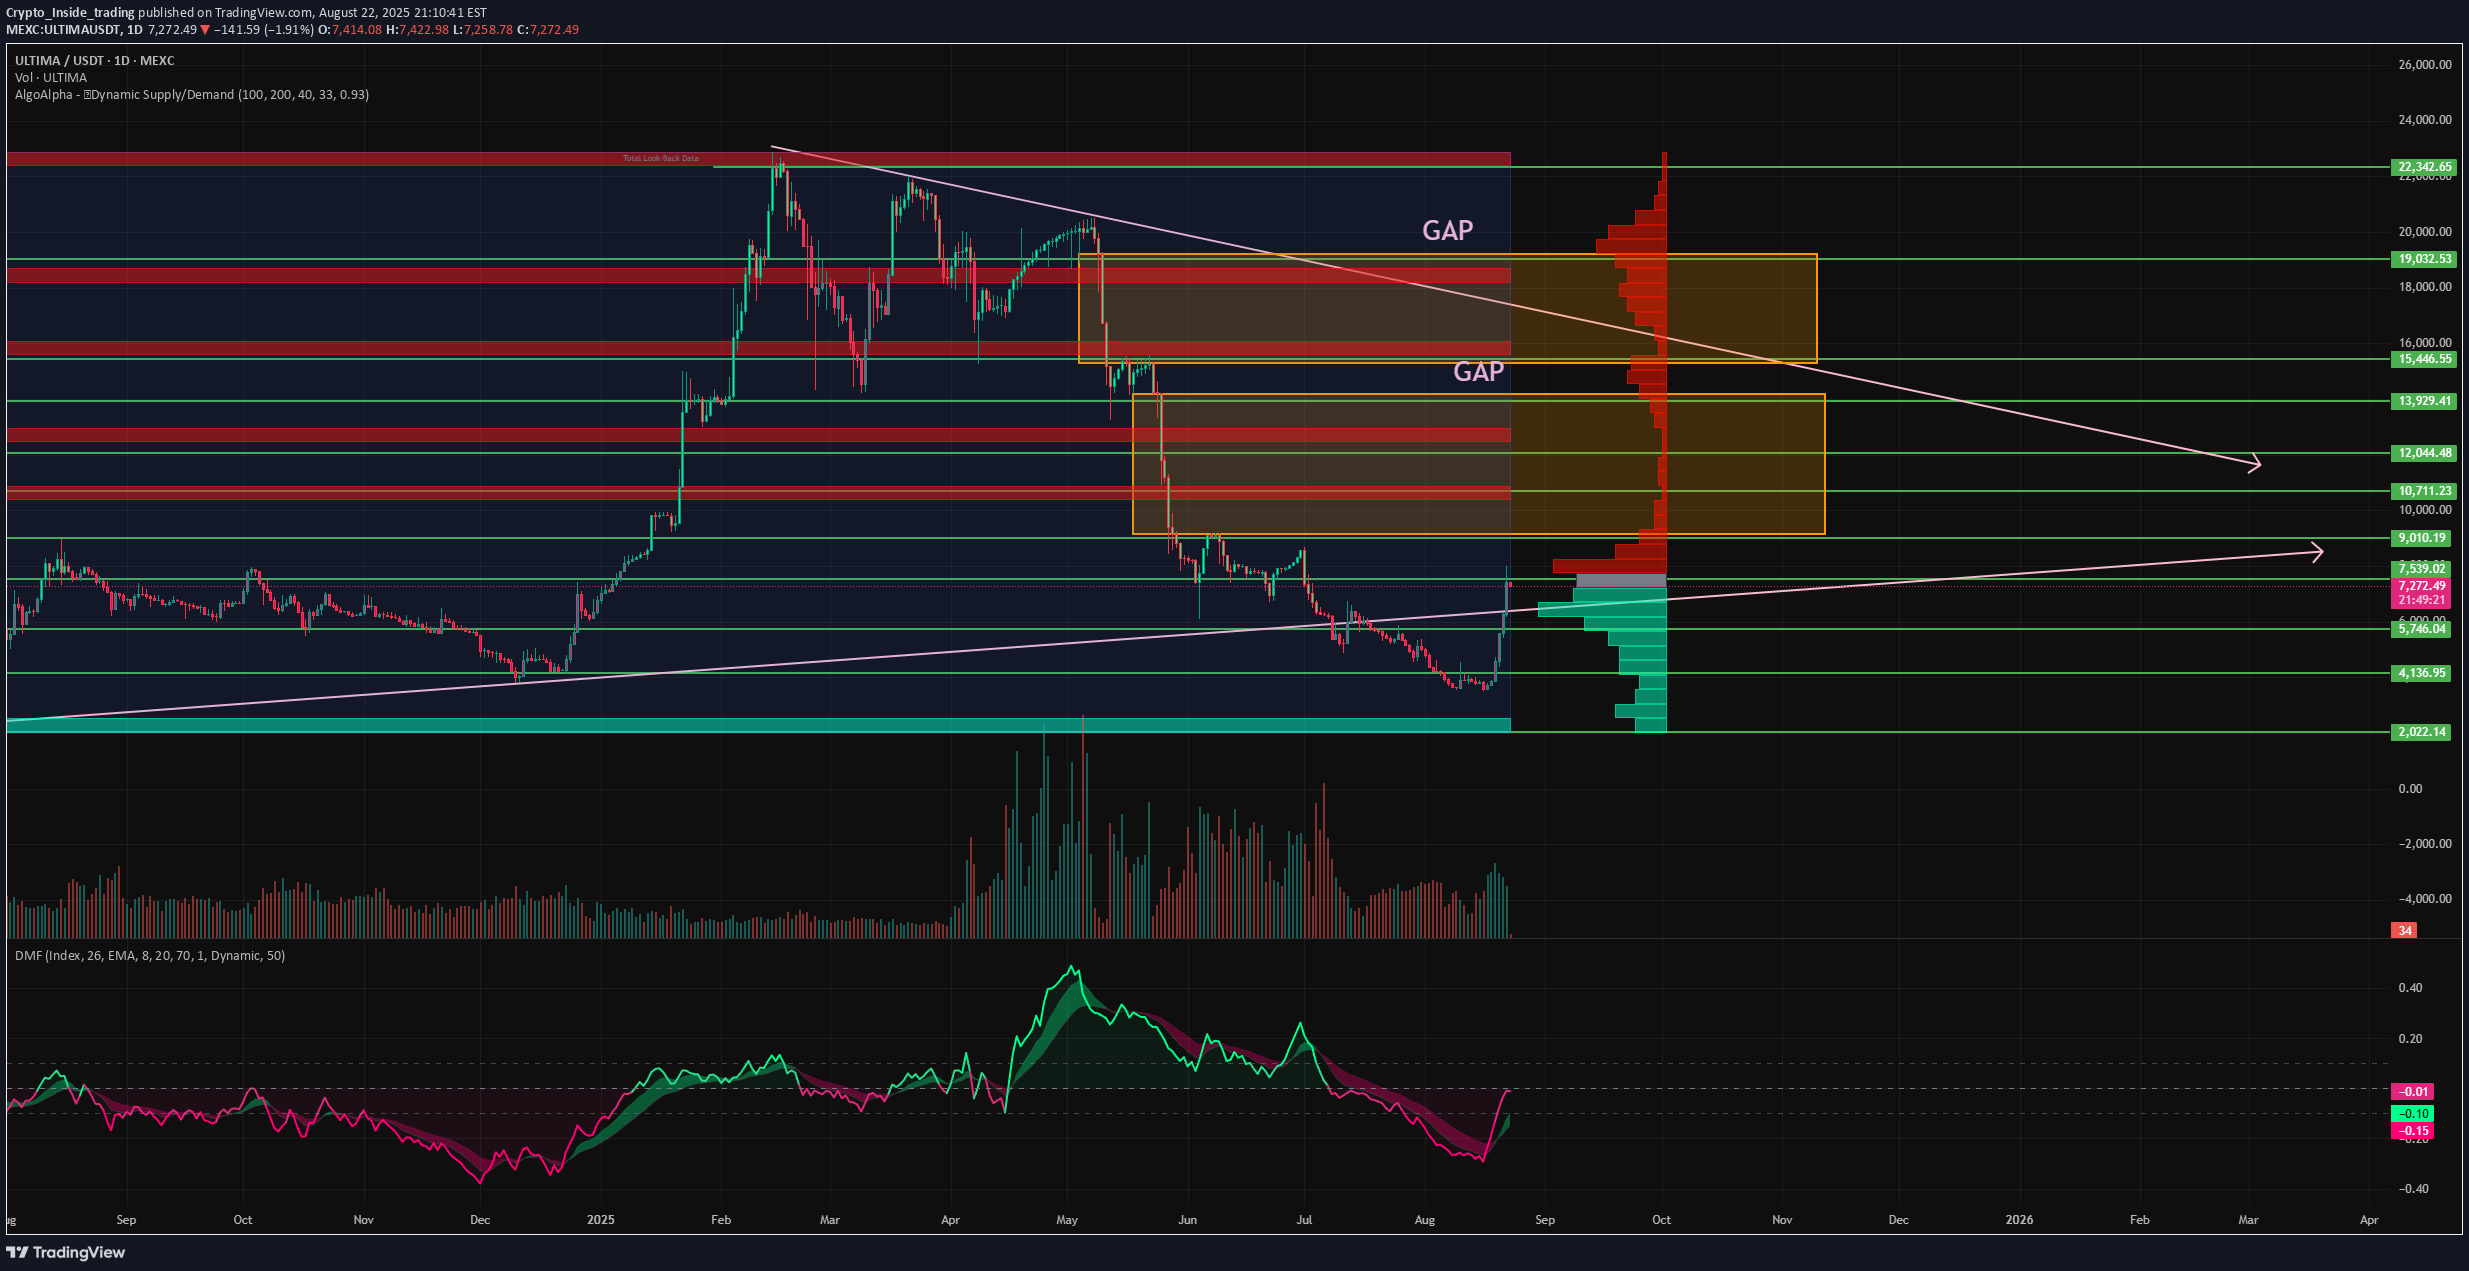
I’ve reviewed this token many times before, but many didn’t pay enough attention. Over the past week, however, it has been consistently ranking among the top daily gainers across the entire market. And this is happening while the broader market has been going through a correction. Now, a new trend leg has started in the token, and it has gained more than 100% in just one week. Here’s why this is a new trend and not just a rebound: 1️⃣ Throughout the correction, there was a clear divergence in selling volumes, signaling weakening selling pressure. Now, buyers are taking control. 2️⃣ Money Flow indicates a strong inflow of liquidity into the asset. Such a sharp spike often points to institutional accumulation, as big players historically prefer to crash the price and buy at the bottom. 3️⃣ Supply and Demand shows strong buying demand forming around the $7,200–$5,800 levels and lower, while supply is nearly absent. This makes sense: those who wanted to sell already sold, and the indicator confirms this. With this imbalance, the price is likely to continue climbing with little resistance. 4️⃣ During the steep drop, large GAPs were formed at $19,225–$15,336 and $14,173–$9,194. And as we know, in 99% of cases, gaps eventually get filled, constantly pulling the price towards them. 5️⃣ The price has returned within the flag pattern, which is a neutral pattern but, in a bull market, historically signals an accumulation phase before the next leg up. Combined with the above factors, this strengthens the case for a fresh trend. 📌 Conclusion: Everything now points to the start of a new trend leg. In a bull market, this could lead to a new ATH. The only thing to watch closely now is whether the price can hold above the lower boundary of the flag. That would be the confirmation of the new trend.
Disclaimer
Any content and materials included in Sahmeto's website and official communication channels are a compilation of personal opinions and analyses and are not binding. They do not constitute any recommendation for buying, selling, entering or exiting the stock market and cryptocurrency market. Also, all news and analyses included in the website and channels are merely republished information from official and unofficial domestic and foreign sources, and it is obvious that users of the said content are responsible for following up and ensuring the authenticity and accuracy of the materials. Therefore, while disclaiming responsibility, it is declared that the responsibility for any decision-making, action, and potential profit and loss in the capital market and cryptocurrency market lies with the trader.