
THETA
THETA
| تریدر | نوع سیگنال | حد سود/ضرر | زمان انتشار | مشاهده پیام |
|---|---|---|---|---|
No results found. | ||||
Price Chart of THETA
سود 3 Months :
سیگنالهای THETA
Filter
Sort messages by
Trader Type
Time Frame

CRYPTO:THETAUSD BELKİ BU İLKBAHARDA YA DA SONBAHARDA RALLİ Mİ?
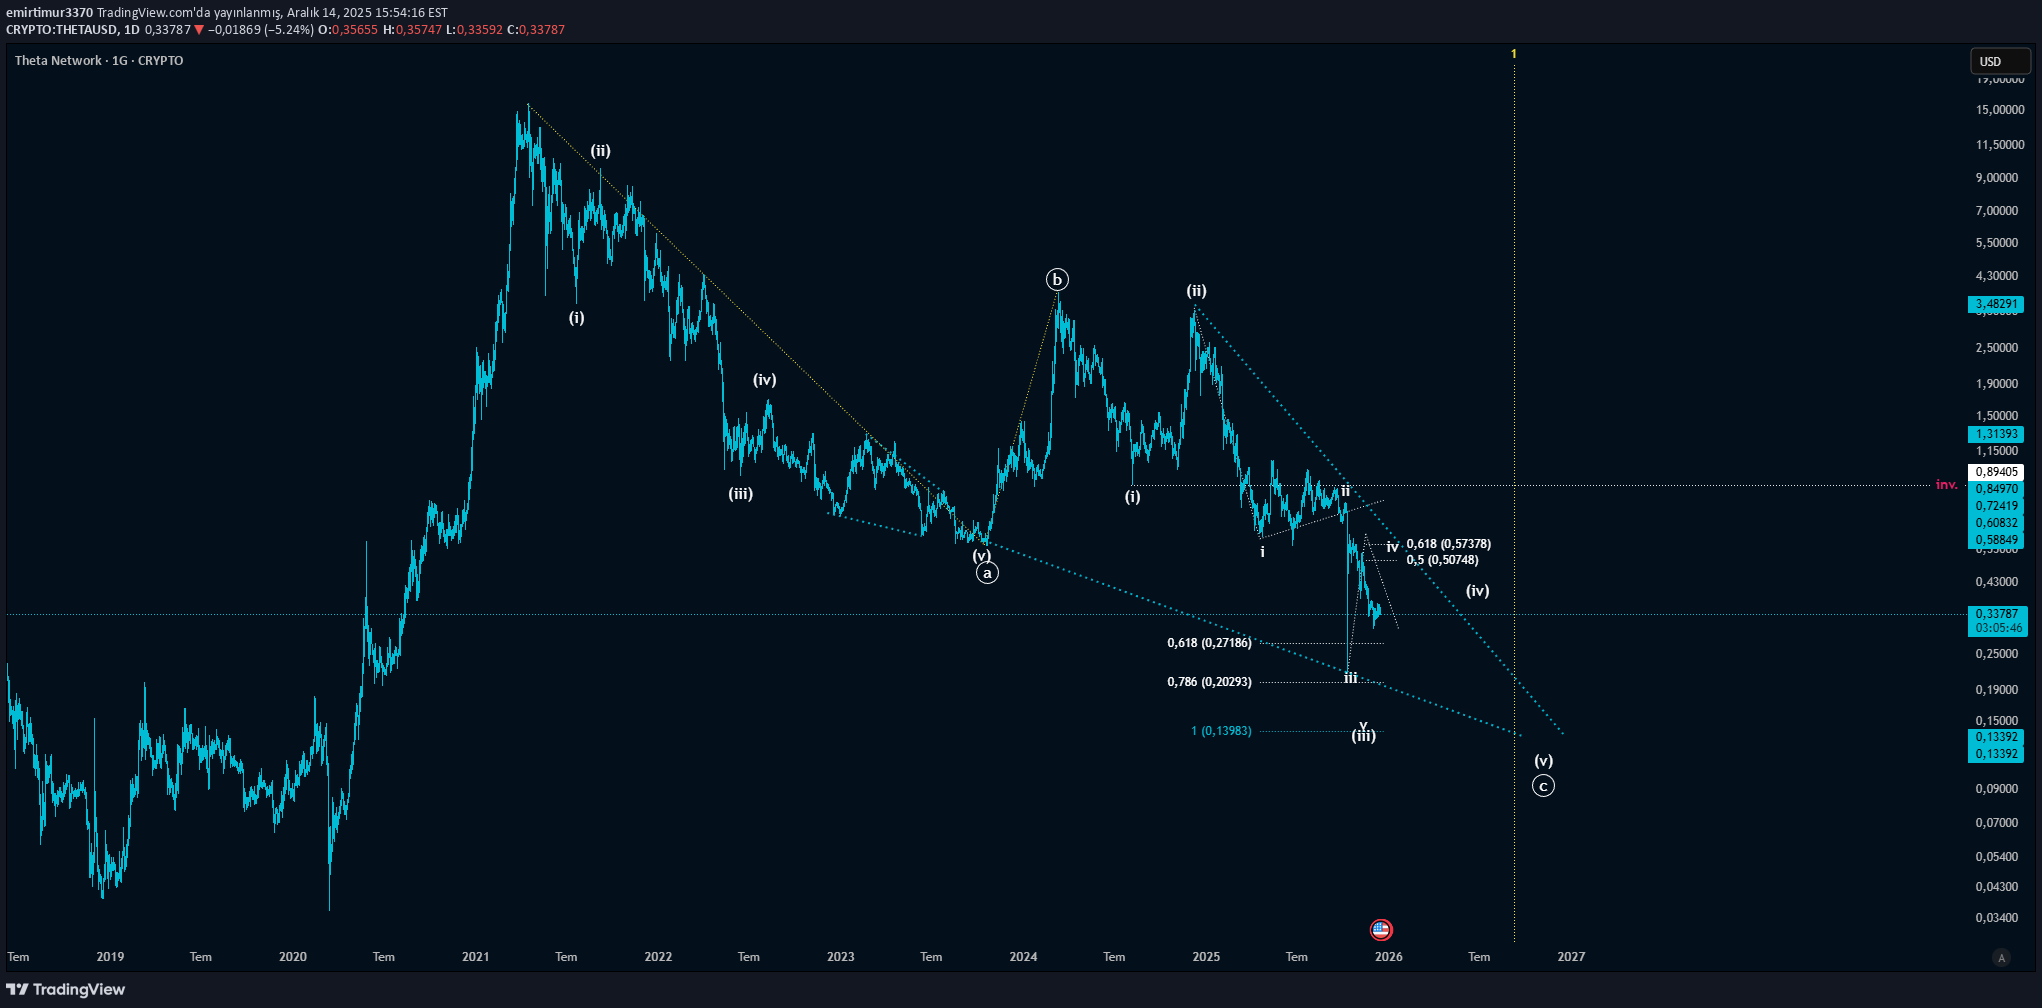
This is my road map on THETAUSD, hopefully I will update it from time to time. YTD. Good luck.

X01X00
پیشبینی بلندمدت تتا (THETA) در برابر تتر (USDT): استراتژی معاملاتی دقیق با شکست ساختار بازار
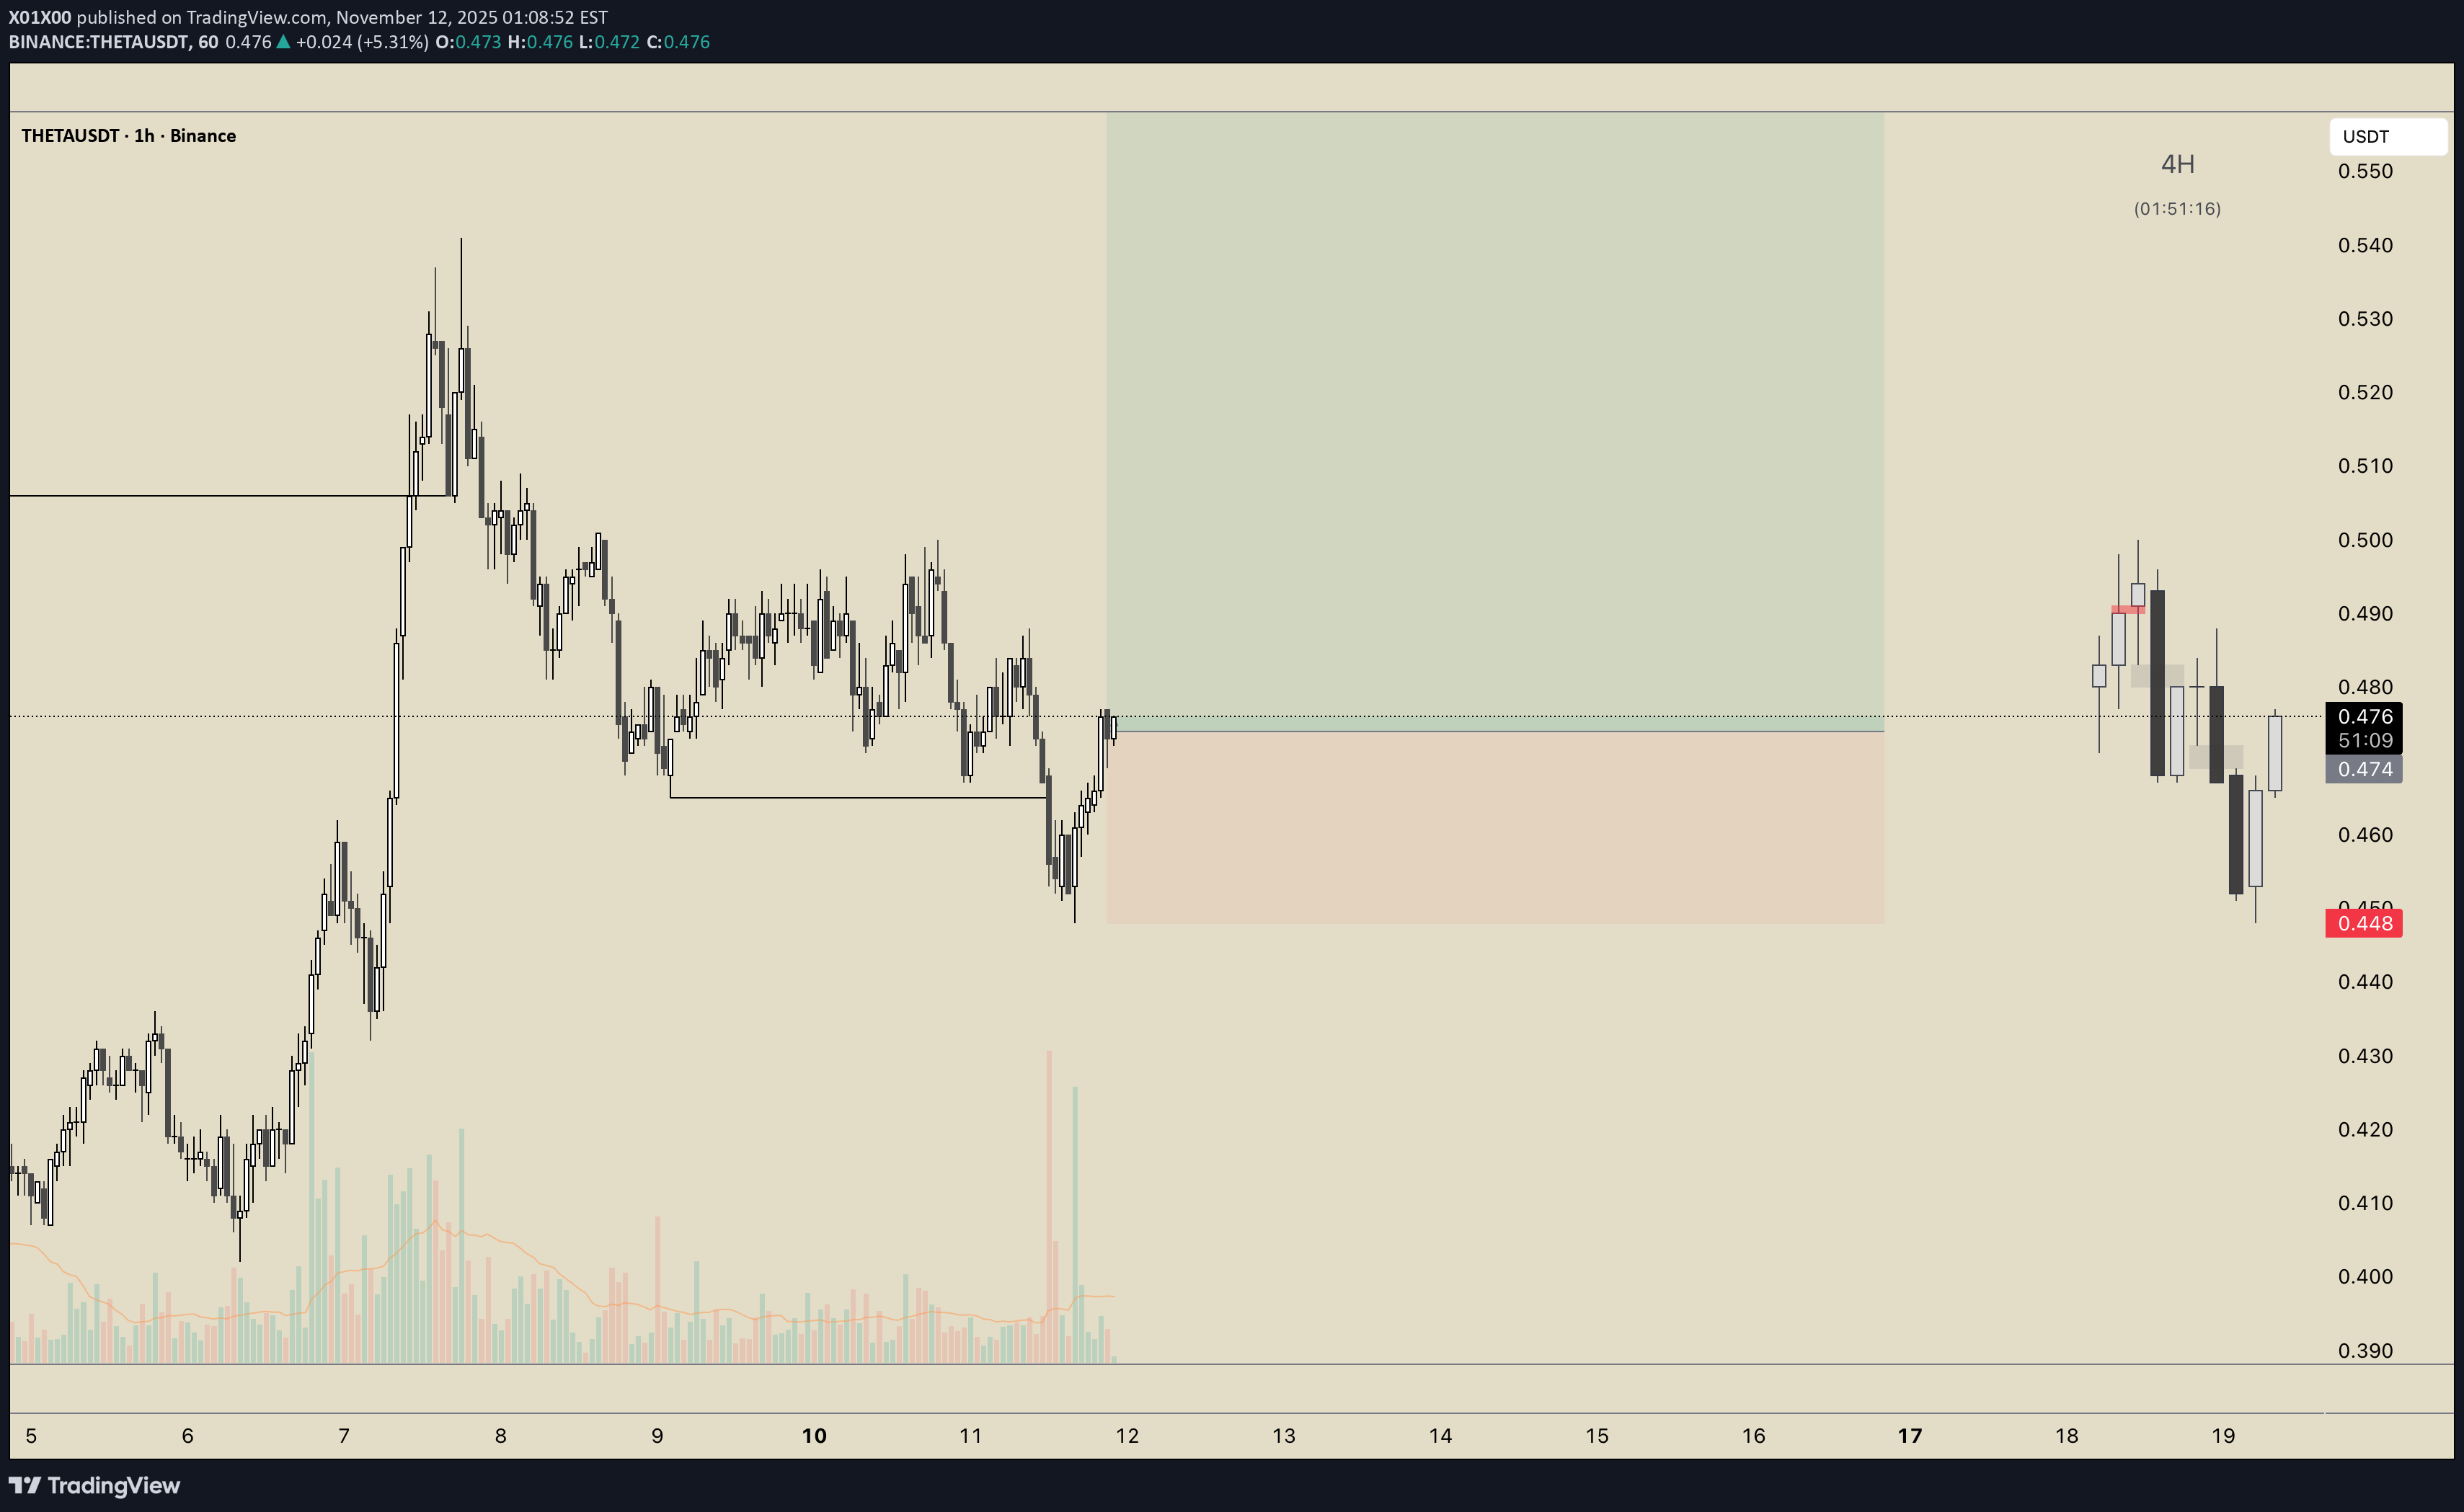
Daily shift + IFVG. Entry on 1H correction + range + sweep liq + with 15m break.

تحلیل و پیشبینی قیمت ارز دیجیتال تتا: فرصت خرید در کف تاریخی؟ 📈
The current price is around $0.49. After peaking at $126,000, Bitcoin is now in the $102,000 range and is in a consolidation phase, so the possibility of alts...

High_Altitude_Investing
تحلیل بلندمدت تتا: آیا این ارز دیجیتال مسیر آمازون را تکرار میکند؟
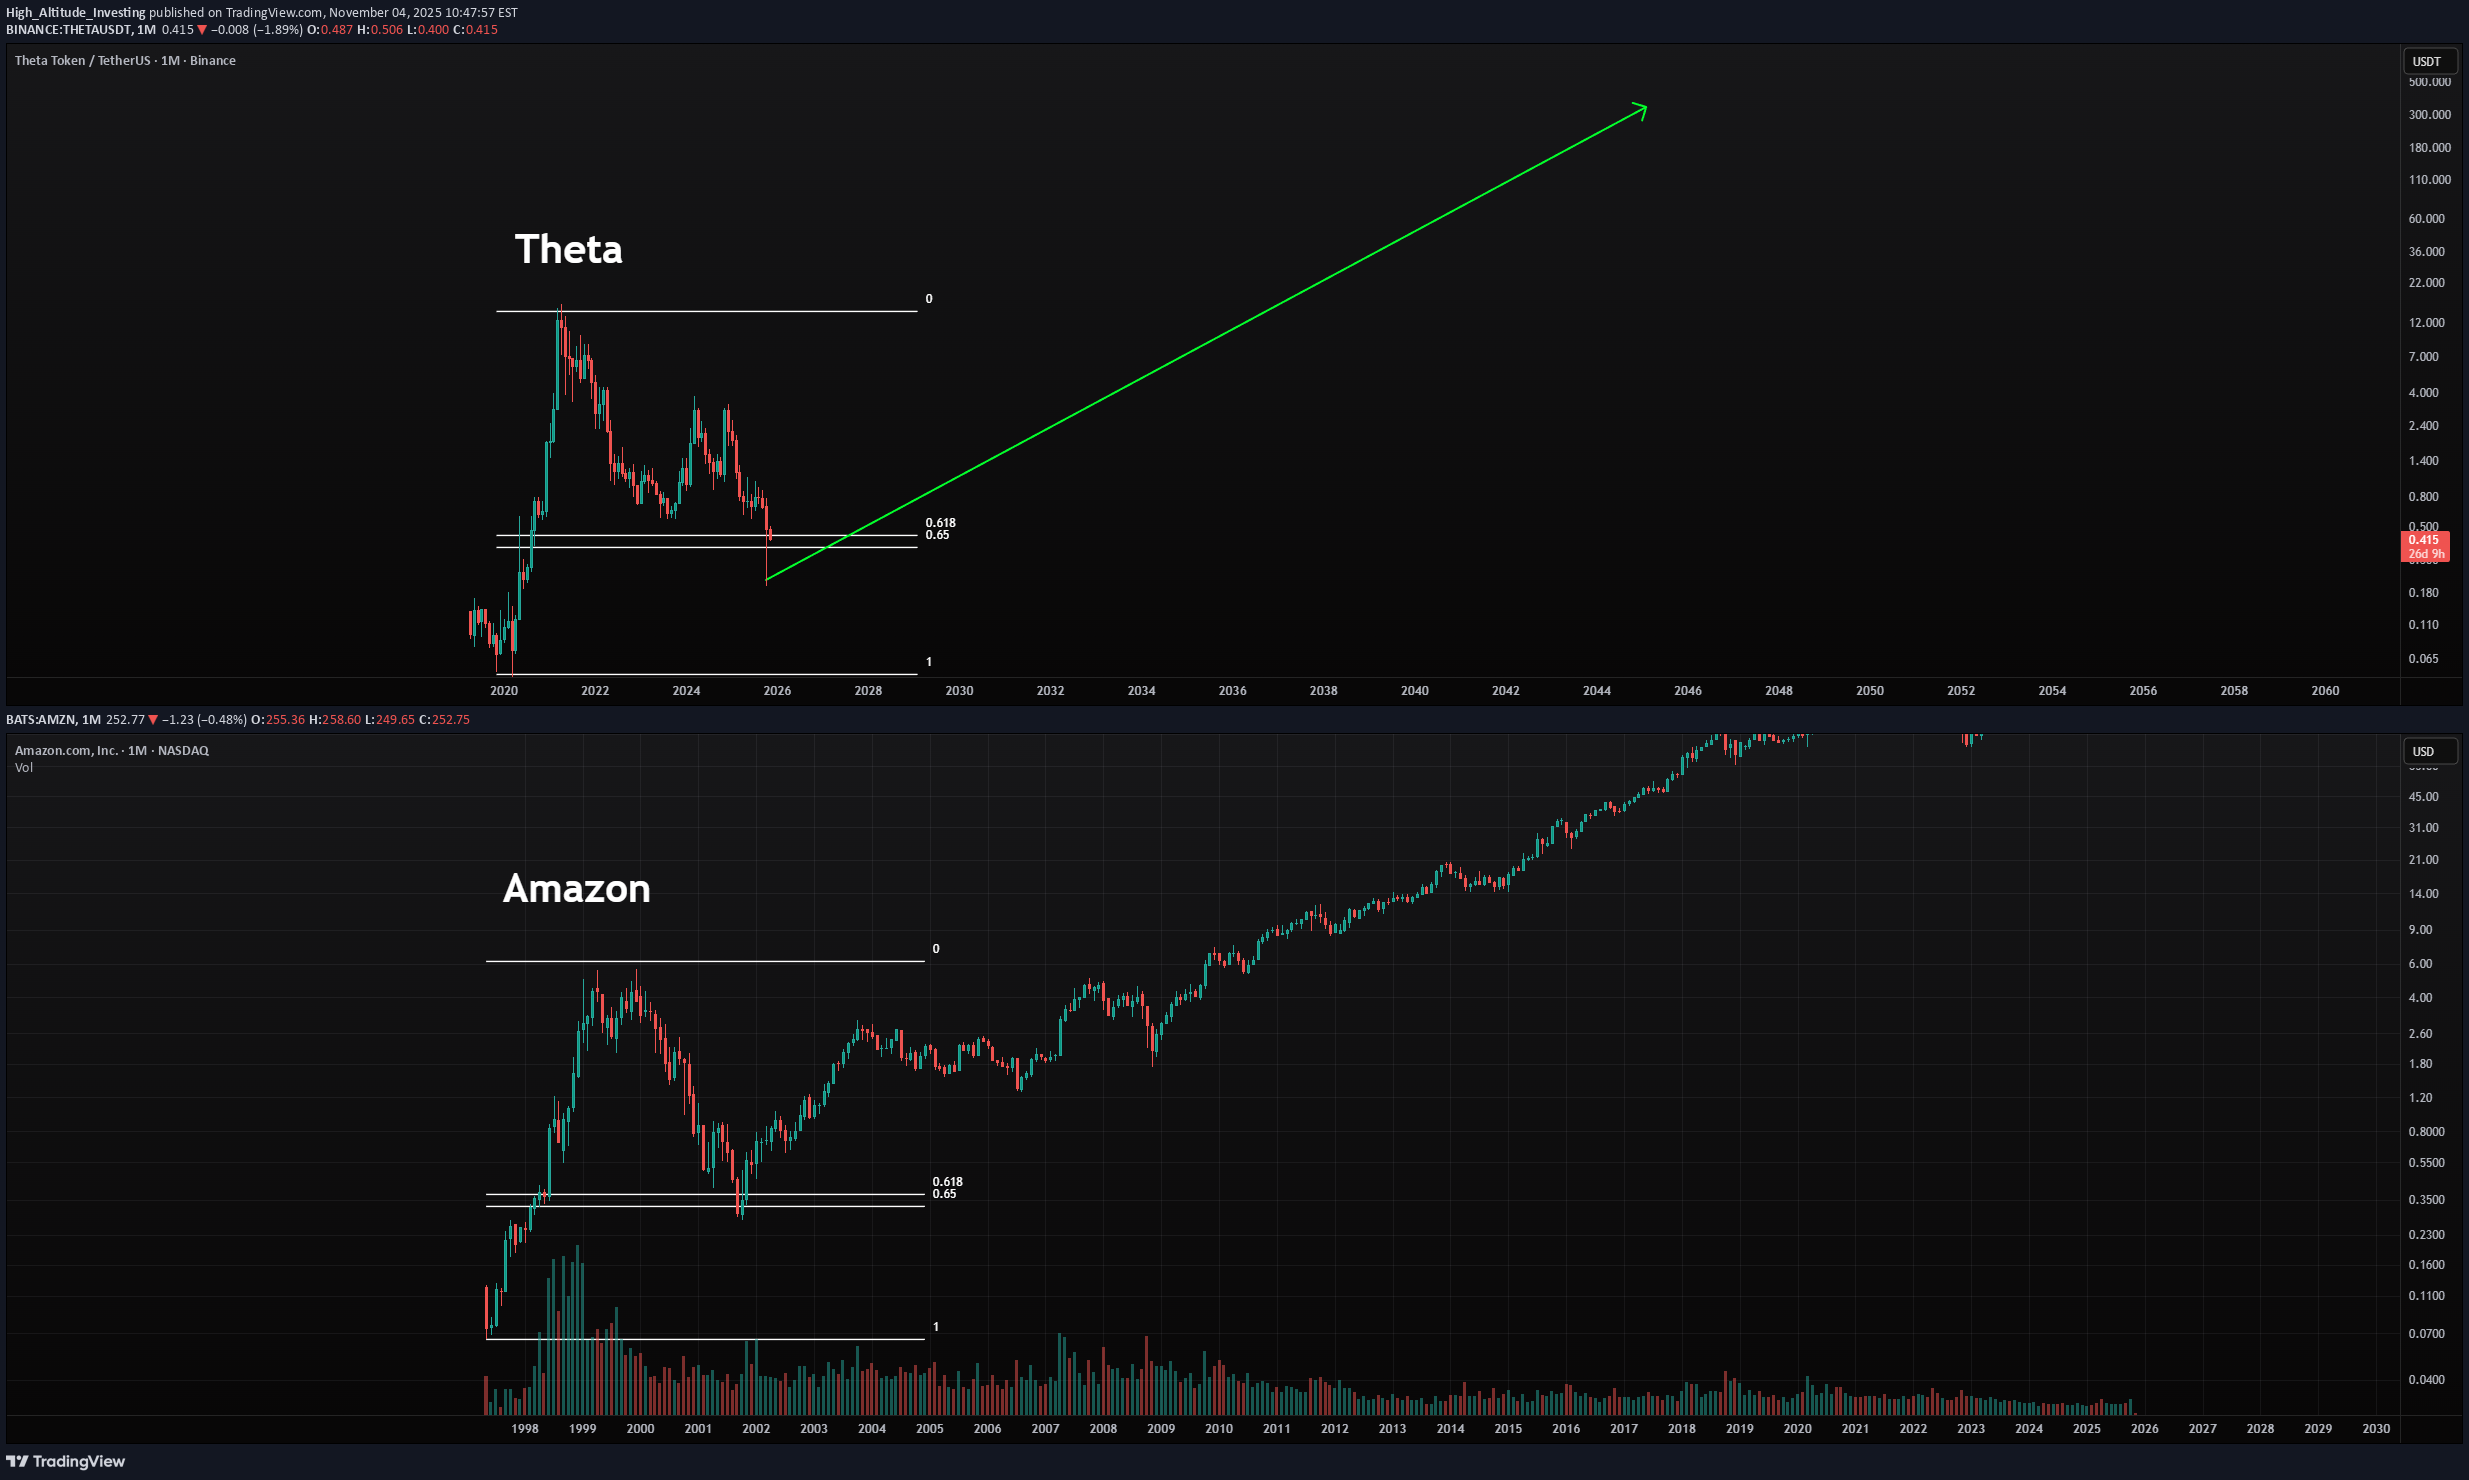
Today, I take a look at a long-term analysis of Theta, comparing it to Amazon. I believe Theta will perform very well in the big picture. I see it following a major upward trend similar to Amazon’s. However, it could happen much faster than shown on this chart—be ready for big things in this market. As always, stay profitable. – Dalin Anderson

شکست حمایت حیاتی: شمعها در دو مسیر، کدام سمت بازار را نشان میدهند؟
In the bullish phase, if it breaks the leading support

BigWhale_Trader
تحلیل کامل و سرنوشتساز تتا (THETA): آیا این ارز به زودی سقف ۱۶ دلاری را میبیند یا سقوط میکند؟

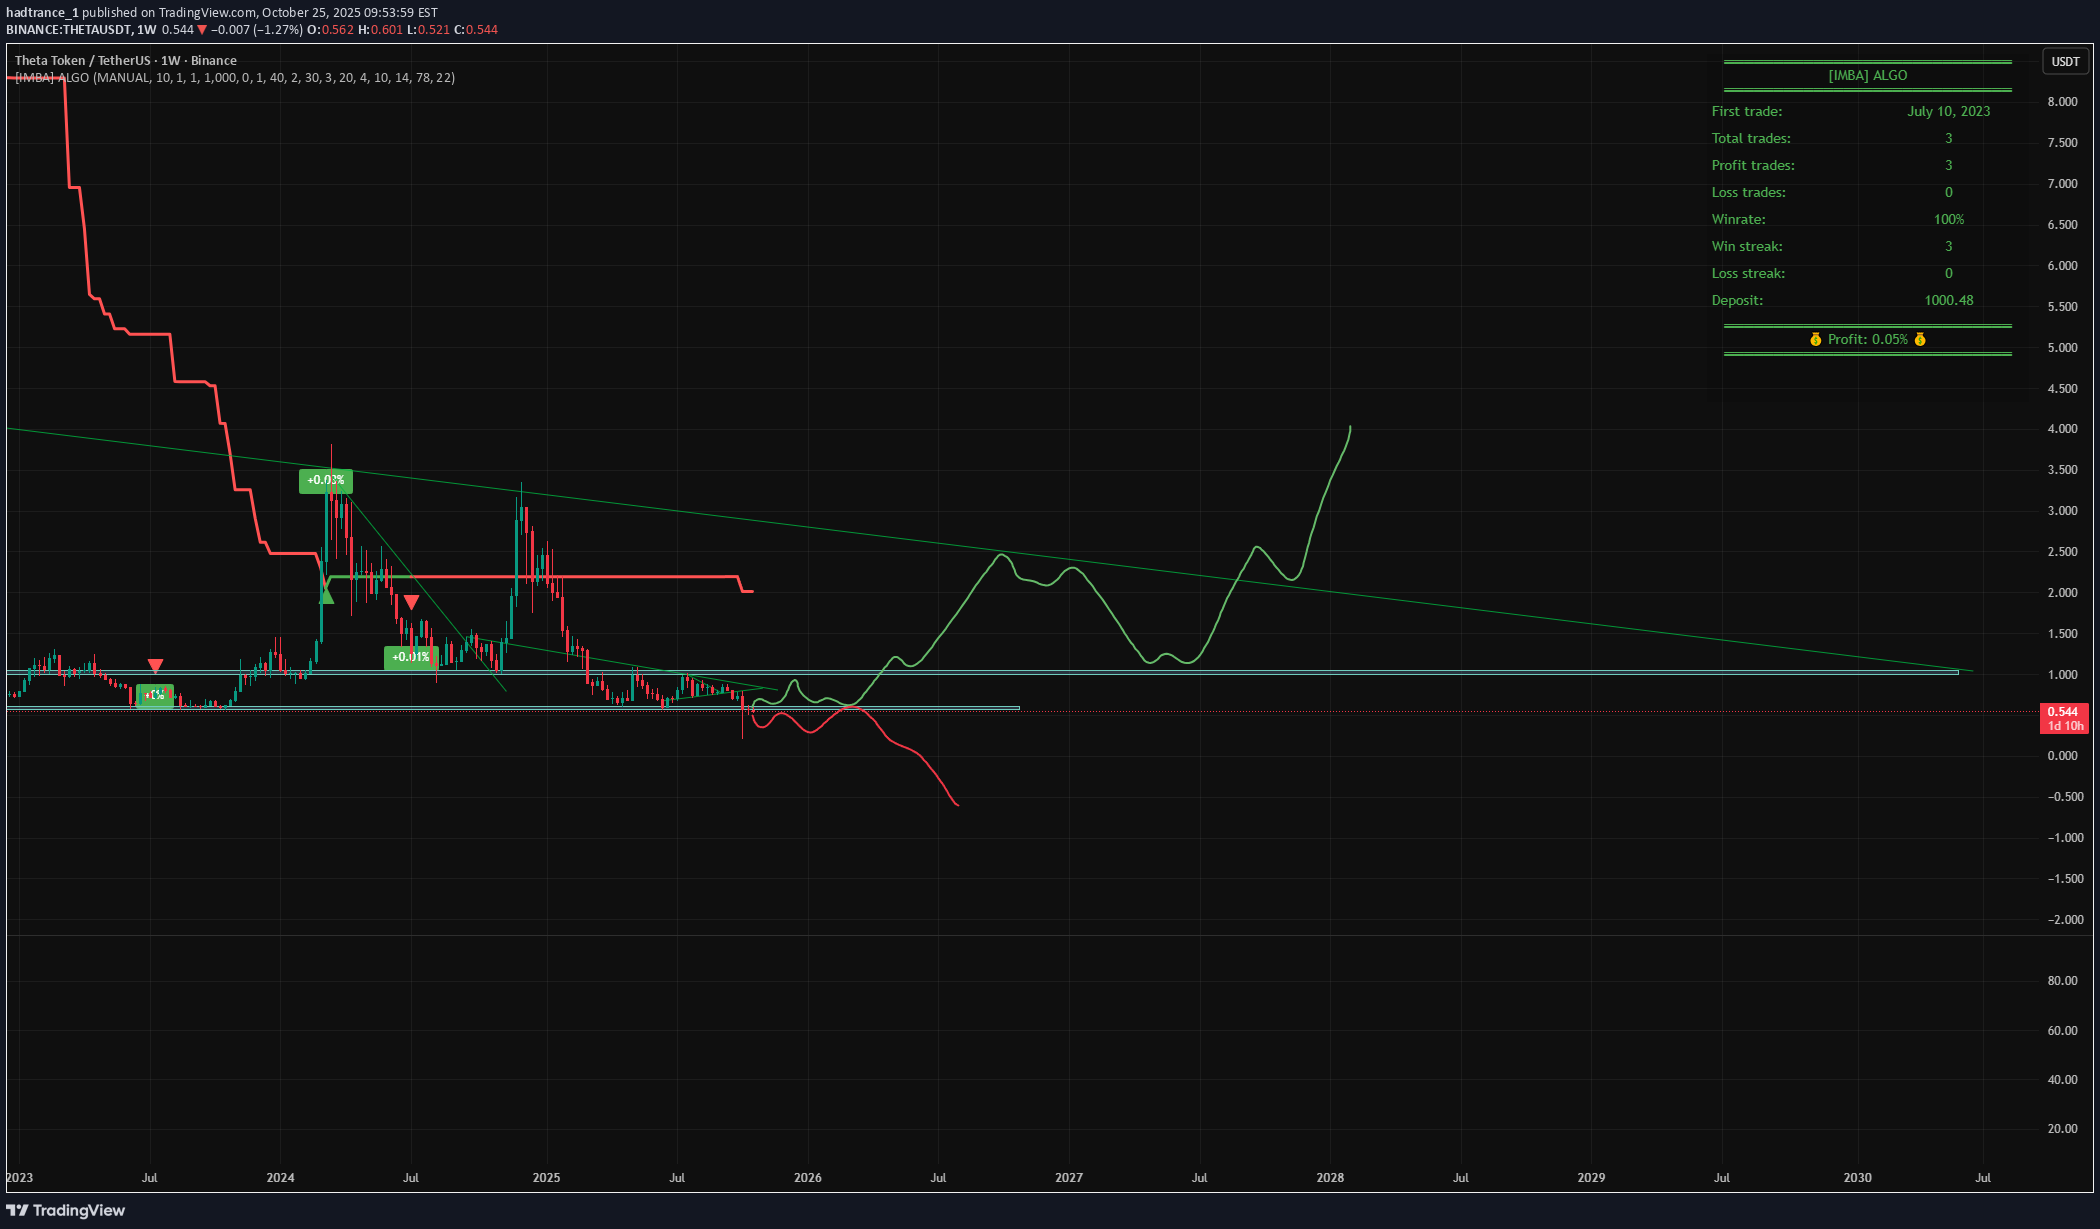
Detailed Analysis 1. Market Phases Parabolic Uptrend (Bull Market): The chart begins on the far left with a massive and rapid price increase. The long green candles indicate intense buying pressure that drove the price from well below $0.20 to a peak of nearly $16.00. Major Downtrend (Bear Market): Following this peak, THETA entered a severe and protracted bear market. The price fell consistently for over a year, marked by a series of lower highs and lower lows. This demonstrates a long period where sellers were in complete control. Consolidation/Accumulation Phase: For a significant portion of the chart (from mid-2022 onwards), the price has been trading in a relatively tight sideways range, primarily between approximately $0.50 and $1.50. This long period of sideways movement after a major downtrend often signifies that the bearish momentum has exhausted. This could be an accumulation phase, where long-term investors are gradually buying, or it could simply be a pause before further downside. 2. Key Price Levels All-Time High (Major Resistance): The peak price, near $16.00, is the ultimate long-term resistance. It would take a monumental shift in market dynamics to retest this level. Major Support Level: The price of approximately $0.425 (indicated by the dashed horizontal line) appears to be a critical long-term support level. While the price has wicked slightly below it, it has not closed below this level on a weekly basis, suggesting this is a strong floor. Consolidation Range Resistance: The price has been rejected multiple times from the $1.20 - $1.50 area. This zone now acts as a significant resistance for any short-to-medium-term bullish rally. Current Price: The current price is $0.743. It is trading in the lower half of its long-term consolidation range, closer to its major support than its range resistance. 3. Technical Indicators Moving Average (The Green Line): During the bull run, the price stayed firmly above it. During the bear market, it acted as a dynamic resistance, with the price consistently staying below it. In the current consolidation phase, the price is frequently crossing it, indicating a lack of a clear trend. Currently, the price is slightly below the moving average, suggesting some minor bearish pressure in the short term. Volume (Not Pictured, but Implied): Typically, a parabolic top is formed on extremely high volume, which then tapers off during the downtrend. The consolidation phase usually sees very low volume, which would pick up significantly on a breakout in either direction. Potential Future Scenarios Bullish Case: A sustained weekly close above the consolidation resistance (around $1.50) would be a strong bullish signal. This could indicate the end of the long-term downtrend and the beginning of a new major uptrend. The first major target after such a break would likely be the $3.00 - $3.50 area, which acted as a previous support/resistance level. Bearish Case: A breakdown and weekly close below the major support level at $0.425 would be a very bearish sign. This would invalidate the idea that a bottom has been formed and could lead to significant further downside, as there would be no clear support levels left from this historical data. Neutral Case (Most Likely in Short-Term): The most probable scenario in the immediate future is a continuation of the sideways price action. THETA could continue to trade between the $0.50 support and the $1.20 resistance until a major market catalyst forces a breakout in one direction. Disclaimer: This technical analysis is for informational purposes only and is not financial advice. The cryptocurrency market is extremely volatile, and past performance is not indicative of future results.

Ali
سیگنال خرید ارز دیجیتال با پتانسیل انفجاری: فرصت میانمدتی از دست ندهید!
There is a strange growth potential with a high -powered currency currency and a mid -time purchase signal issued by checking in your basket. The chart is very attractive to buy because the currency is in principle.
High_Altitude_Investing
Get Ready for a Strong Recovery on Theta in the Near Future!

I believe Theta will see a strong recovery very soon based on this ABC correction, the same pattern BCH experienced. This will lead to a sharp recovery and a strong bullish move in the near future. It could be very profitable and mark the beginning of a massive run for this coin in the bigger picture. Theta is heavily undervalued and ready for big things. As always, stay profitable. – Dalin Anderson

CryptoNuclear
THETA/USDT — Demand Zone Retest: Strong Rebound or Breakdown?

📌 Overview THETA is currently trading at a critical decision point, sitting right inside the multi-year demand zone of $0.50–$0.75, with the price hovering around $0.694. This area has acted as a strong base since 2021, and the next move will determine whether THETA is gearing up for a major rebound or facing another leg down in its prolonged bearish trend. --- 🔹 Structure & Pattern Analysis Macro Trend: Since hitting the all-time high of $15.88 in 2021, THETA has consistently formed lower highs, showing a dominant bearish structure. Key Demand Zone: The $0.50–$0.75 range has acted as a long-term floor for more than 3 years. Chart Pattern: The structure resembles a descending triangle (flat support with lower highs), a pattern that usually favors breakdowns — though invalidation remains possible with a confirmed breakout to the upside. Accumulation Hints: Decreasing sell volume during each retest of the demand zone suggests seller exhaustion and potential long-term accumulation. --- 🔹 Bullish Scenario 1. Strong Rebound From Demand Zone If THETA holds above $0.50–$0.75 and prints a strong bullish weekly candle (hammer or engulfing), it may signal accumulation strength. 2. First Confirmation: A weekly close above $1.03 (immediate resistance) → signals that buyers are regaining control. 3. Upside Targets: Target 1: $1.66 Target 2: $3.05 Target 3: $4.22 Breaking higher could extend toward $8.15 – $12.74, and possibly retest the ATH at $15.88 in the long run. 4. Momentum Validation: RSI reclaiming >50 + MACD bullish cross would strengthen the bullish case. --- 🔹 Bearish Scenario 1. Confirmed Breakdown Below $0.50 A weekly close below $0.50 would confirm a bearish continuation and invalidate the demand zone. 2. Failed Retest: If the price retests $0.50–$0.55 and fails to reclaim, it could trigger accelerated selling pressure. 3. Downside Targets: Target 1: $0.33 Target 2: $0.24 (multi-year bottom) 4. Risk: A breakdown below $0.50 may cause capitulation, with long-term holders potentially exiting positions. --- 🔹 Trading Strategy & Risk Management Long-Term Investors (DCA): Gradual accumulation within $0.50–$0.75, with a conservative stop loss below $0.45. Swing Traders: Enter long after a confirmed breakout and weekly close above $1.03, targeting $1.66+. Bearish Traders: Short setups become valid if weekly closes below $0.50, with targets toward $0.33–$0.24. Risk Control: Always apply stop losses. Maintain a minimum risk-to-reward ratio of 1:2 before entering. --- 🔹 Conclusion THETA is standing at a make-or-break zone. As long as it holds above the $0.50–$0.75 demand zone, the potential for a major rebound remains alive, especially if $1.03 is broken to the upside. However, a weekly close below $0.50 would confirm a bearish continuation, opening the path to new lows. The upcoming weekly closes will be decisive — the next candles could shape THETA’s direction not just for months, but potentially for years. --- #THETA #Crypto #Altcoin #TechnicalAnalysis #PriceAction #SupportResistance #Breakout #Breakdown #CryptoTrading

KEEP CALM AND CARRY ON
Always lookout for liquidity sweep Market structure Always look for a clean unmitigated zone key level after liquidity sweep
Disclaimer
Any content and materials included in Sahmeto's website and official communication channels are a compilation of personal opinions and analyses and are not binding. They do not constitute any recommendation for buying, selling, entering or exiting the stock market and cryptocurrency market. Also, all news and analyses included in the website and channels are merely republished information from official and unofficial domestic and foreign sources, and it is obvious that users of the said content are responsible for following up and ensuring the authenticity and accuracy of the materials. Therefore, while disclaiming responsibility, it is declared that the responsibility for any decision-making, action, and potential profit and loss in the capital market and cryptocurrency market lies with the trader.