
PYR
Vulcan Forged PYR
| تریدر | نوع سیگنال | حد سود/ضرر | زمان انتشار | مشاهده پیام |
|---|---|---|---|---|
 ibrahimreda4Rank: 1819 | خرید | حد سود: تعیین نشده حد ضرر: تعیین نشده | 12/25/2025 | |
 Alpha-GoldFXRank: 32441 | خرید | حد سود: تعیین نشده حد ضرر: تعیین نشده | 12/16/2025 |
Price Chart of Vulcan Forged PYR
سود 3 Months :
سیگنالهای Vulcan Forged PYR
Filter
Sort messages by
Trader Type
Time Frame
ibrahimreda4
pyrusdt

i think pyr finished the bearish wave and will continue upwards

CryptoAnalystSignal
#PYR/USDT T — Critical Zone: Accumulation for Rebound or Breakd
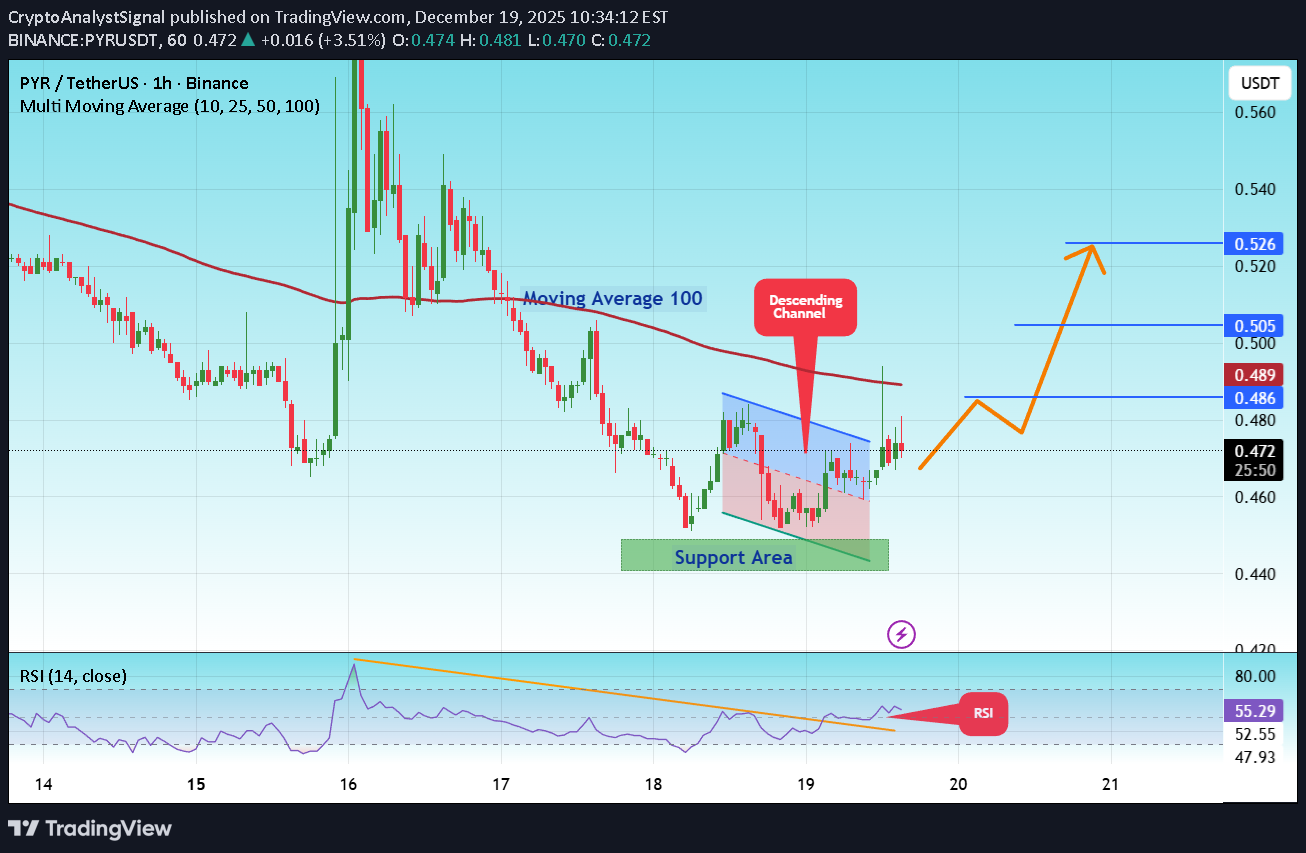
#PYR The price is moving in a descending channel on the 1-hour timeframe. It has reached the lower boundary and is heading towards a breakout, with a retest of the upper boundary expected. We are seeing a bearish trend in the Relative Strength Index (RSI), which has reached near the lower boundary, and an upward bounce is expected. There is a key support zone in green at 0.443, and the price has bounced from this level several times. Another bounce is expected. We are seeing a trend towards stabilizing above the 100-period moving average, which we are approaching, supporting the upward trend. Entry Price: 0.471 First Target: 0.486 Second Target: 0.505 Third Target: 0.526 Remember a simple principle: Money Management. Place your stop-loss order below the green support zone. For any questions, please leave a comment. Thank you.#PYR First Target: 0.486 Reached Second Target: 0.505 Reached#PYR First Target: 0.486 Reached Second Target: 0.505 Reached Third Target: 0.526 Reached
Alpha-GoldFX
PYRUSDT Forming Falling Wedge
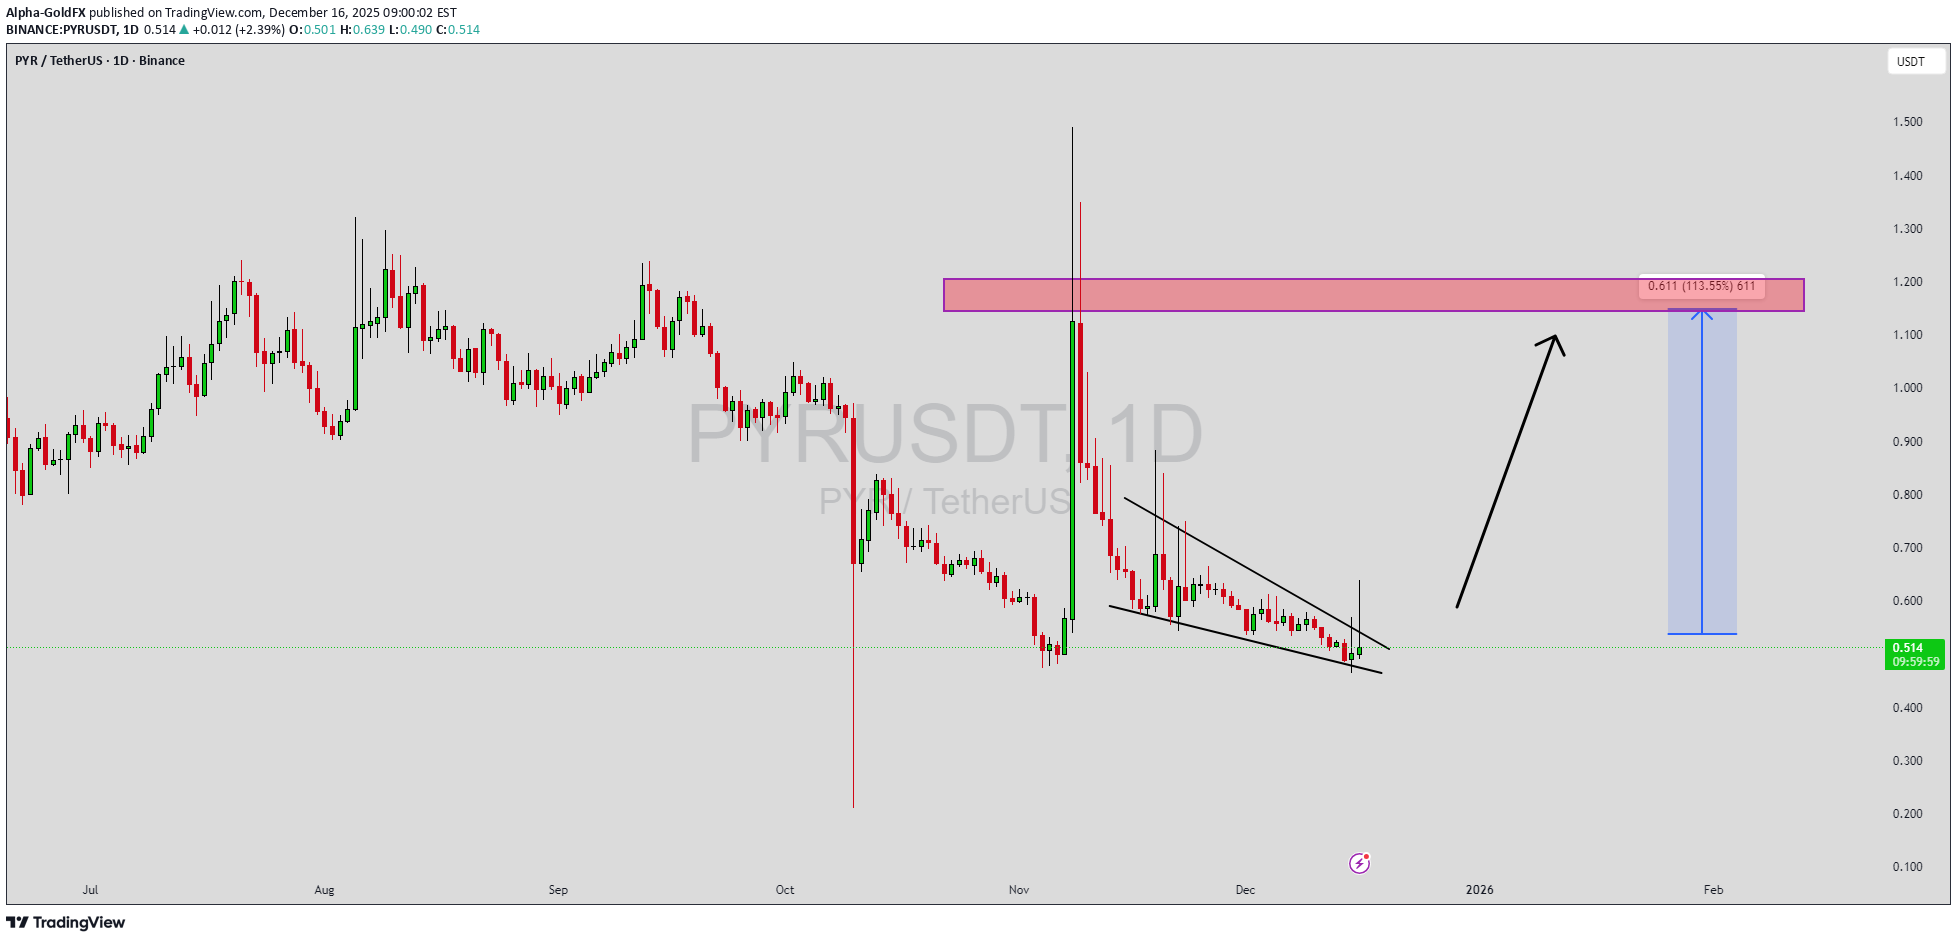
PYRUSDT is forming a clear falling wedge pattern, a classic bullish reversal signal that often indicates an upcoming breakout. The price has been consolidating within a narrowing range, suggesting that selling pressure is weakening while buyers are beginning to regain control. With consistent volume confirming accumulation at lower levels, the setup hints at a potential bullish breakout soon. The projected move could lead to an impressive gain of around 90% to 100% once the price breaks above the wedge resistance. This falling wedge pattern is typically seen at the end of downtrends or corrective phases, and it represents a potential shift in market sentiment from bearish to bullish. Traders closely watching PYRUSDT are noting the strengthening momentum as it nears a breakout zone. The good trading volume adds confidence to this pattern, showing that market participants are positioning early in anticipation of a reversal. Investors’ growing interest in PYRUSDT reflects rising confidence in the project’s long-term fundamentals and current technical strength. If the breakout confirms with sustained volume, this could mark the start of a fresh bullish leg. Traders might find this a valuable setup for medium-term gains, especially as the wedge pattern completes and buying momentum accelerates. ✅ Show your support by hitting the like button and ✅ Leaving a comment below! (What is your opinion about this Coin?) Your feedback and engagement keep me inspired to share more insightful market analysis with you!

Osang

CryptoAnalystSignal
تحلیل تکنیکال PYR/USDT: آیا زمان خرید برای جهش یا سقوط بزرگ فرا رسیده است؟
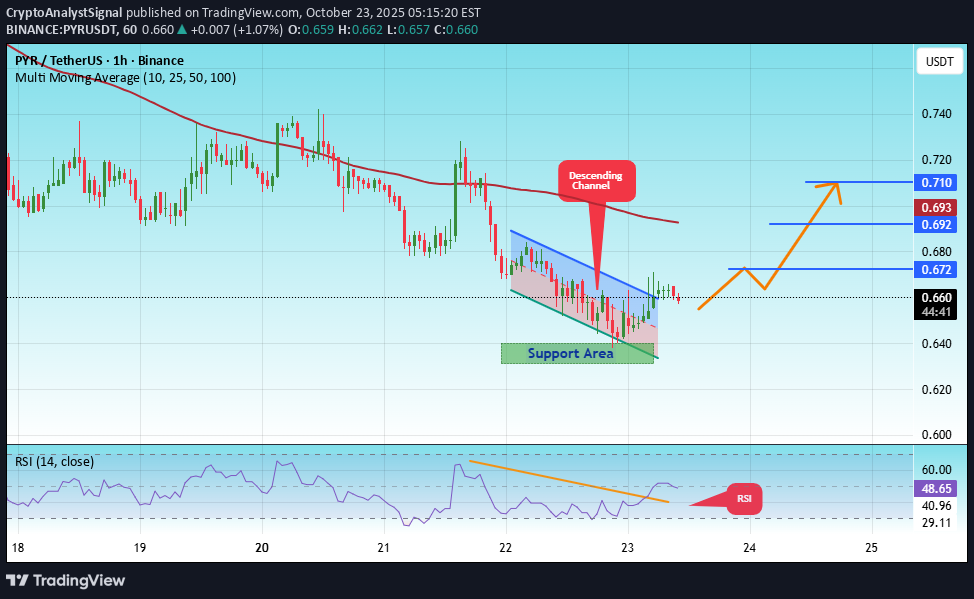
#PYR The price is moving within a descending channel on the 1-hour frame, adhering well to it, and is heading for a strong breakout and retest. We have a bearish trend on the RSI indicator that is about to be broken and retested, which supports the upward breakout. There is a major support area in green at 0.633, representing a strong support point. We are heading for consolidation above the 100 moving average. Entry price: 0.658 First target: 0.672 Second target: 0.692 Third target: 0.710 Don't forget a simple matter: capital management. When you reach the first target, save some money and then change your stop-loss order to an entry order. For inquiries, please leave a comment. Thank you.#PYR First target: 0.672 Reached Second target: 0.692 Reached#PYR First target: 0.672 Reached Second target: 0.692 Reached Third target: 0.710 Reached

CryptoNuclear
PYR/USDT — Critical Zone: Accumulation for Rebound or Breakdown?
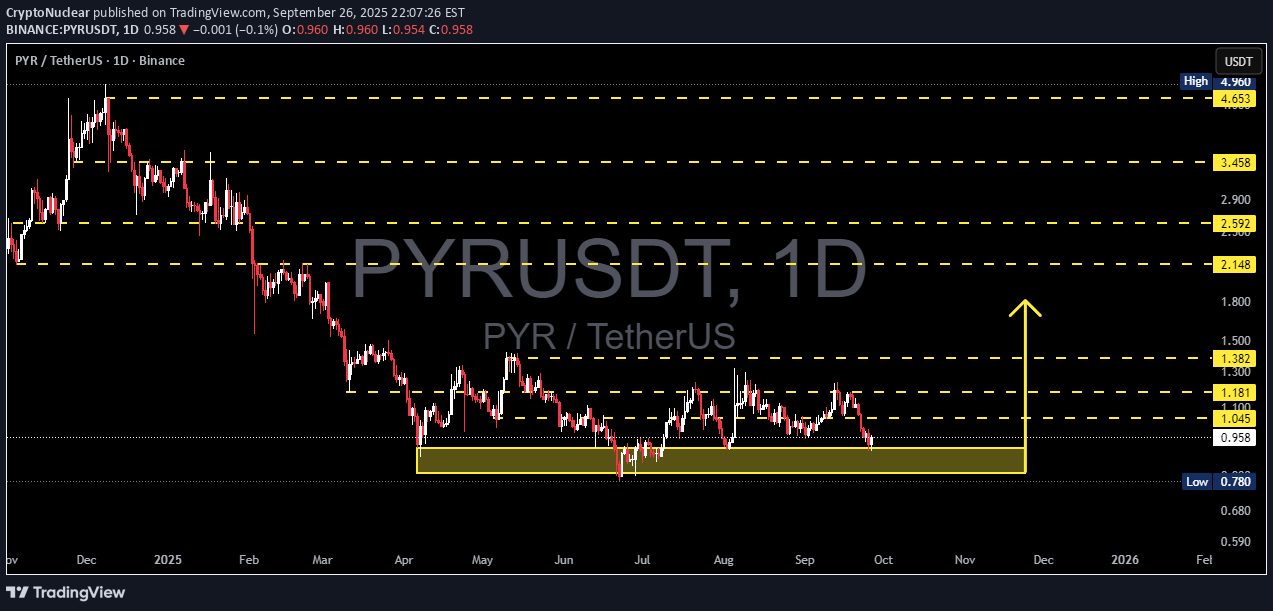
PYR/USDT is now trading at a critical decision zone. After a prolonged downtrend since late 2024, the price has been consolidating inside the demand zone at 0.78 – 0.98 USDT. This area has repeatedly acted as a strong foundation to prevent deeper declines. With multiple retests, the market is approaching a tipping point: will PYR stage a significant rebound or break down into new lows? --- 🔎 Market Structure & Price Pattern Long-Term Trend: Bearish, characterized by sharp declines and a series of lower highs since early 2025. Mid-Term Trend: Sideways / Range-bound, with the lower boundary at 0.78–0.98 and upper boundary near 1.38. Pattern Observed: Potential Double/Triple Bottom formation at major support. If confirmed, this could signal accumulation before a trend reversal. Failure to hold this zone, however, would turn the structure into a distribution breakdown, triggering new selling pressure. --- 📈 Bullish Scenario (Rebound Potential) 1. Price holds above 0.78 – 0.98 with a clear bullish reversal candle (engulfing / hammer / piercing line) on the daily timeframe. 2. Additional confirmation if daily close sustains above 1.045. 3. Step-by-step upside targets: 🎯 T1 = 1.181 🎯 T2 = 1.382 🎯 T3 = 2.148 (major mid-term resistance) 🎯 T4 = 2.592 – 3.458 if momentum extends further. 4. Bullish structure strengthens once a higher low forms after the rebound. --- 📉 Bearish Scenario (Breakdown Potential) 1. Price fails to hold and closes daily candle below 0.78. 2. A retest of the 0.78–0.98 zone as new resistance would confirm the bearish bias. 3. Downside targets: ⚠️ 0.60 (psychological support) ⚠️ 0.45 – 0.40 (deeper historical demand zone) 4. Such a breakdown will likely be accompanied by heavy sell volume, signaling panic selling and loss of key support. --- 📌 Conclusion & Strategy The 0.78–0.98 zone is the golden decision point for PYR. Bullish case: wait for a confirmed breakout above 1.045, with targets at 1.18–1.38. Bearish case: breakdown below 0.78 opens room for a deeper sell-off. Best strategy: stay patient, wait for confirmation, and let price action decide whether this zone becomes an accumulation base or a distribution top. #PYR #PYRUSDT #CryptoAnalysis #Altcoin #SupportResistance #DemandZone #CryptoTrading #TechnicalAnalysis

CryptoWithJames
PYRUSDT UPDATE
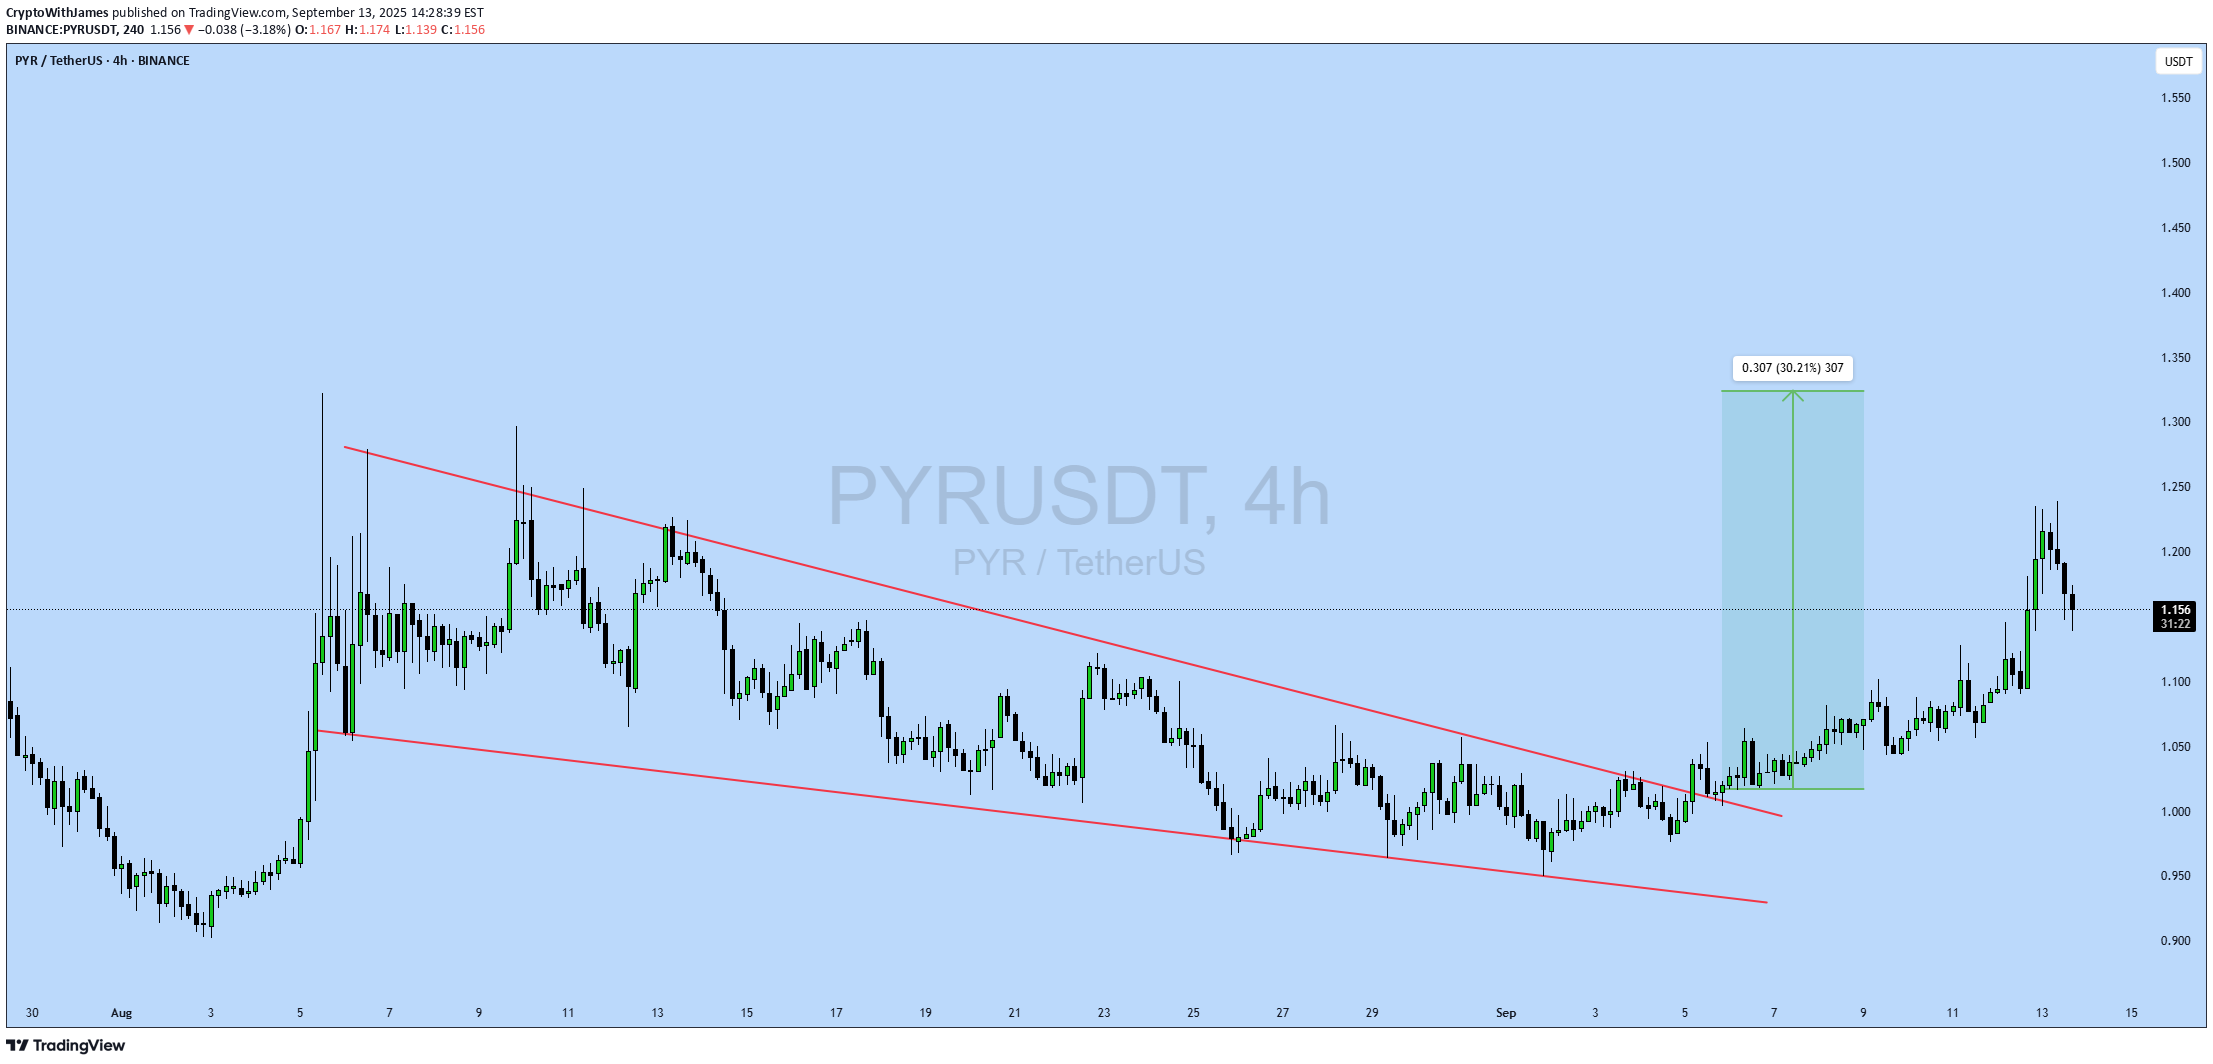
#PYR Update PYR Technical Setup Pattern: Falling Wedge Pattern Current Price: $1.016 Target Price: $1.32 Target % Gain: 30.21% Technical Analysis: PYR has broken out of a falling wedge pattern on the 4H chart, signaling a potential bullish reversal. The breakout above resistance with strong candle structure confirms buying pressure, and continuation momentum can push toward the $1.30 area. Time Frame: 4H Risk Management Tip: Always use proper risk management and set stop-loss below recent support.
CryptoWithJames
PYRUSDT UPDATE
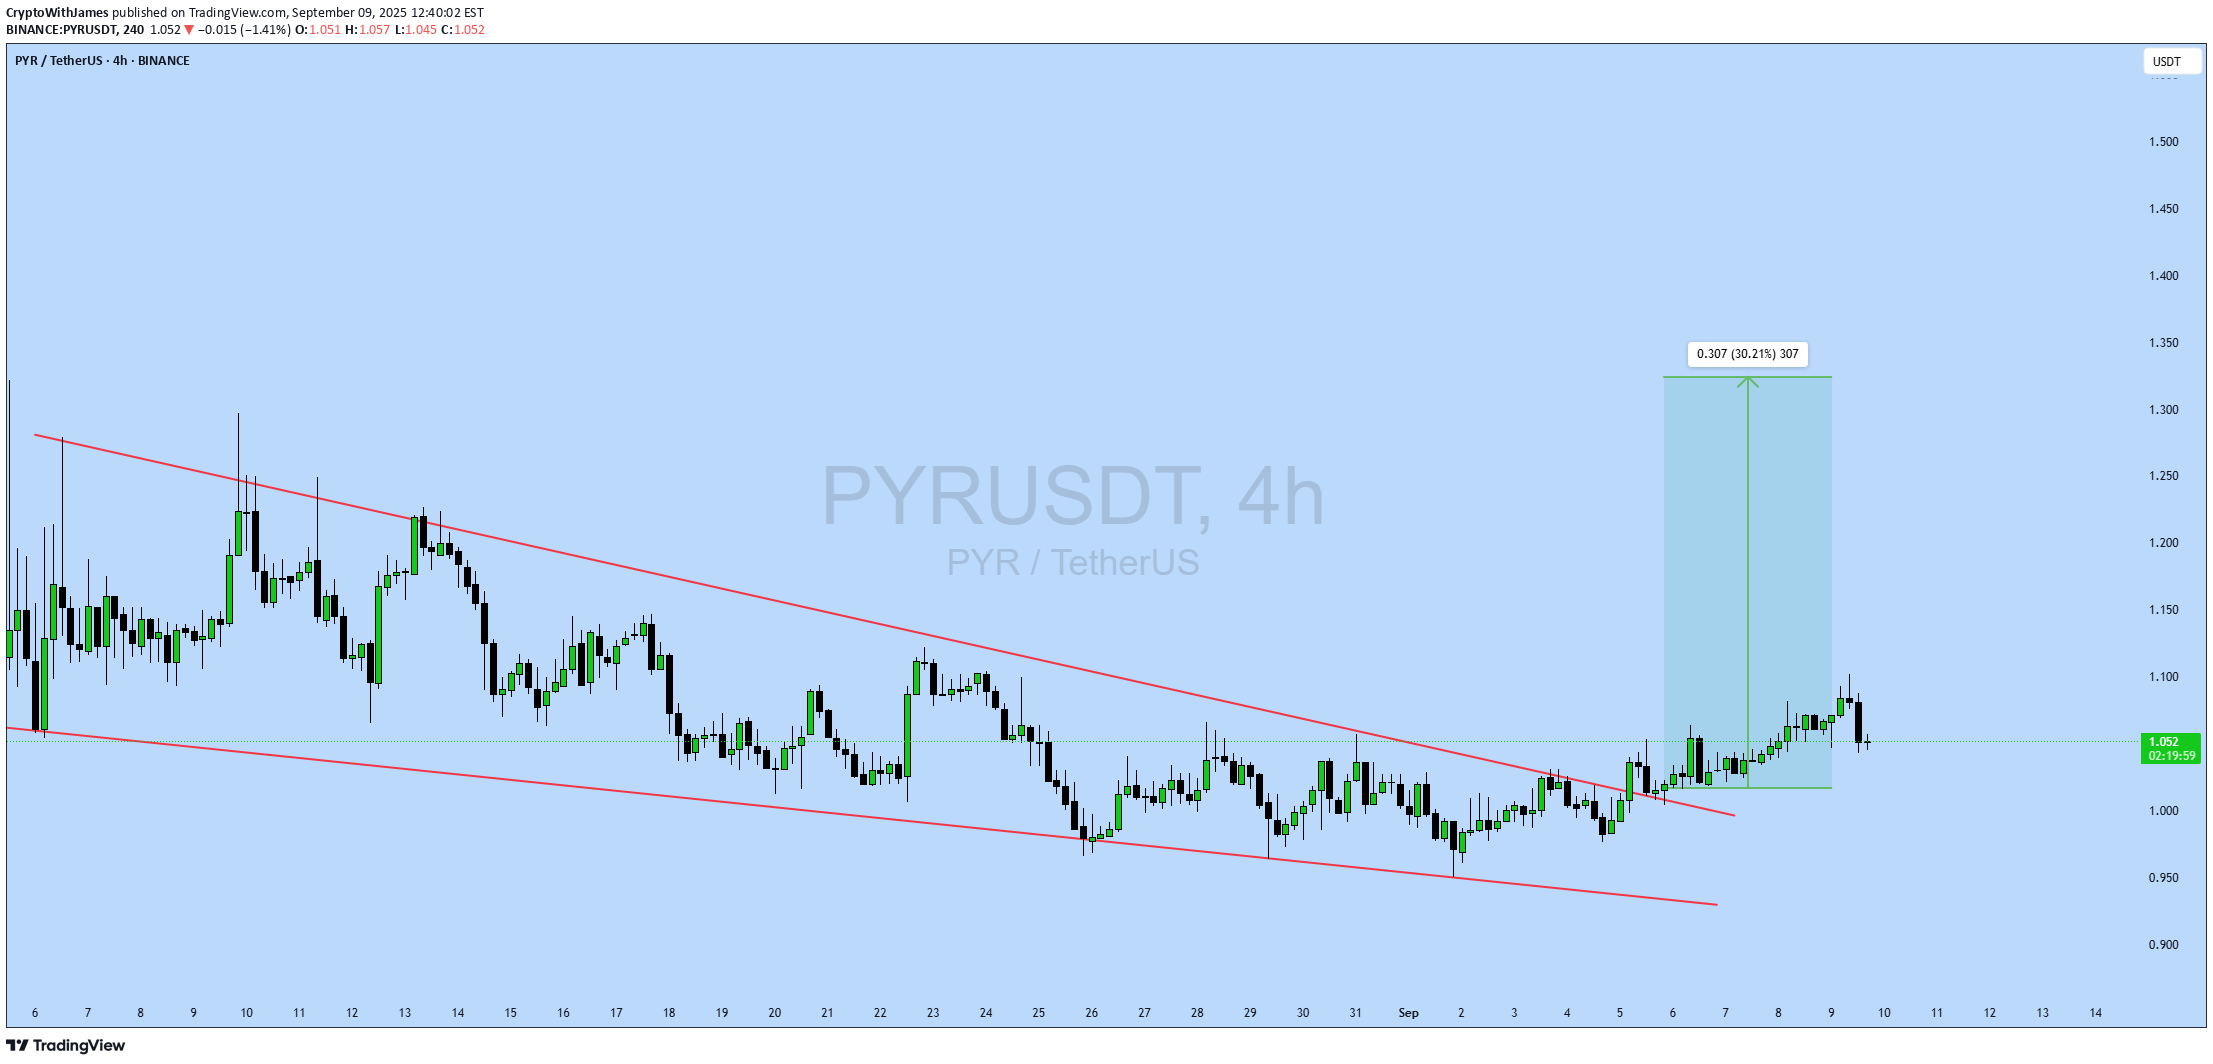
#PYR Update PYR Technical Setup Pattern: Falling Wedge Pattern Current Price: $1.016 Target Price: $1.32 Target % Gain: 30.21% Technical Analysis: PYR has broken out of a falling wedge pattern on the 4H chart, signaling a potential bullish reversal. The breakout above resistance with strong candle structure confirms buying pressure, and continuation momentum can push toward the $1.30 area. Time Frame: 4H Risk Management Tip: Always use proper risk management and set stop-loss below recent support.

Bithereum_io
PYRUSDT 1D
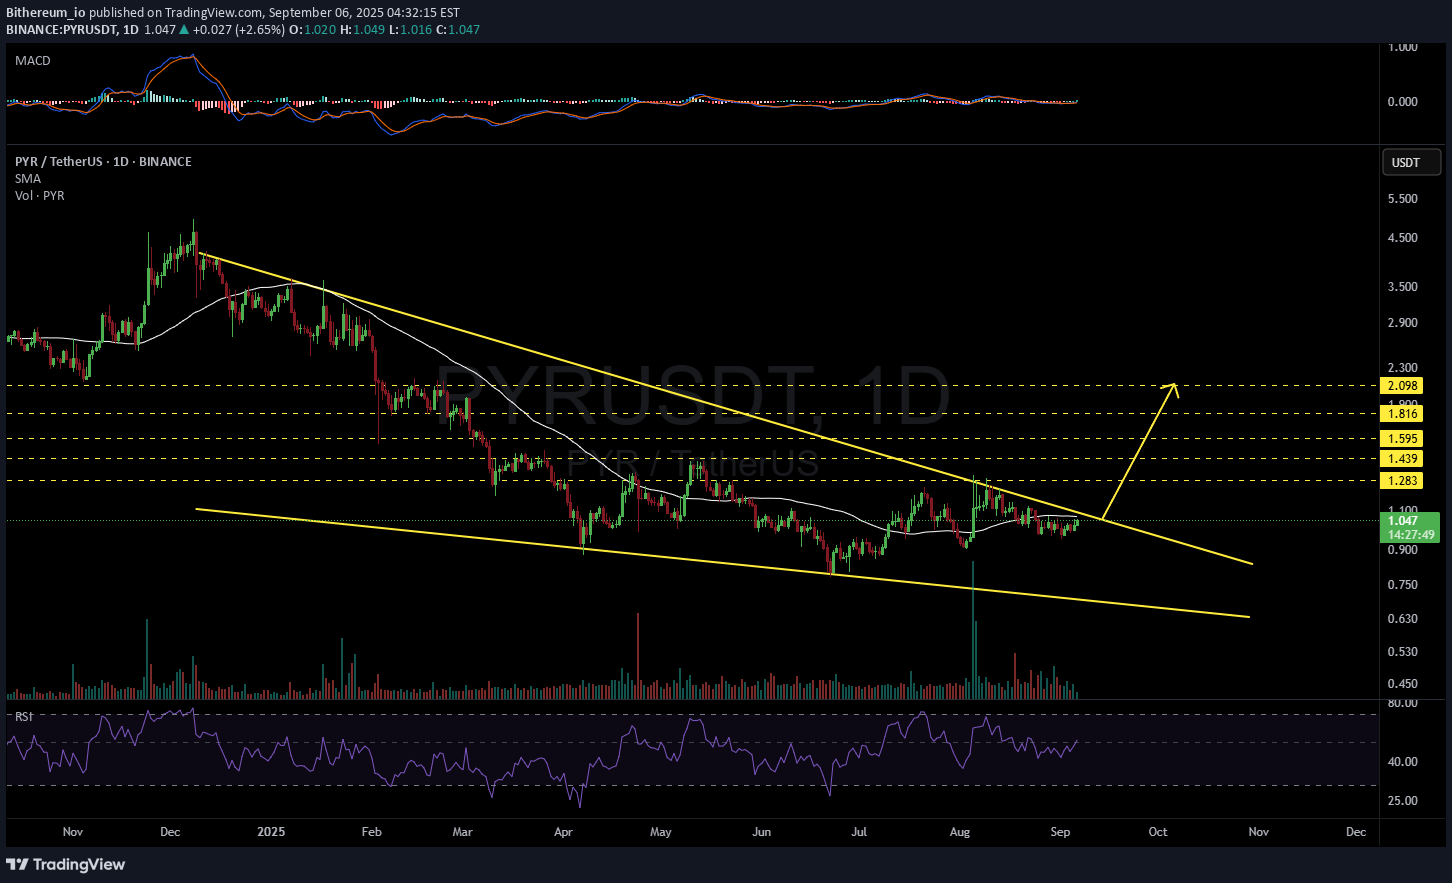
#PYR has formed a falling wedge pattern on the daily chart. If it breaks out above the pattern resistance and the daily SMA50, the targets are: 🎯 $1.283 🎯 $1.439 🎯 $1.595 🎯 $1.816 🎯 $2.098 ⚠️ Always remember to use a tight stop-loss and follow proper risk management.
CryptoWithJames
PYRUSDT UPDATE
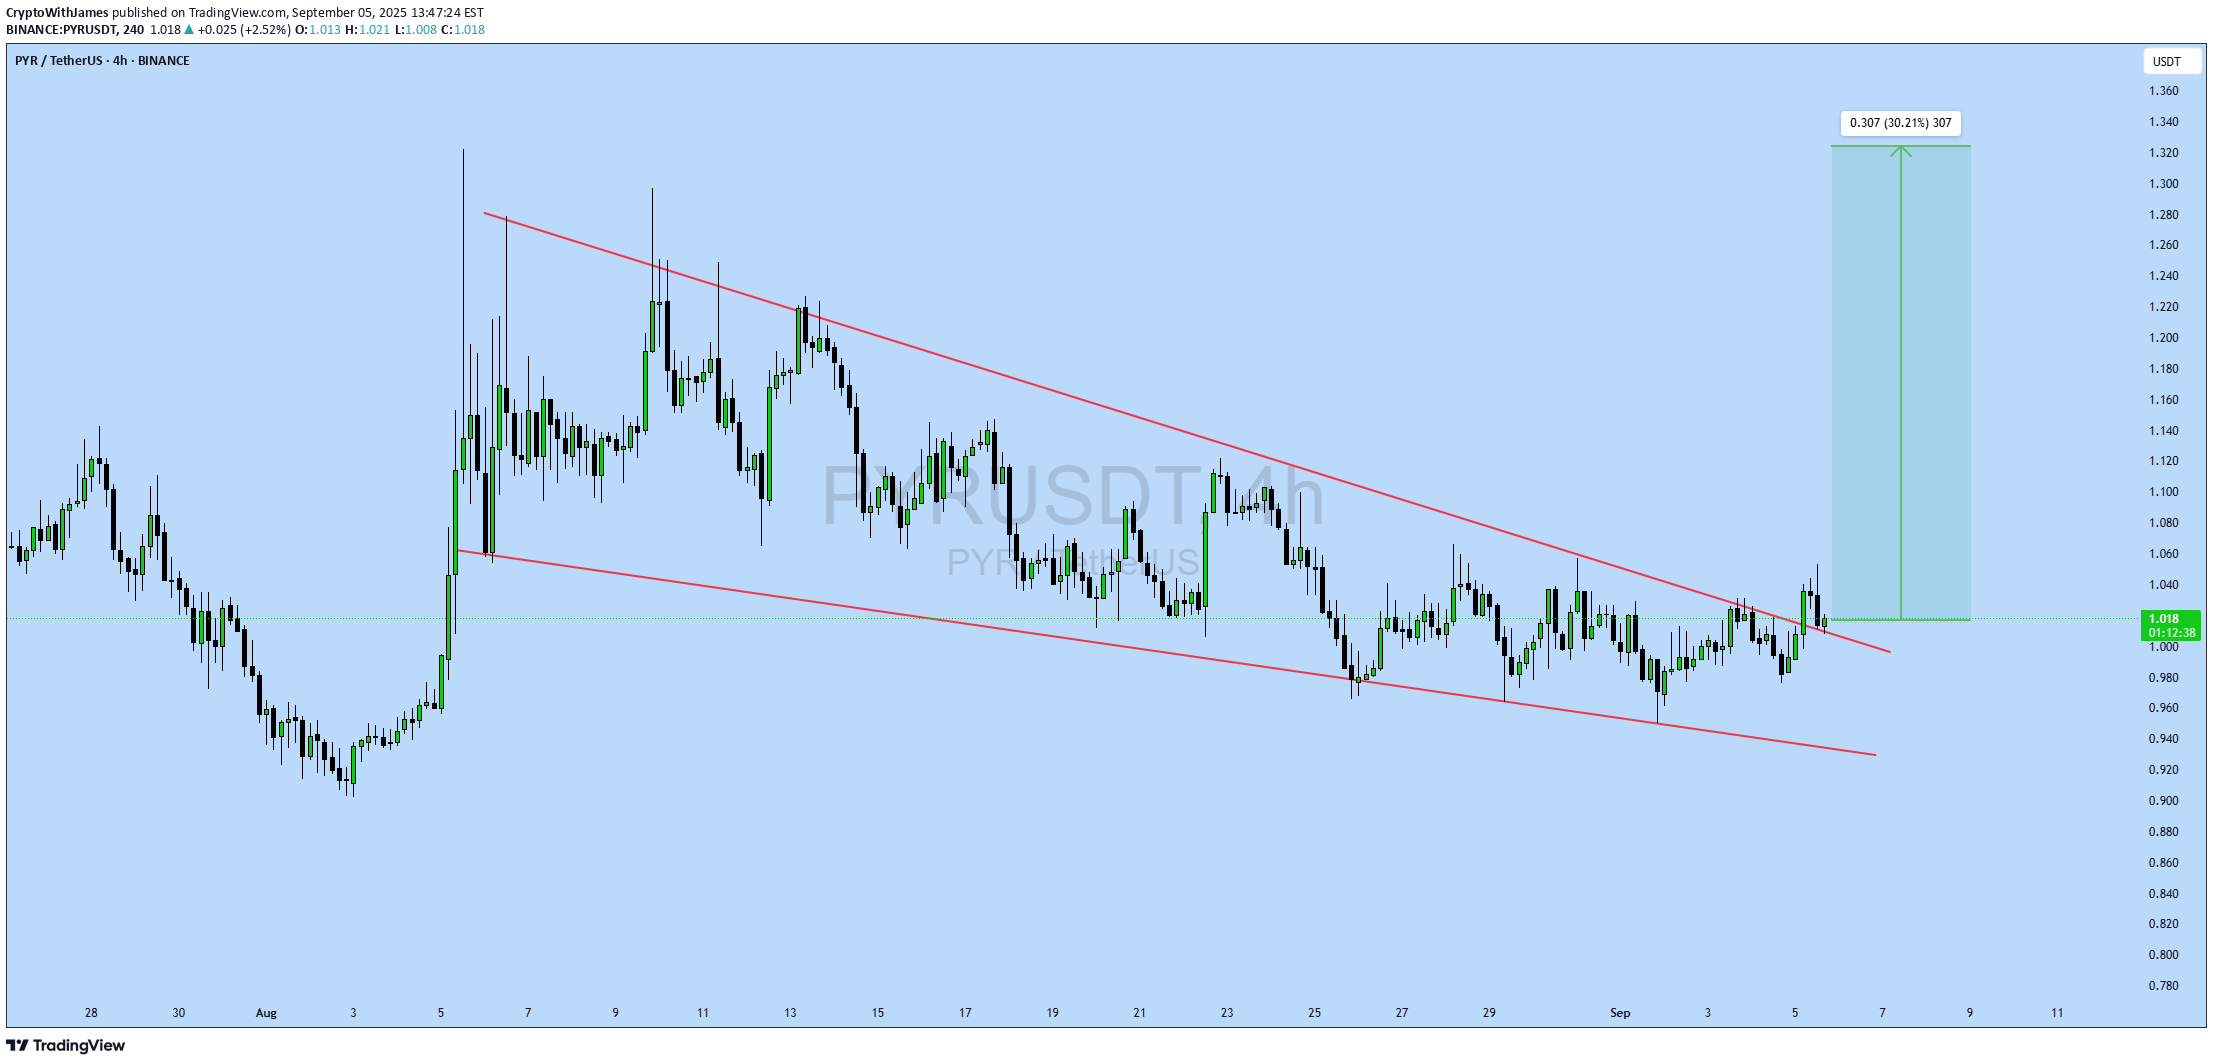
#PYR Update PYR Technical Setup Pattern: Falling Wedge Pattern Current Price: $1.016 Target Price: $1.32 Target % Gain: 30.21% Technical Analysis: PYR has broken out of a falling wedge pattern on the 4H chart, signaling a potential bullish reversal. The breakout above resistance with strong candle structure confirms buying pressure, and continuation momentum can push toward the $1.30 area. Time Frame: 4H Risk Management Tip: Always use proper risk management and set stop-loss below recent support.
Disclaimer
Any content and materials included in Sahmeto's website and official communication channels are a compilation of personal opinions and analyses and are not binding. They do not constitute any recommendation for buying, selling, entering or exiting the stock market and cryptocurrency market. Also, all news and analyses included in the website and channels are merely republished information from official and unofficial domestic and foreign sources, and it is obvious that users of the said content are responsible for following up and ensuring the authenticity and accuracy of the materials. Therefore, while disclaiming responsibility, it is declared that the responsibility for any decision-making, action, and potential profit and loss in the capital market and cryptocurrency market lies with the trader.