
POLYX
Polymesh
| تریدر | نوع سیگنال | حد سود/ضرر | زمان انتشار | مشاهده پیام |
|---|---|---|---|---|
No results found. | ||||
Price Chart of Polymesh
سود 3 Months :
سیگنالهای Polymesh
Filter
Sort messages by
Trader Type
Time Frame

Bithereum_io
پلیاکس در آستانه انفجار؟ تحلیل نمودار روزانه و اهداف قیمتی صعودی POLYX
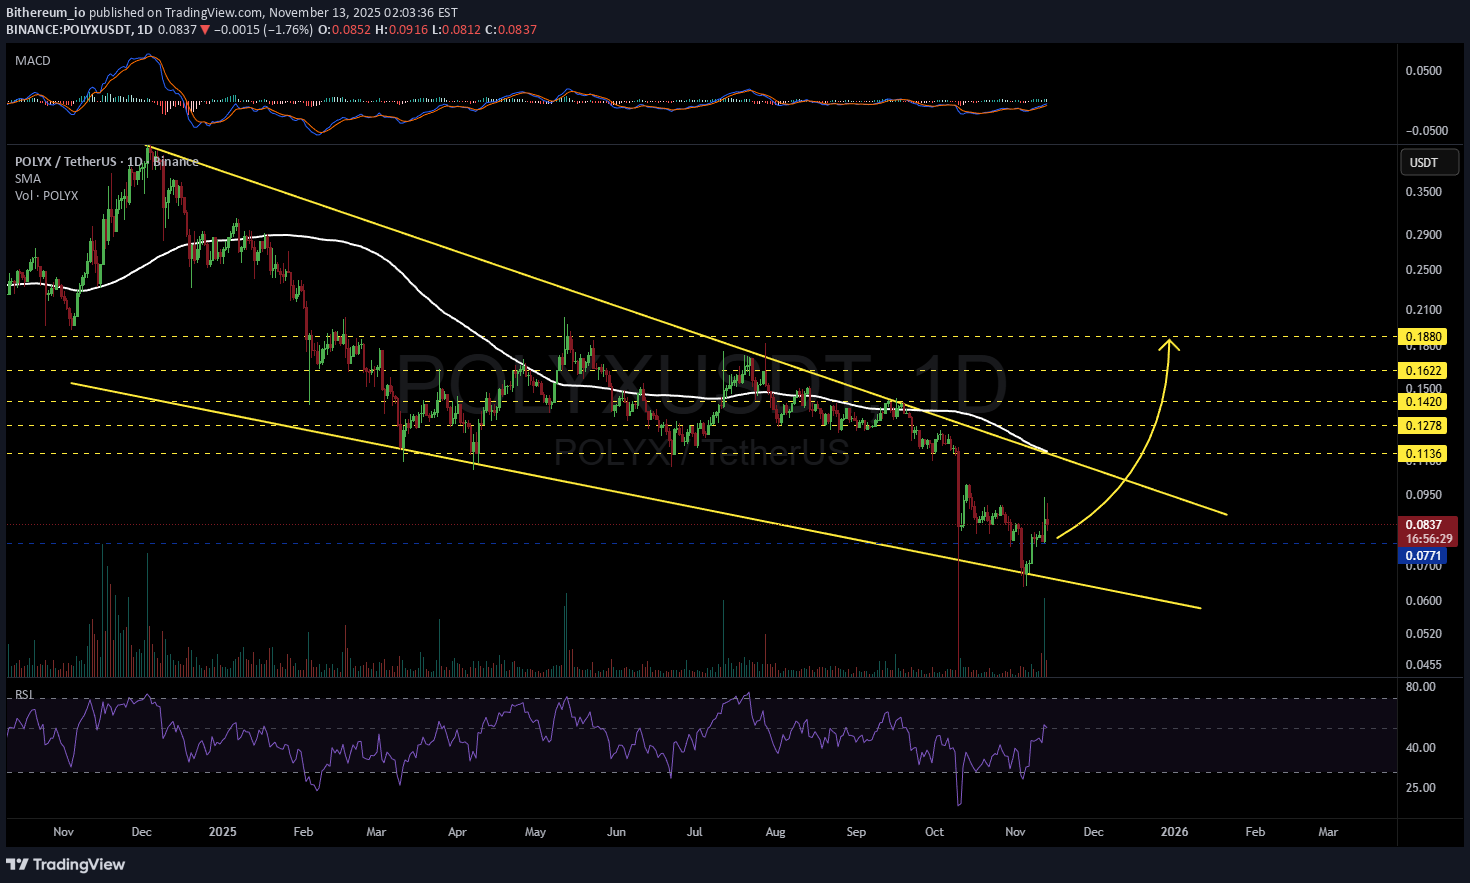
#POLYX is moving inside a falling wedge pattern on the daily chart. If the price breaks out above the wedge resistance and the daily SMA100, the potential upside targets are: 🎯 $0.1136 🎯 $0.1278 🎯 $0.1420 🎯 $0.1622 🎯 $0.1880 ⚠️ Always remember to use a tight stop-loss and maintain proper risk management.

Kapitalist01
سیگنال لحظهای 21:14: آیا این ترید کوتاهمدت سودآور است؟ (توصیه سرمایهگذاری نیست)
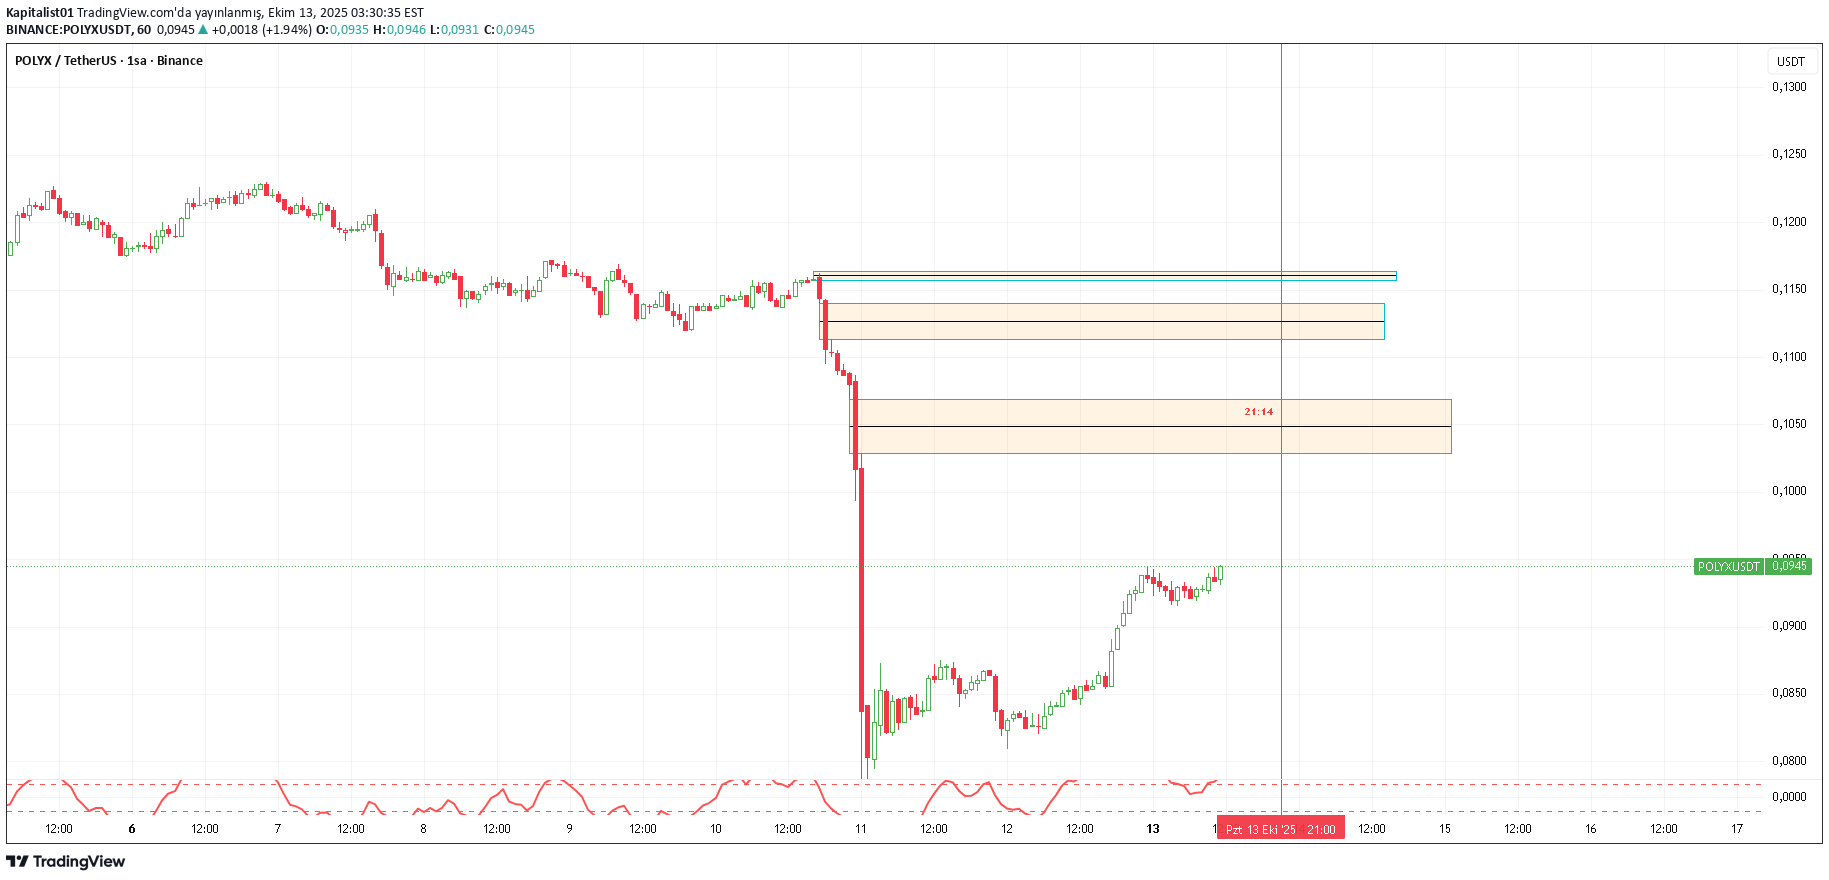
short term trading hours 13 October 21:14 It is not investment advice alt indicator for transaction direction is monitored on the five-minute chart. leveraged transaction close transaction between 2 and 5 percent note to self

CryptoNuclear
POLYX/USDT — Critical Support: Will It Bounce or Break Down?
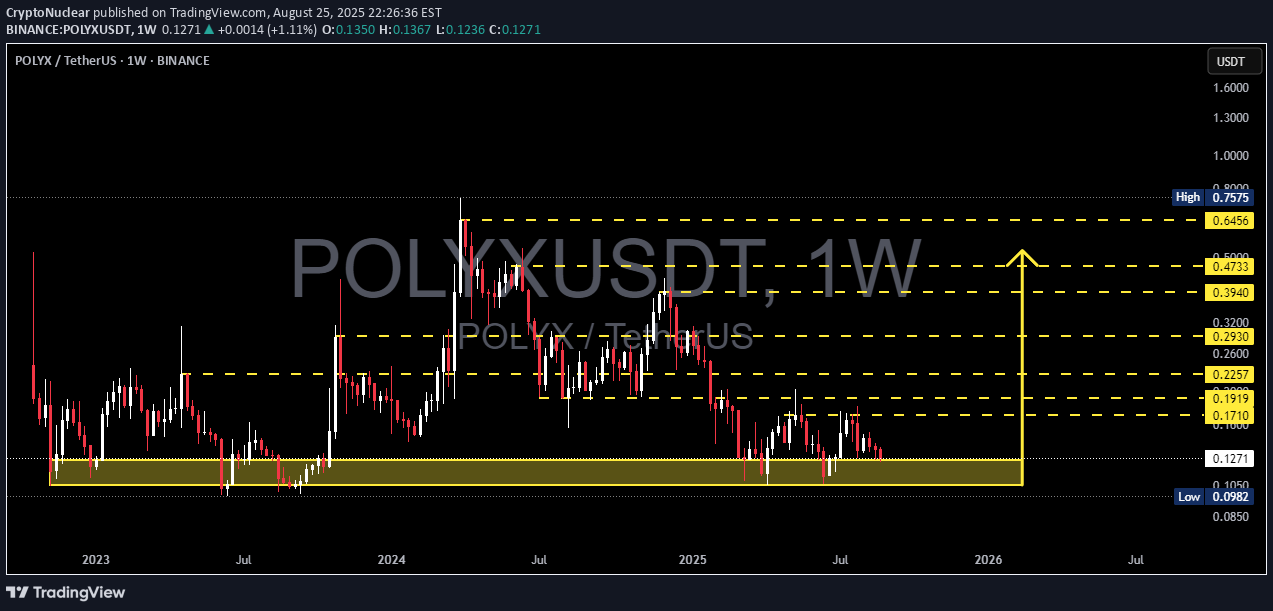
🔎 Overview The POLYX/USDT (1W, Binance) chart is currently testing a major historical support zone around $0.0982 – $0.1267. This level has repeatedly absorbed selling pressure over the past two years, making it a psychological and technical pivot that could determine the next big move. The macro structure is showing a series of lower highs, suggesting sustained selling pressure. At the same time, buyers are still defending this strong support zone, creating a battle zone between potential distribution and accumulation. --- 🏛 Pattern & Structure Descending Triangle Bias (Bearish): Lower highs combined with flat support → a distribution pattern, often leading to breakdowns if buyers fail. Alternative Scenario — Double Bottom / Accumulation (Bullish): If the support zone once again holds with strong bullish rejection, POLYX could build a base for a reversal rally. 👉 In short: POLYX is at a crossroad, awaiting weekly confirmation. --- 🚀 Bullish Scenario Confirmation: Weekly close above $0.1710, or strong bullish rejection (hammer / engulfing) off support. Targets: 1. $0.1919 (short-term resistance) 2. $0.2257 (key resistance) 3. $0.2930 (mid-term target) 4. $0.3940 – $0.4733 (major resistance, next swing zone) Stop-loss: Below $0.0982 (invalidates the support). --- 🕳️ Bearish Scenario Confirmation: Weekly close below $0.0982 → confirms breakdown of long-term support. Implication: Support flips into resistance, potentially opening a deeper bearish phase. Strategy: Avoid long entries if breakdown is confirmed. Look for retests (failed support → new resistance) as short setups. --- 🎯 Key Levels Main Support: $0.0982 – $0.1267 Major Resistances: $0.1710 → $0.1919 → $0.2257 → $0.2930 → $0.3940 → $0.4733 → $0.6456 Historical Swing High: $0.7575 --- 📝 Conclusion POLYX is at a make-or-break zone: If support holds → potential accumulation base for a recovery toward higher resistances. If it fails → the descending triangle structure likely plays out, signaling a bearish continuation. 📌 For traders: Aggressive: Consider scaling into small positions at support with tight SL. Conservative: Wait for confirmation above $0.1710 before entering long. Always apply risk management — this is a do or die zone for POLYX. #POLYX #POLYXUSDT #CryptoAnalysis #Altcoins #TechnicalAnalysis #SupportAndResistance #BullishScenario #BearishScenario #WeeklyChart

shahmir1000
POLYXUSDT.P LONG
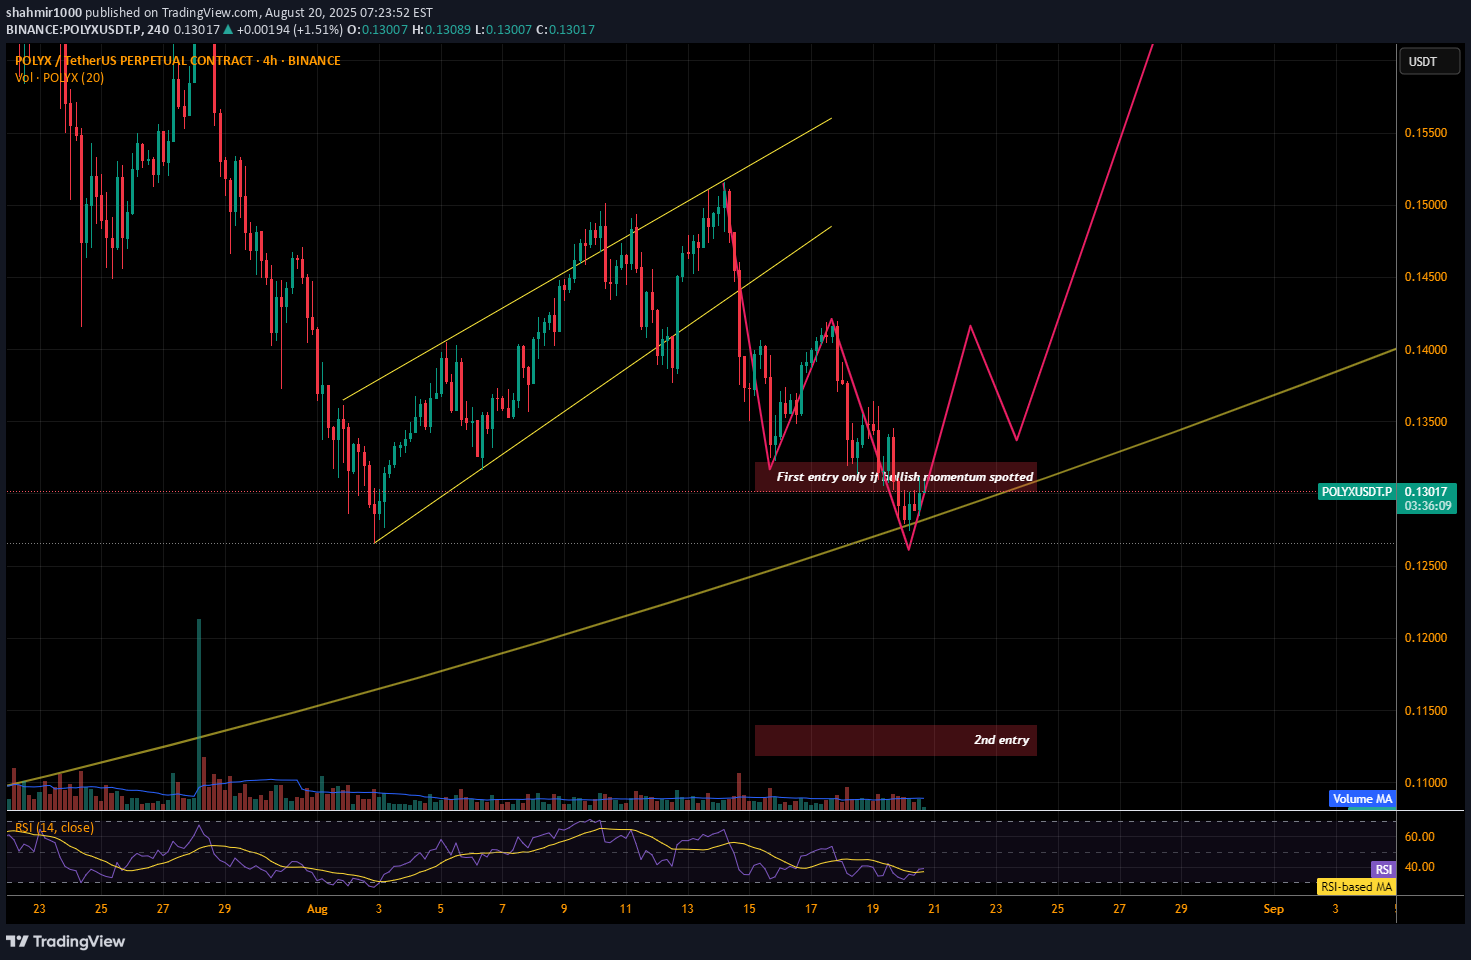
I am thinking that this will make an inverse head and shoulder. Lets wait and confirm the pattern. Only bullish pattern and candle sticks with volume will give us the confirmation.. Lets wait for the confirmation,, Keep following me guys to post as much as i can do for you guys.. And you guys can always ask anything.. Thanks

Alpha-GoldFX
POLYXUSDT Forming Falling Wedge
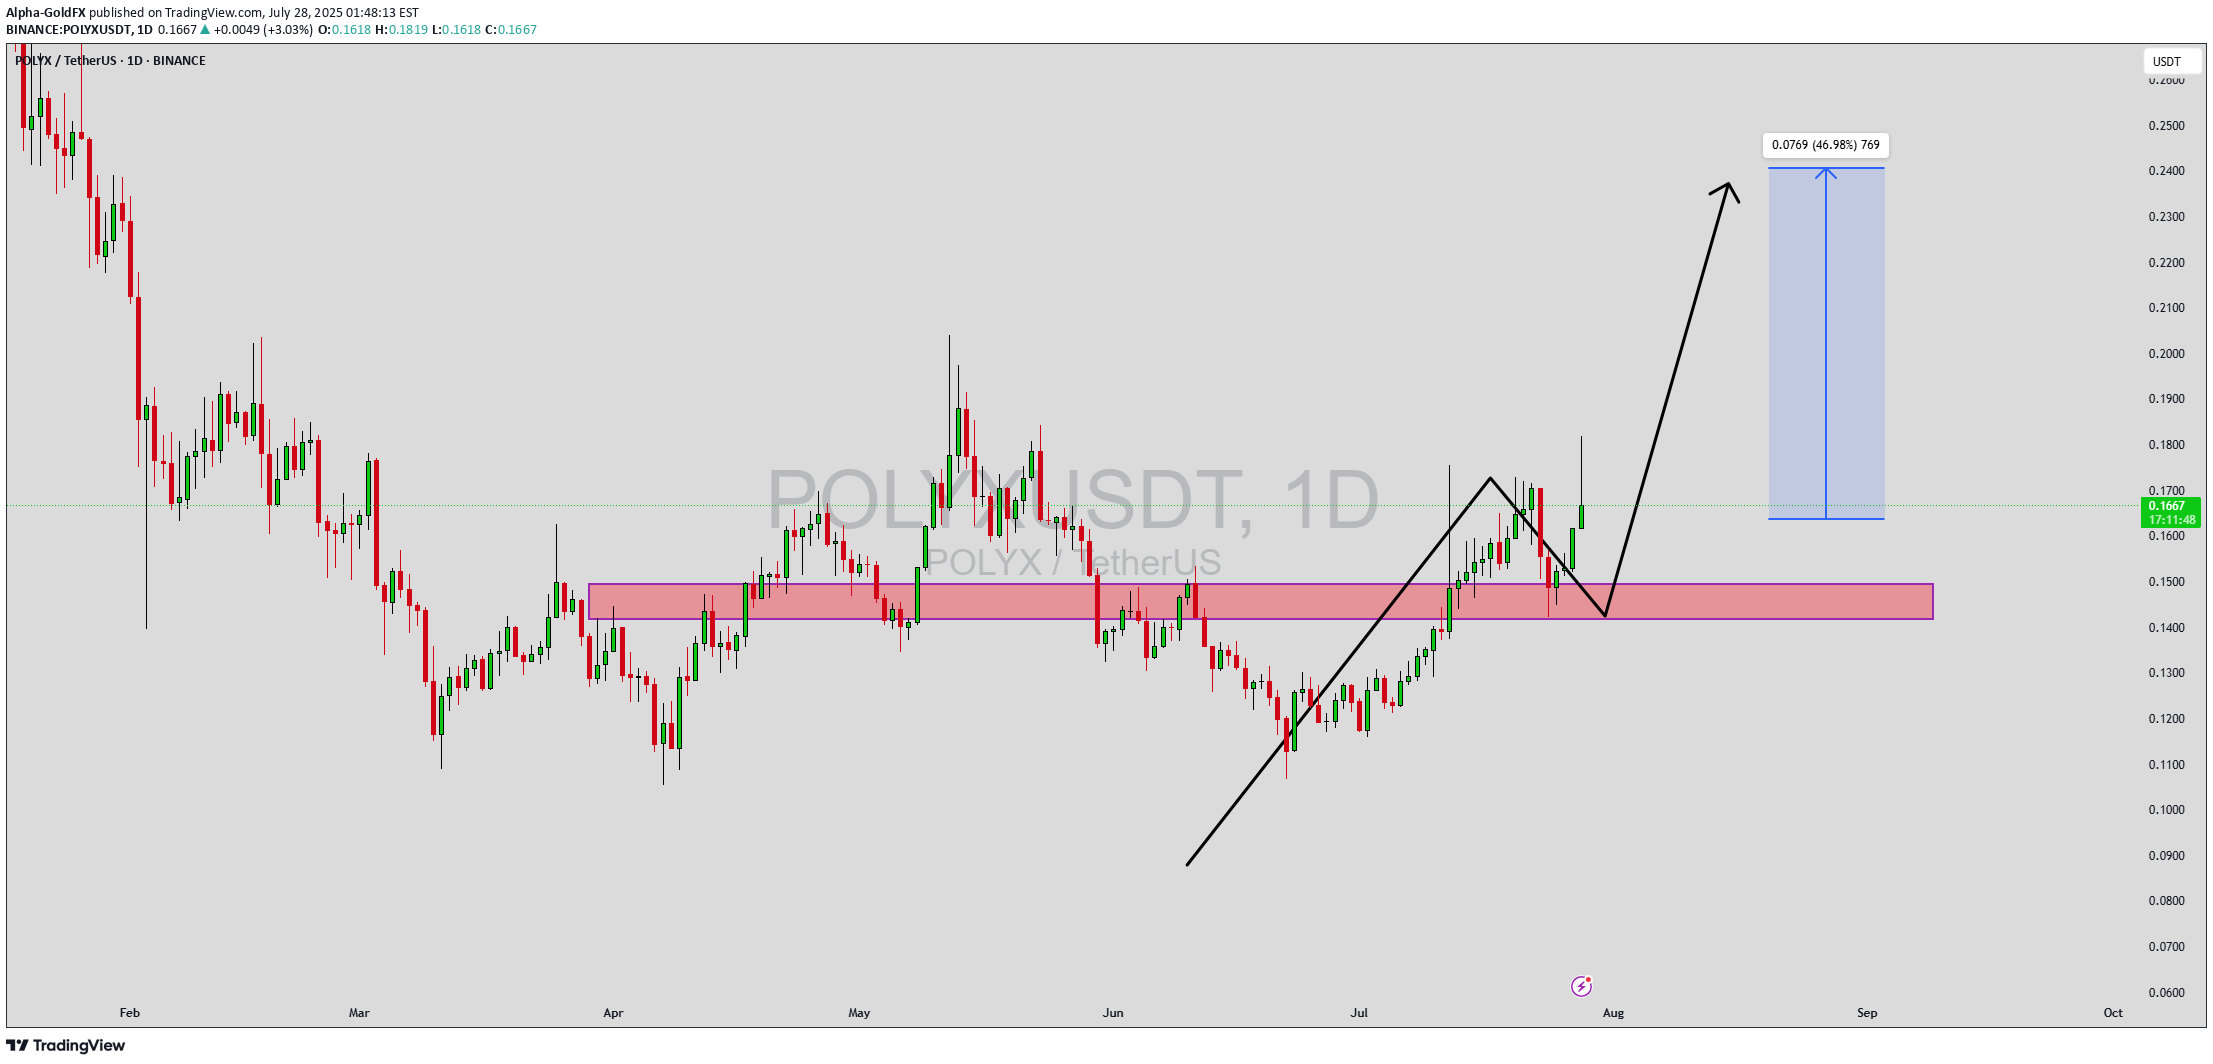
POLYXUSDT is currently showcasing a falling wedge pattern, a well-known bullish reversal setup that typically precedes a strong upward breakout. The chart structure reflects tightening price action with lower highs and lower lows, forming a wedge that has now broken to the upside. This pattern, coupled with a good spike in trading volume, supports the probability of a trend reversal. Price action has also respected the previous demand zone, reinforcing the likelihood of a sustained bullish movement. Traders are increasingly turning their attention to POLYXUSDT due to its historical tendency to rally after consolidation phases like this. With a potential gain of 30% to 40% projected from the current levels, it offers an attractive setup for swing traders aiming to catch early entries before broader market participation. The chart also suggests that the token has reclaimed key support-turned-resistance zones, a critical bullish indicator in technical analysis. The sentiment surrounding POLYX is improving as the broader altcoin market shows signs of recovery. As regulatory clarity improves and blockchain adoption expands, projects like Polymesh—which POLYX is native to—gain stronger traction. The falling wedge breakout, along with healthy volume and favorable macro signals, indicates that POLYX could be poised for a solid mid-term rally. It remains important for traders to watch retests of the breakout zone as confirmation before scaling in. This technical opportunity could evolve into a strong move if bullish momentum continues to build across the market. Monitor volume surges and daily candle confirmations as catalysts to further validate this potential breakout trade. ✅ Show your support by hitting the like button and ✅ Leaving a comment below! (What is You opinion about this Coin) Your feedback and engagement keep me inspired to share more insightful market analysis with you!

RiskandReward
Polyx usdt

There is a nice image, if the first place to go on the channel is dirty and retest, he might want to go to the hill 0.75.

GLANZZ
düşüş trendi devam ediyor Y.T.D
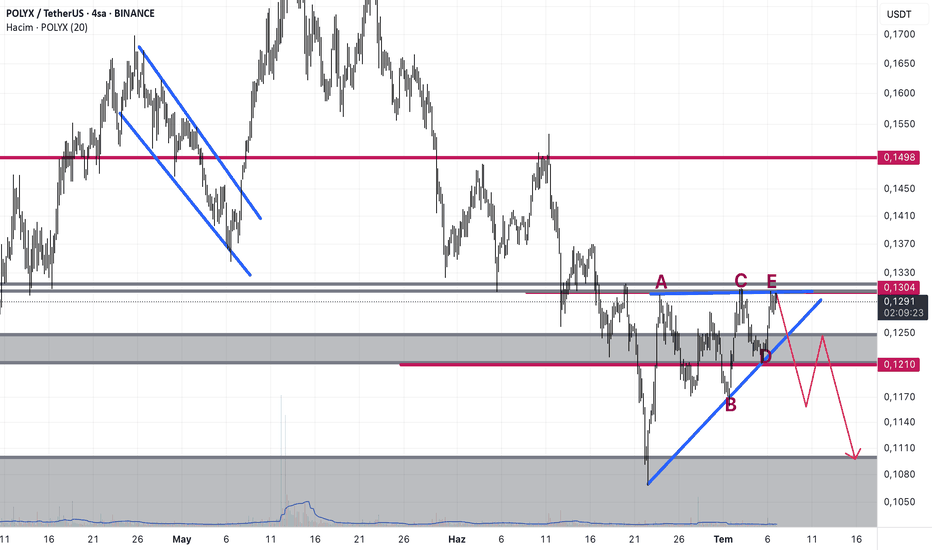
In my previous analysis, I shared the usdt and Altcoin dominance, but could not break the resistance area 3 times. TP1: 0.125 TP2: 0.11
GLANZZ
düşüş trendi devam ediyor Y.T.D
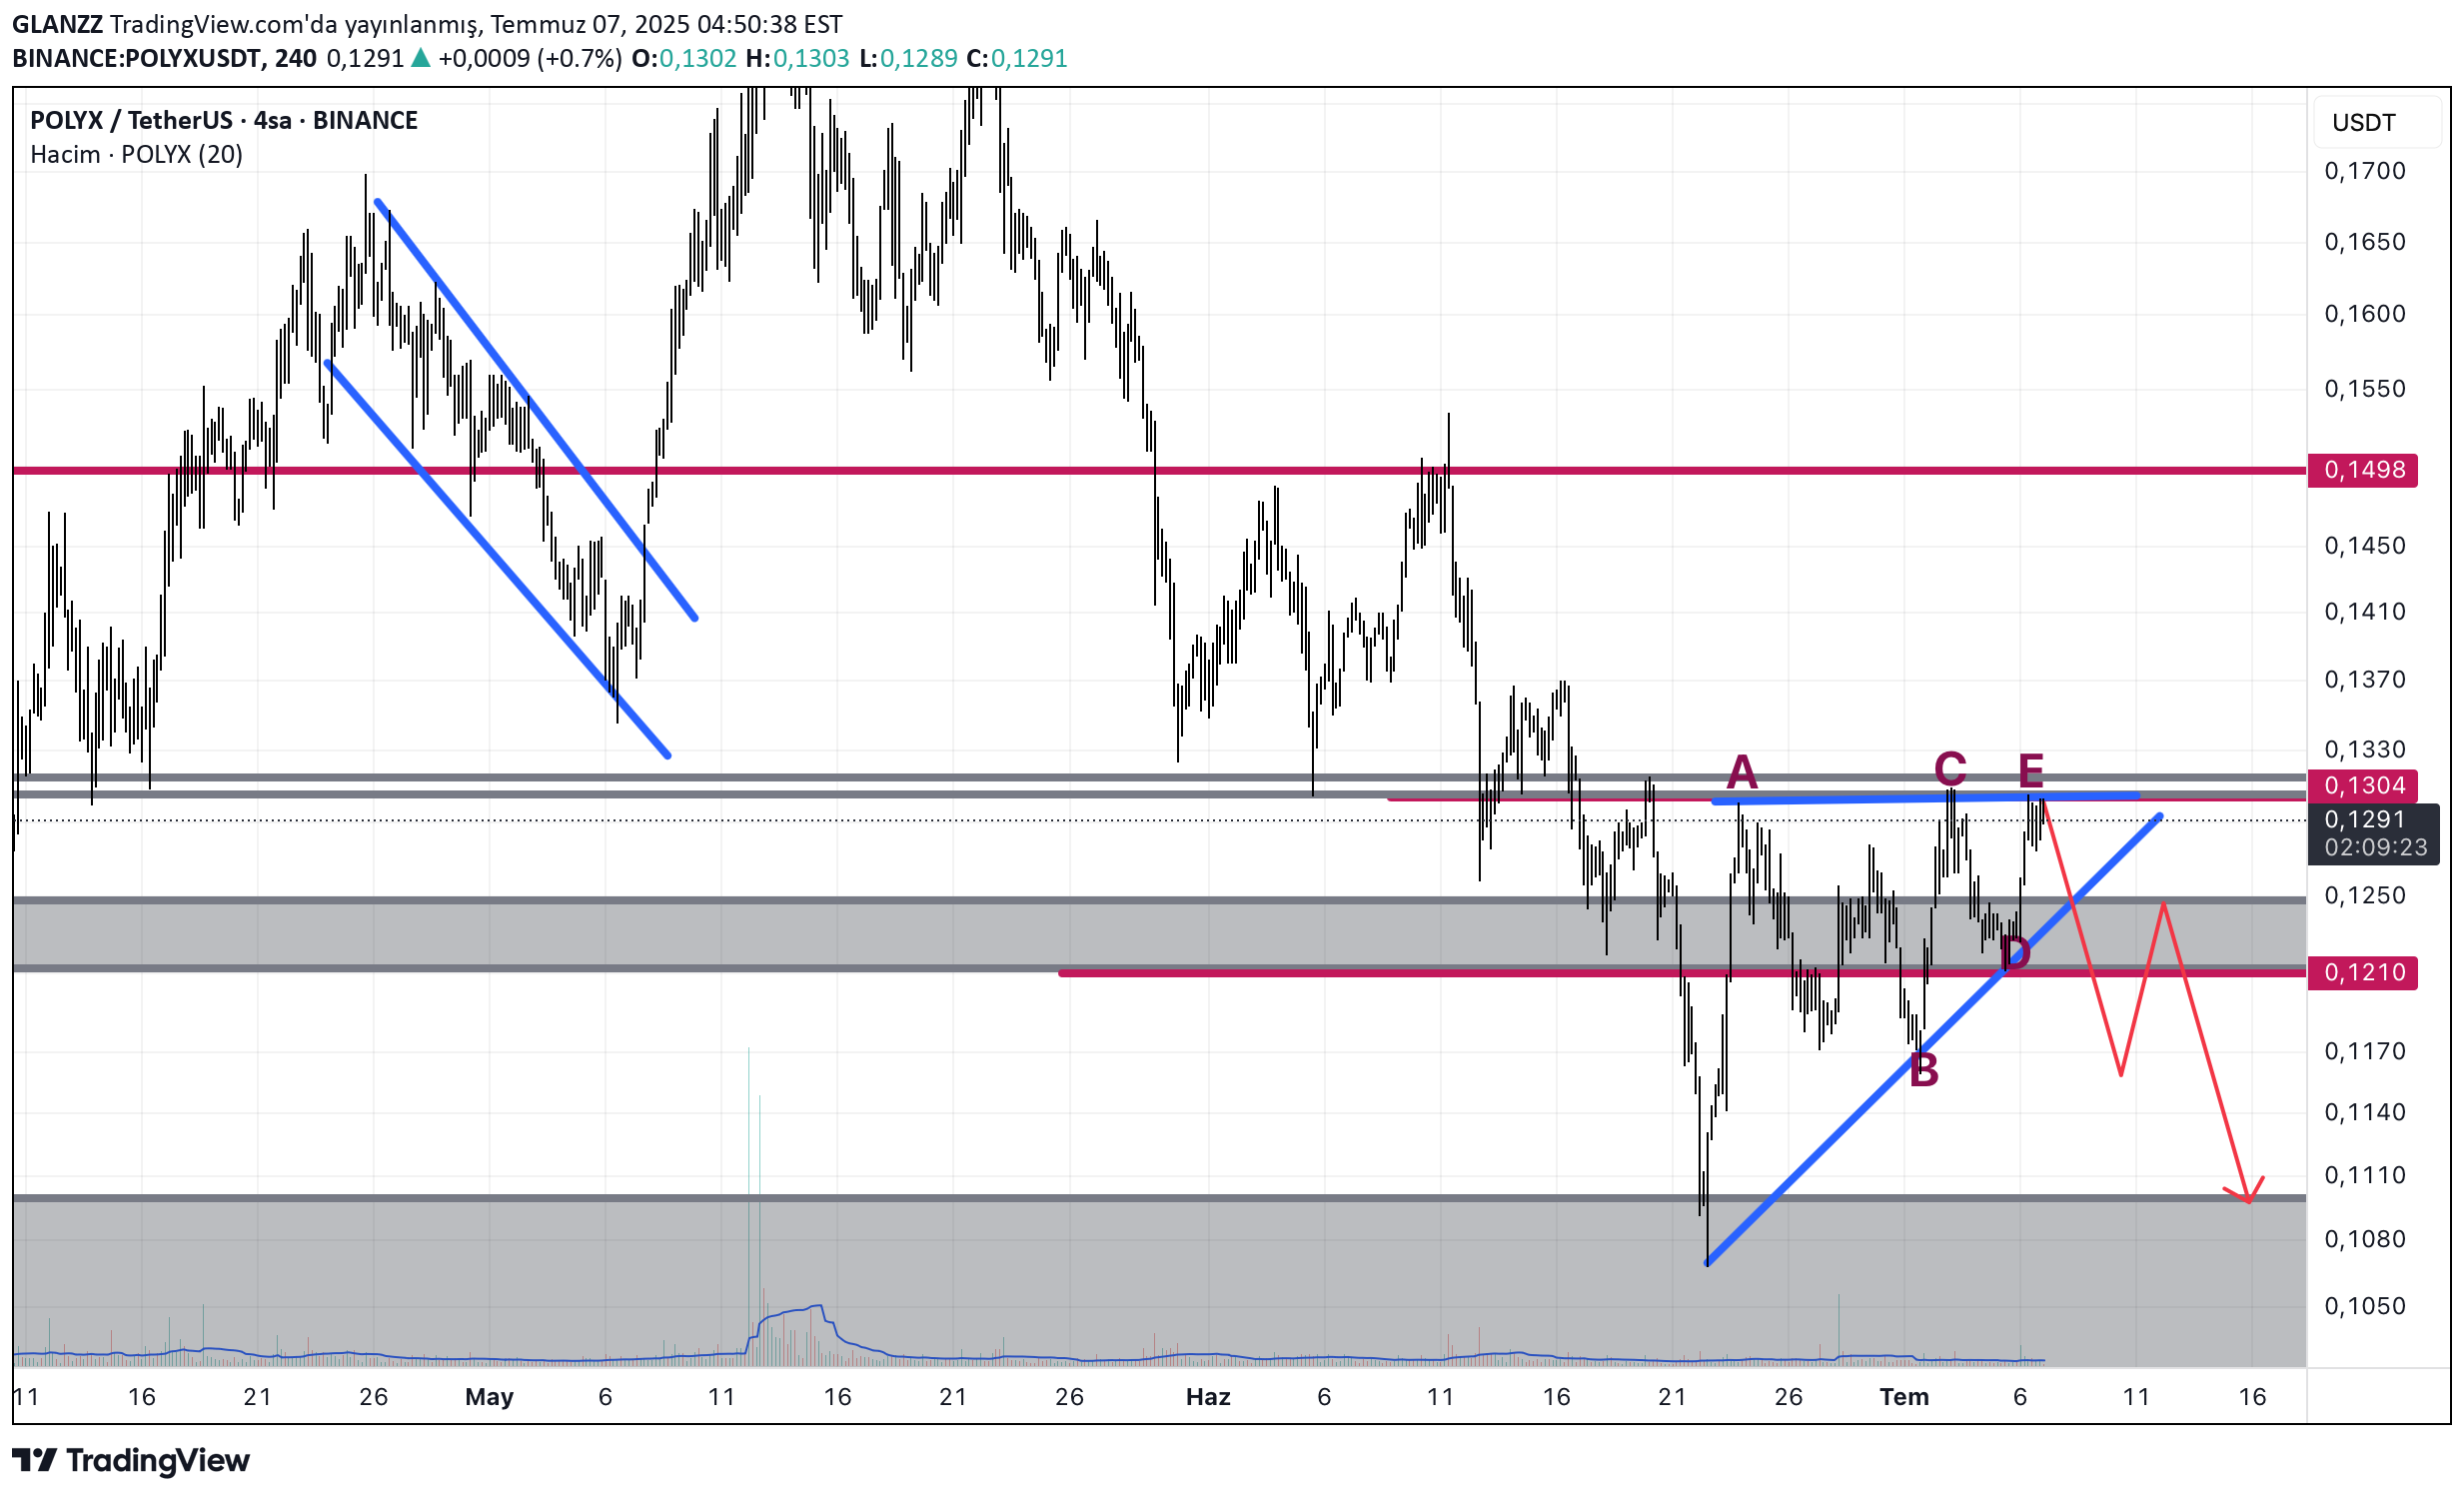
In my previous analysis, I shared usdt and Altcoin Dominance 3 times although he tested the resistance area 3 times.TP1: 0.125TP2: 0.11
CryptoNuclear
POLYXUSDT 1W Analysis


Arash-RK
POLYX: Primed for a Bounce? Long Opportunity at Channel Support.

Greetings, fellow traders, An interesting setup is forming on the POLYXUSDT chart. The price is currently situated near the lower boundary of an established ascending channel, suggesting a potential support zone. We are identifying a potential long entry under the following conditions: A confirmed close on the 1-hour (or 30-minute for more aggressive entries) timeframe within the confines of the delineated blue triangle on the chart. Alternatively, a decisive close above the $0.1830 resistance level. Should either of these conditions be met, a long position could be initiated with a primary price target of $0.2150. Best of luck with your trades. Trade with discipline and manage risk accordingly.
Disclaimer
Any content and materials included in Sahmeto's website and official communication channels are a compilation of personal opinions and analyses and are not binding. They do not constitute any recommendation for buying, selling, entering or exiting the stock market and cryptocurrency market. Also, all news and analyses included in the website and channels are merely republished information from official and unofficial domestic and foreign sources, and it is obvious that users of the said content are responsible for following up and ensuring the authenticity and accuracy of the materials. Therefore, while disclaiming responsibility, it is declared that the responsibility for any decision-making, action, and potential profit and loss in the capital market and cryptocurrency market lies with the trader.