
PHA
Phala Network
| تریدر | نوع سیگنال | حد سود/ضرر | زمان انتشار | مشاهده پیام |
|---|---|---|---|---|
No results found. | ||||
Price Chart of Phala Network
سود 3 Months :
سیگنالهای Phala Network
Filter
Sort messages by
Trader Type
Time Frame

Bithereum_io
آیا PHA به زودی از گوه نزولی خارج میشود؟ اهداف صعودی شگفتانگیز پس از شکست!
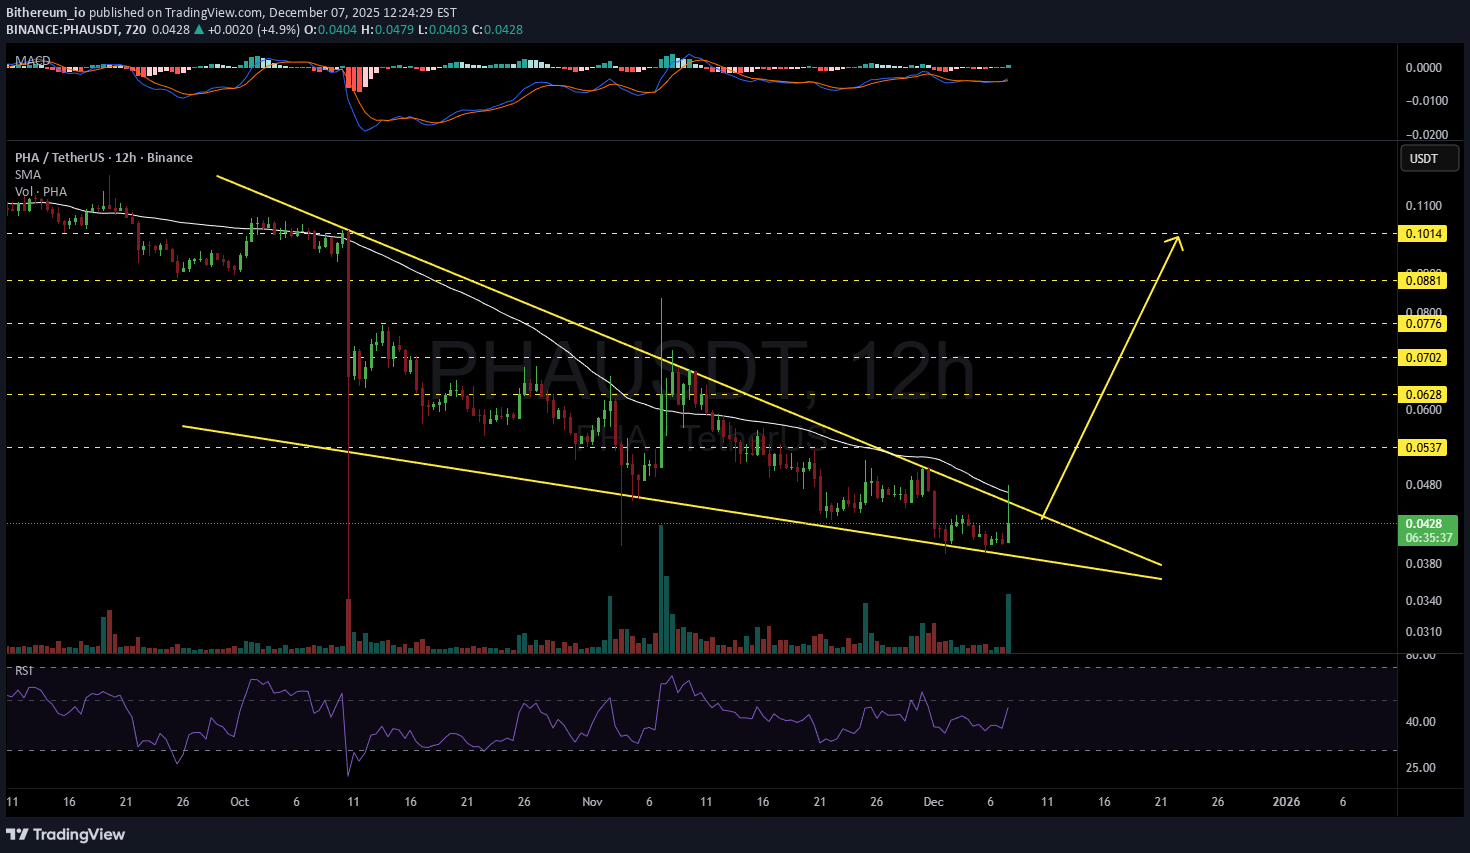
#PHA is moving inside a falling wedge pattern on the 12H timeframe. Volume has spiked, which is a positive sign. In case of a breakout above the wedge resistance and the 12H SMA50, the potential targets are: 🎯 $0.0537 🎯 $0.0628 🎯 $0.0702 🎯 $0.0776 🎯 $0.0881 🎯 $0.1014 ⚠️ Always remember to use a tight stop-loss and maintain proper risk management.

CryptoAnalystSignal
تحلیل فوری PHA/USDT: سیگنال خرید از منطقه حمایتی حیاتی با اهداف صعودی مشخص!
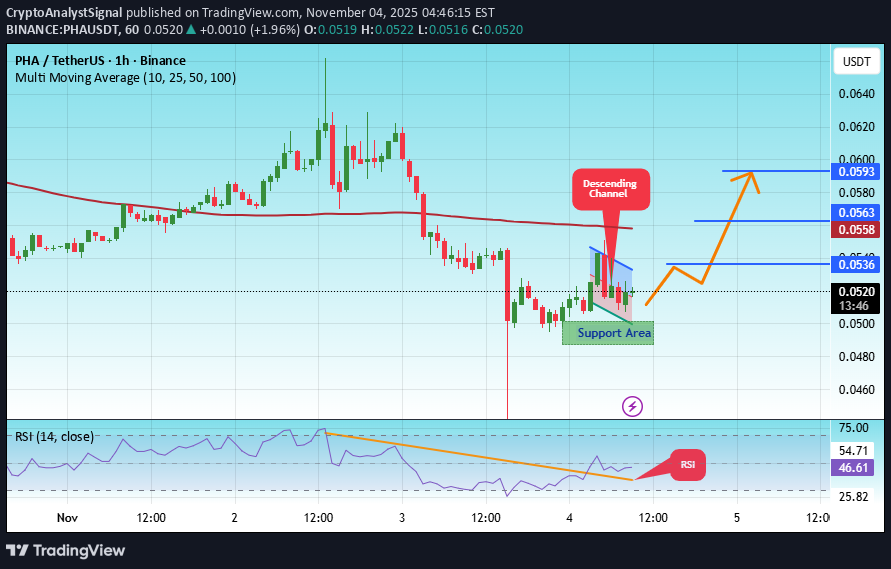
#PHA The price is moving within an ascending channel on the 1-hour timeframe and is holding well. It is poised to break out strongly and retest the channel. We have a downtrend line on the RSI indicator that is about to break and retest, which supports the upward move. There is a key support zone in green at 0.0492, representing a strong support point. We have a trend of consolidation above the 100-period moving average. Entry price: 0.0522 First target: 0.0536 Second target: 0.0563 Third target: 0.0593 Don't forget a simple money management rule: Place your stop-loss order below the green support zone. Once you reach the first target, save some money and then change your stop-loss order to an entry order. For any questions, please leave a comment. Thank you.

CryptoNuclear
PHA/USDT – Multi-Year Accumulation at a Critical Demand Zone!

Overview: PHA/USDT has been in a long downtrend since its 2021 peak. However, since mid-2022, price action has consistently formed a multi-year base around the 0.07 – 0.10 USDT demand zone (yellow box). This level has been tested several times, yet buyers continue to defend it, signaling strong accumulation interest. Each dip into this zone has resulted in sharp rebounds toward the 0.30–0.38 region, though rallies have failed to sustain. This highlights that the market is still in a waiting phase, seeking a strong catalyst before confirming a major breakout. --- Key Technical Levels Primary Support (Demand Zone): 0.070 – 0.097 Step-by-Step Resistances: 0.1357 → first breakout confirmation level 0.1897 → psychological barrier and potential rejection zone 0.3149 – 0.3790 → strong mid-term resistance cluster 0.6207 → major resistance, previous heavy supply zone 1.0666 – 1.2452 → long-term bullish targets if a full market cycle develops --- Pattern & Market Structure Current Formation: Accumulation Range (0.07 – 0.10) Price Action: Long lower wicks at support show repeated liquidity grabs and aggressive buyer re-entries. Conclusion: Market is consolidating sideways, building a potential base for the next major trend. --- Bullish Scenario 1. Trigger: A decisive 6D close above 0.1357 with strong volume. 2. Upside Targets: Target 1 → 0.1897 Target 2 → 0.3149 Target 3 → 0.3790 With strong momentum, expansion toward 0.62 – 1.06 is possible. 3. Catalyst: A broader crypto market uptrend could fuel a breakout from this prolonged consolidation. --- Bearish Scenario 1. Trigger: A 6D close below 0.0703 → breakdown of the multi-year demand zone. 2. Risk: Opens the door to new lows with potential panic selling. 3. Outcome: Such a breakdown often leads to a “capitulation bottom” before recovery. --- Investor & Trader Perspective Long-Term Investors: The 0.07–0.10 zone offers one of the best risk-reward opportunities for gradual accumulation, but patience and volatility tolerance are required. Short-Term Traders: Range trading works well here → buy near demand, sell near 0.135–0.19 with tight risk management. Trend Confirmation: Only a breakout above 0.1357 with volume validates a healthier bullish structure. --- Conclusion PHA is currently at one of the most critical turning points in its price history. If the 0.07–0.10 demand zone continues to hold, it could serve as the launchpad for the next major rally. But if it breaks down, PHA may face a deep bearish extension toward uncharted lows. In short: PHA is standing at a crossroads — either the beginning of a new bullish chapter, or a descent into capitulation. --- #PHA #PHAUSDT #CryptoAnalysis #Altcoin #PriceAction #SupportResistance #CryptoTrading #Accumulation #BreakoutSetup #RiskManagement

saviour25
#PHAUSDT 4H Chart

Price had tapped perfectly into a 4h area of demand where it bounced from. MACD is showing bearish weakness and RSI is slightly sold. Price is expected to keep pushing up towards our minor supply zone at $0.108 as a short-term target.

Cryptojobs
#PHA - Price Analysis
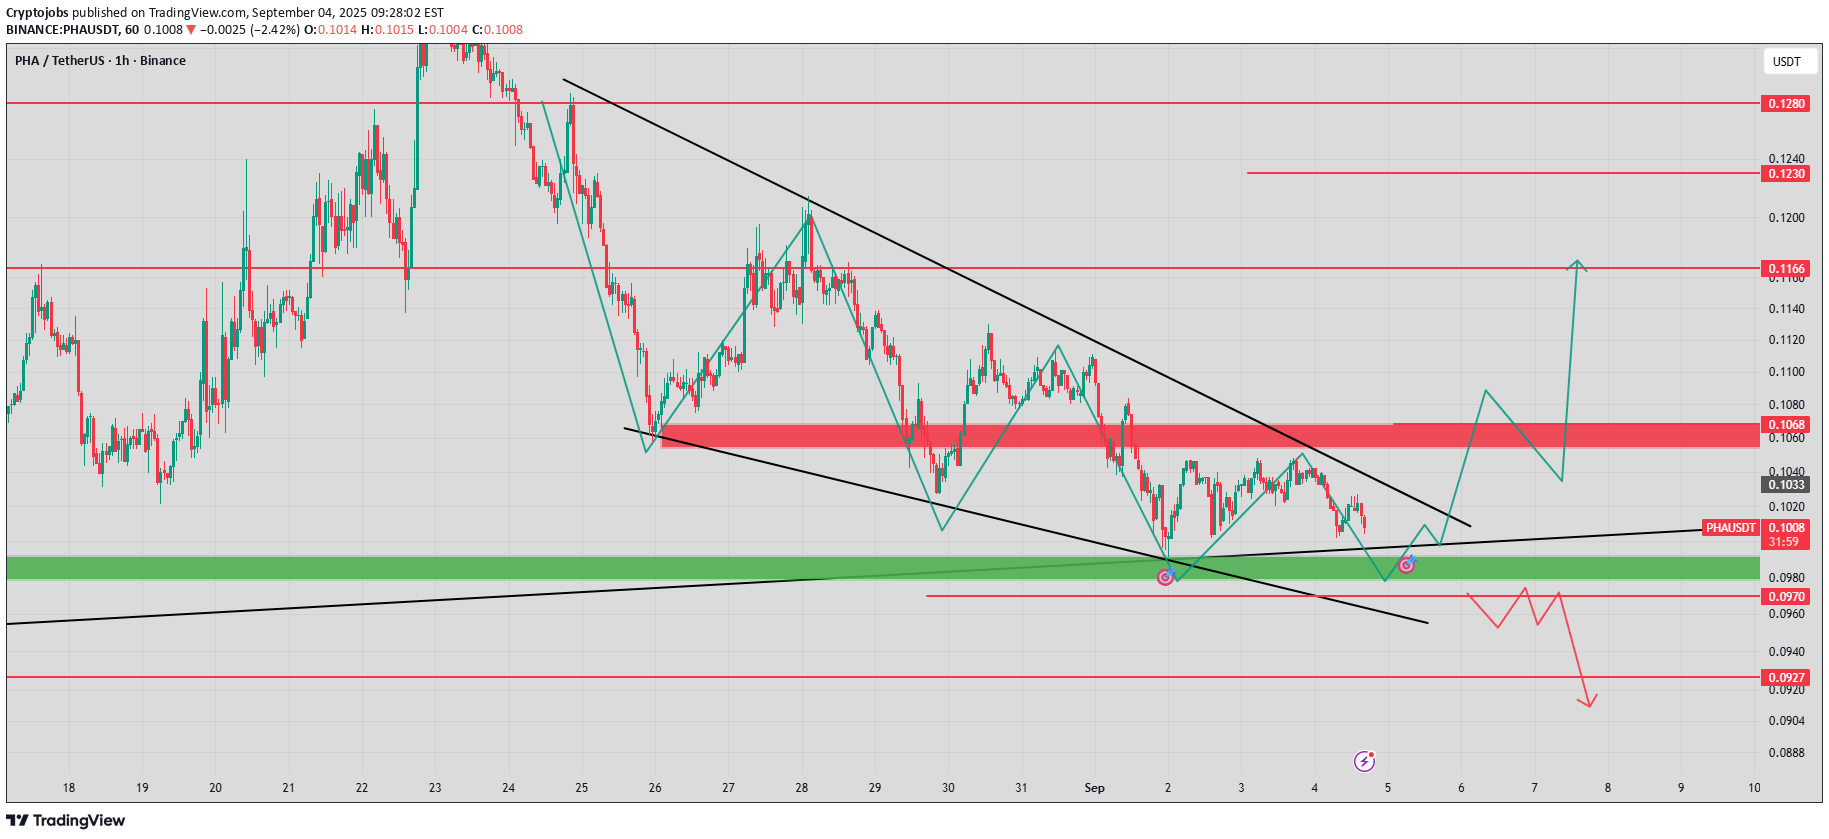
#PHA - Price Analysis 🔴 Still Bearish Beneath $0.1080–$0.1100 Resistance 🔸Structure: Bullish wedge forming 📈 🔸Daily Trend: Uptrend remains intact, continuing to support price 📈 Key Scenario: If price continues to consolidate above $0.0980, I anticipate a potential strong move upward. ⚠️ Uncertainty: It remains uncertain whether price will break down or not; but a breakdown is likely if we lose the $0.0970 level on a daily close. Key levels and detailed setups are highlighted on my chart. Better to wait for Bull volume coming in!
Bithereum_io
PHAUSDT 1D
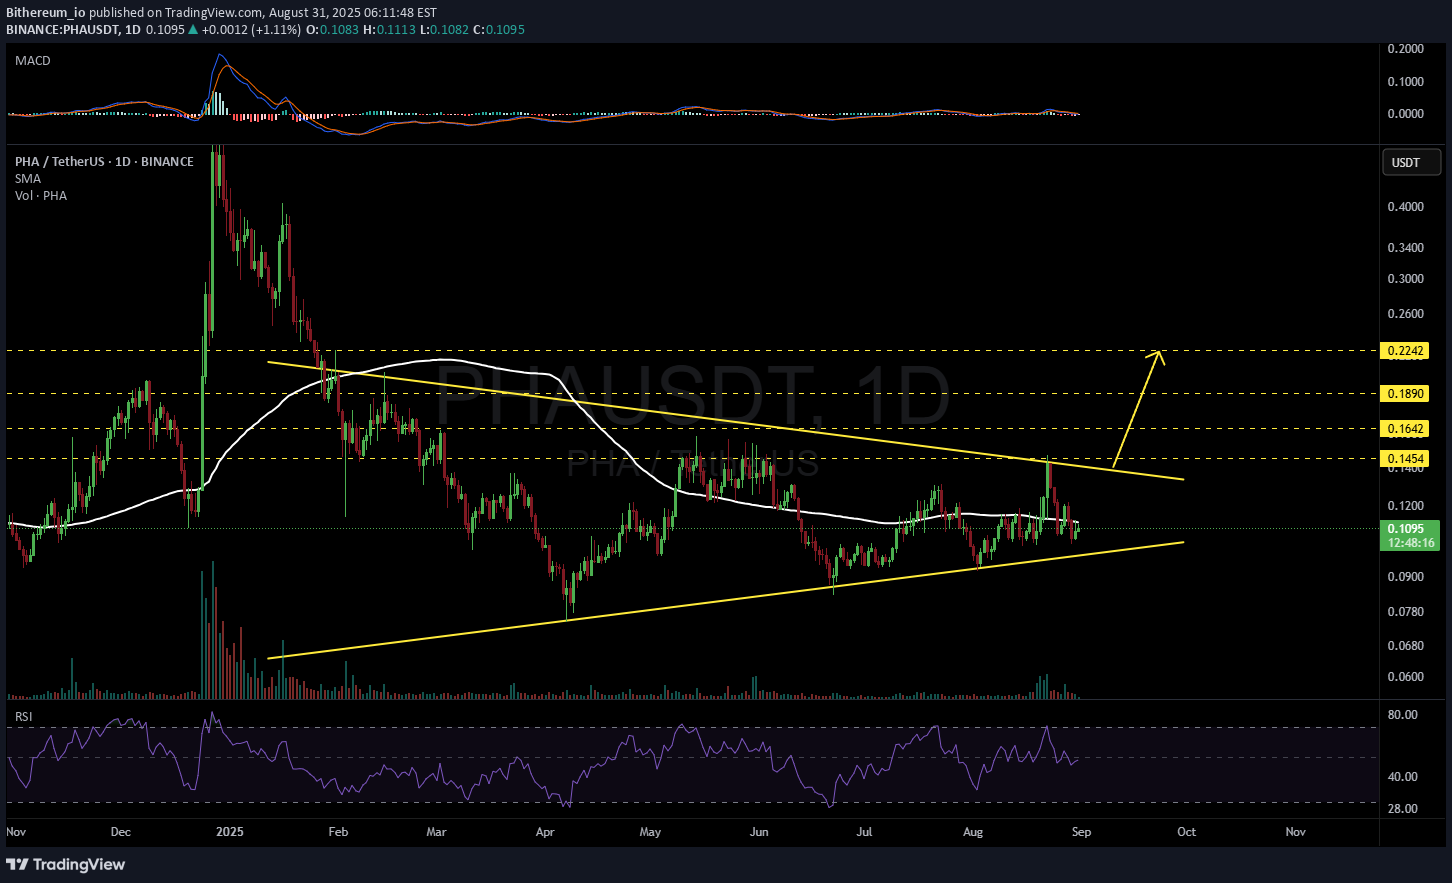
#PHA is moving within a symmetrical triangle on the daily chart and is currently facing the daily SMA100. A breakout above the SMA100 could signal further upside potential. If it breaks out above the triangle resistance, the targets are: 🎯 $0.1454 🎯 $0.1642 🎯 $0.1890 🎯 $0.2242 ⚠️ As always, use a tight stop-loss and proper risk management.

Worldofchartsfx
Pha finally on verge of breakout
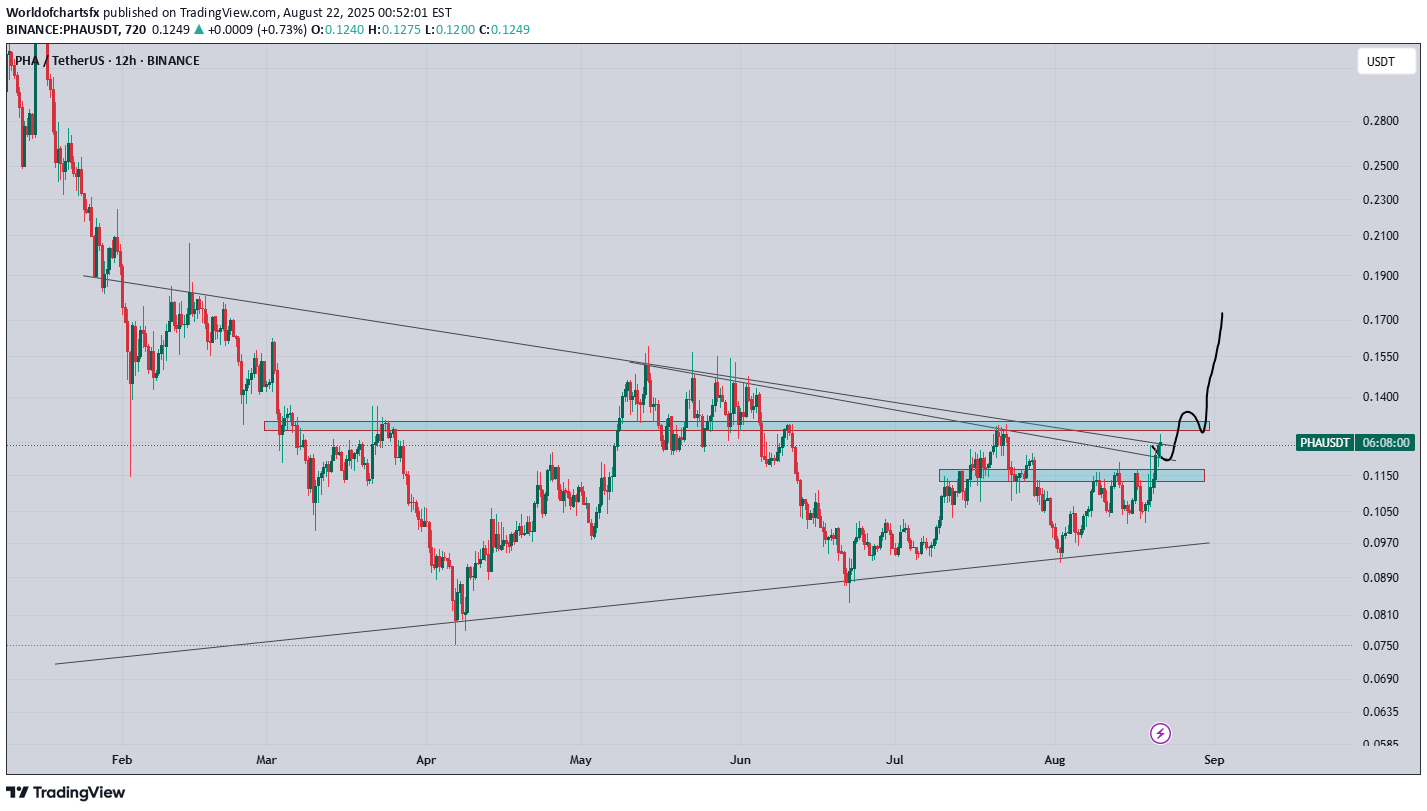
consolidating within symmetrical triangle from long time, now trying to clear these multiple lines, as long as its holding 0.11 area. i will remain bullish and after breakout it can give solid rally, expecting 2x in coming days

MasterAnanda
Phala Network ~2,000% Uptrend Missing, Why?
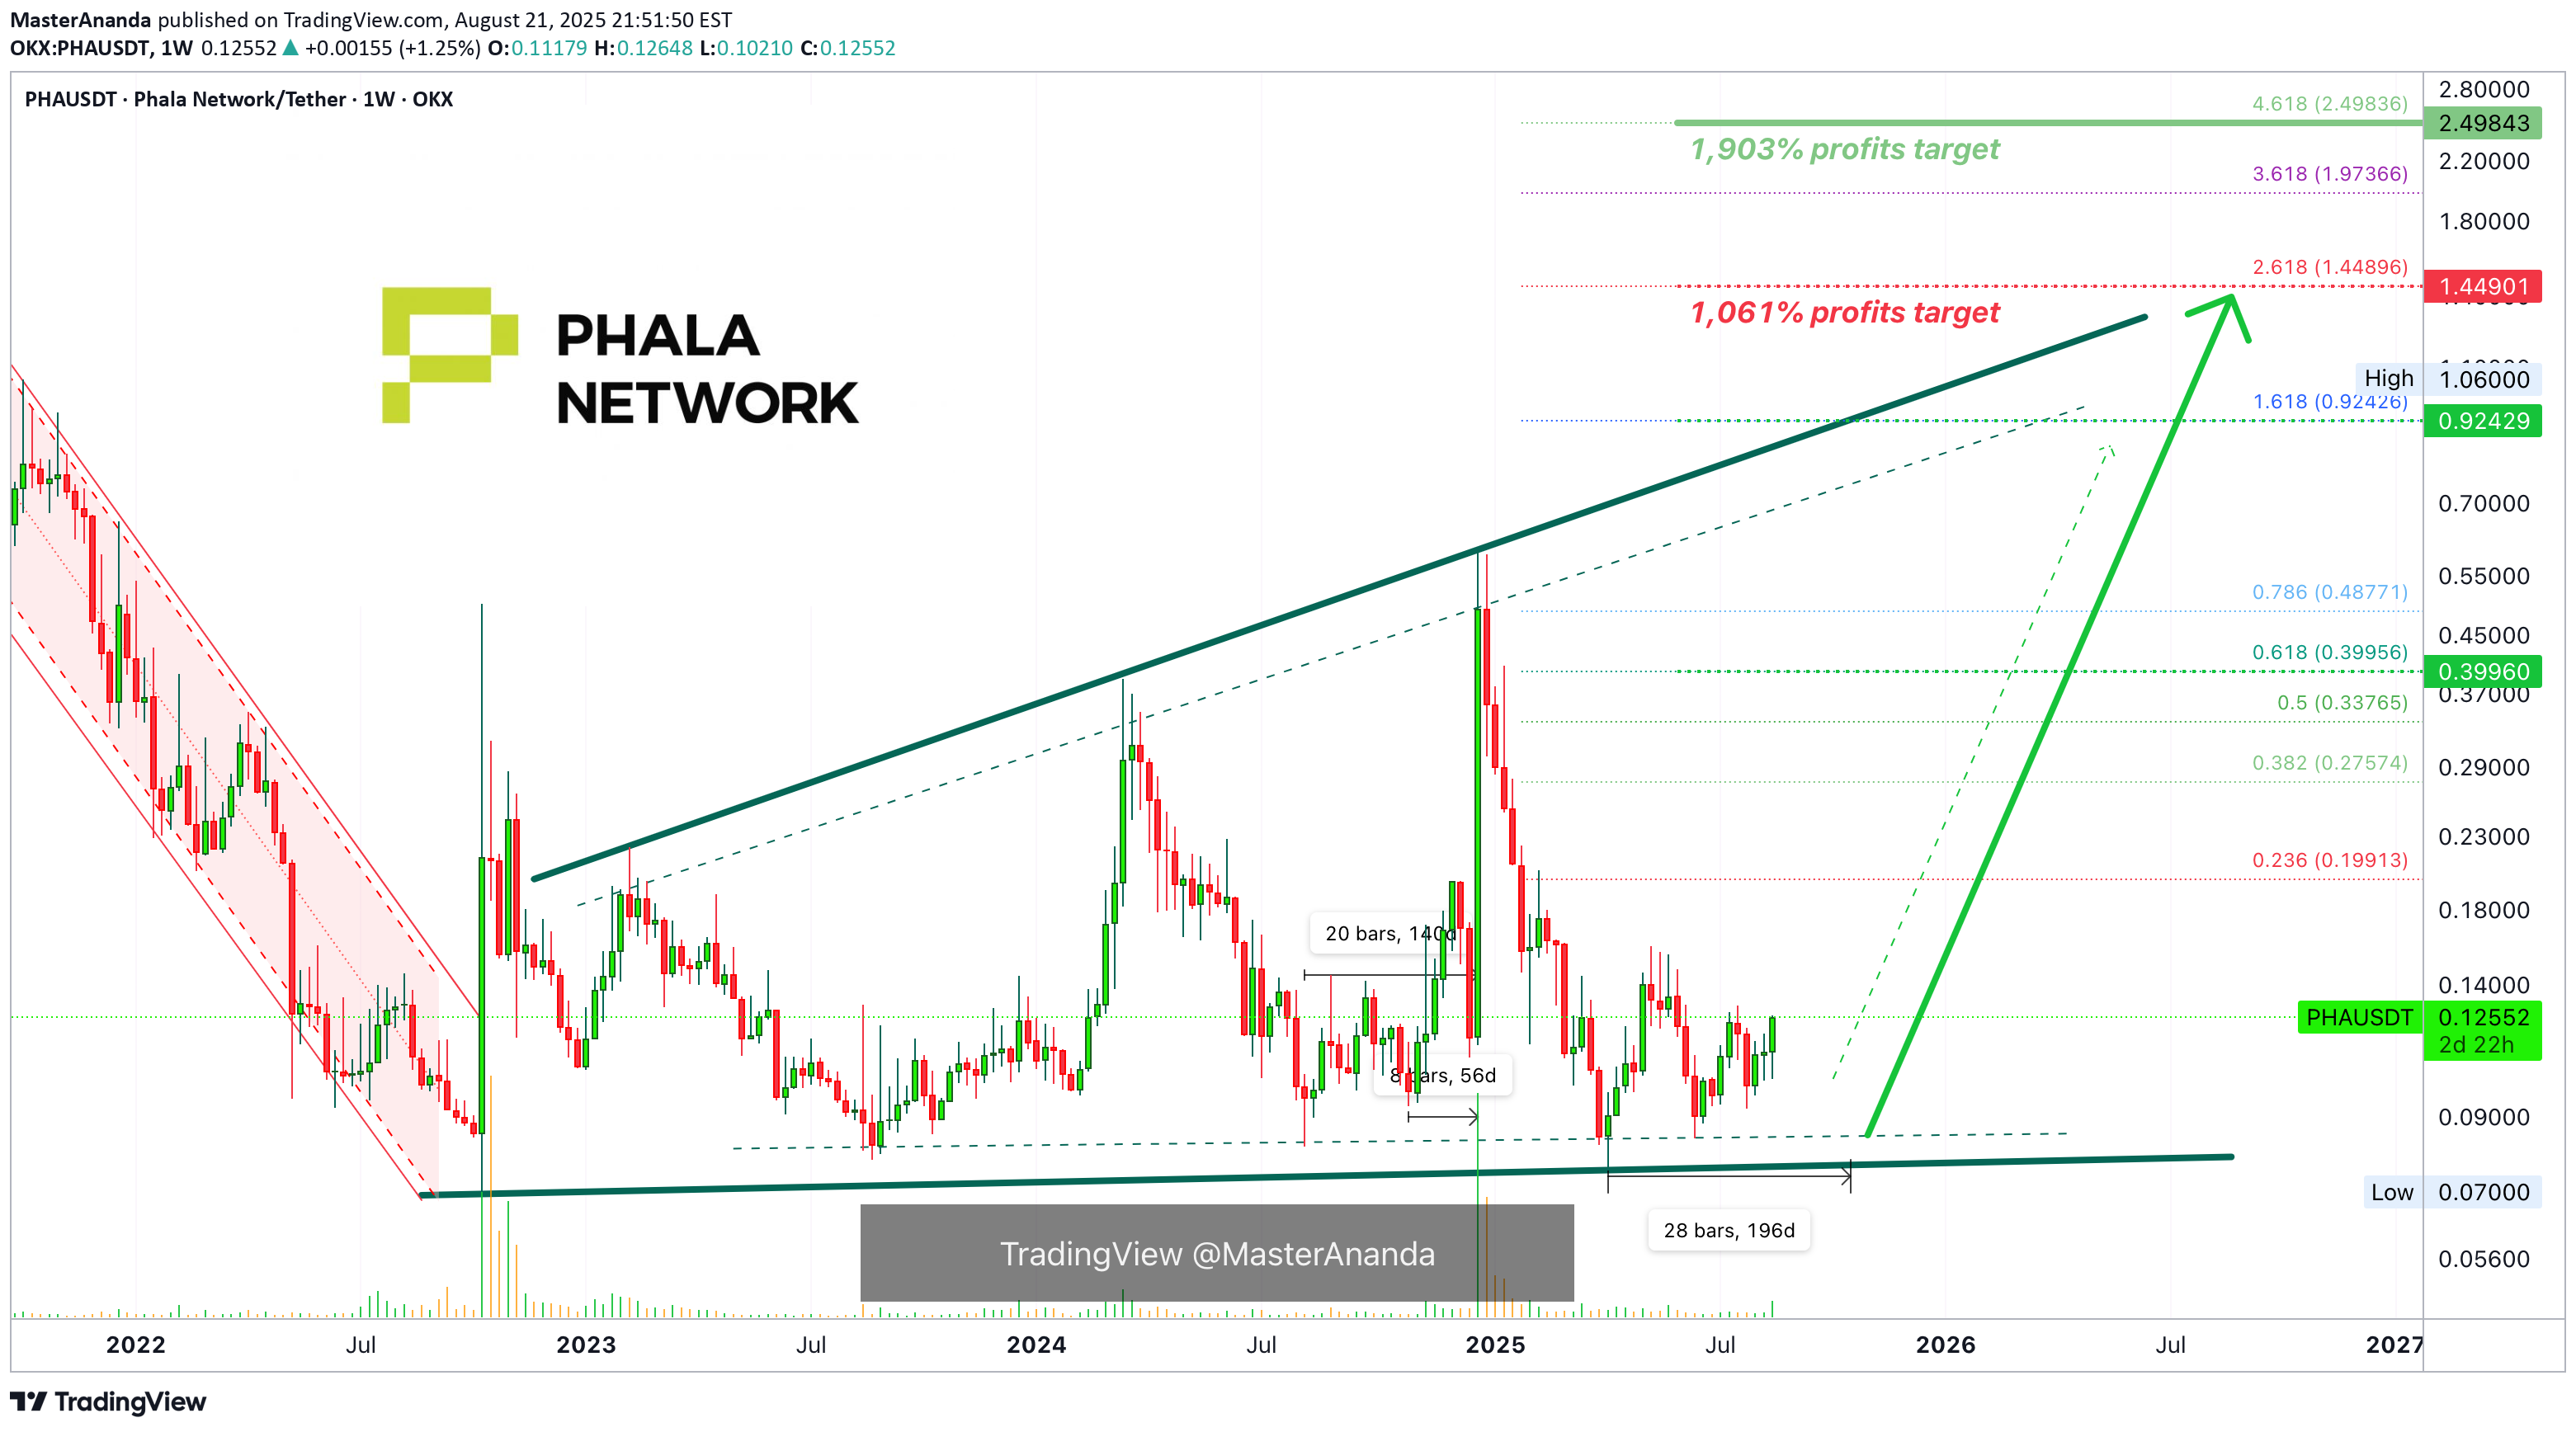
It is hard to believe that it has been four months already since we last updated this chart. This is PHAUSDT (Phala Network) and the last update happened 15-April 2025. Let me be clear and straight forward, market conditions are the same but better. PHAUSDT continues to consolidate at bottom prices. The good news here is that a strong bullish bias is developing. This is the third week that PHAUSDT is trading green and higher lows since April. A true bottom range as you can see as it was first activated in October 2022. This is the same level that was activated this April, 2025. From this low range and support zone, PHA has been growing strong. The last wave went beyond 600% profits, just to give you an example and the last wave lasted only 140 days, from bottom to top. The meat of the move happened in as little as 56 days. What can happen now with Phala Network growing long-term? To be fair, PHAUSDT has been ranging for 133 days already. If we consider "from bottom to top," adding two months would put us at October 2025 for a new peak, again, a very short time and it seems we have to hurry the entire chart and market to get there. On the other hand, if PHAUSDT were to grow, move lower, grow, move lower and then continue growing until late 2025, maybe December, or even into 2026, then the market doesn't need to hurry at all. If the market can drop for years, move sideways for years, it can also grow for years. Years of growth is the definition of an uptrend and we are missing one on this chart. Namaste.
CryptoNuclear
PHAUSDT at Make-or-Break Zone Is This the Calm Before the Storm?

📍 Chart Overview (6D Timeframe – Binance) PHA/USDT is currently retesting a major historical demand zone between $0.0703 - $0.0986, highlighted by the yellow box. This zone has acted as a strong base since mid-2022, repeatedly absorbing selling pressure and bouncing the price back up. Over the past two years, this accumulation zone has consistently held, forming a classic sideways structure, typically seen before a major breakout. However, the inability to break through the upper resistances suggests persistent bearish pressure. Now, the market is nearing a make-or-break moment that could lead to a decisive move in either direction. --- 🔎 Pattern Identified: "Extended Accumulation + Volatility Compression" The price is trading inside a long-term accumulation range, indicating that smart money might be quietly buying. We're seeing signs of volatility compression, a precursor to breakout volatility. Repeated lower wicks near the demand zone show strong buying interest on dips. This setup may produce a “spring” scenario, where a false breakdown triggers a strong reversal rally. --- 🟢 Bullish Scenario (Rejection From Demand Zone): If the price continues to hold above $0.0986 and forms a higher low structure: Bullish Targets: 1. $0.1357 – Minor historical resistance 2. $0.1897 – Key horizontal resistance 3. $0.3790 – Mid-range breakout target 4. $1.0666 – Long-term retracement target Bullish Confirmation Signals: ✅ Break and daily close above $0.1357 ✅ Increased volume on breakout ✅ Bullish candle structure near support --- 🔴 Bearish Scenario (Breakdown of Accumulation Zone): If the price fails to hold $0.0703 – $0.0986 and breaks down with strong volume: Bearish Targets: 1. $0.0590 – Psychological support 2. Below $0.0500 – Open downside 3. Trend shifts into bearish continuation structure Bearish Confirmation Signals: ❌ Strong close below $0.0703 ❌ Volume spike on red candle ❌ Lack of bullish response --- 🧠 Strategic Notes for Traders & Investors: This zone offers a low-risk, high-reward opportunity for speculative positioning, with a tight stop-loss below $0.0703. Due to prolonged compression, any breakout (up or down) could be explosive. Be cautious of false breakouts. Wait for confirmation via volume and price action. --- 🗣️ Conclusion: PHA/USDT is sitting at a technical inflection point that has historically triggered strong market reactions. After two years of coiling price action, this extended accumulation phase is nearing its resolution. What happens next will likely define the long-term trajectory for this asset. Don’t sleep on this setup — whether you’re bullish or bearish, this is where attention should be focused. #PHAUSDT #PHA #CryptoAnalysis #AltcoinSetup #TechnicalAnalysis #BreakoutWatch #AccumulationZone #StrongSupport #CryptoTrading

SpartaBTC
PHA Main trend since 2020. Hype Web3 AI 07 2025

Cryptocurrency as an example. This applies to all similar assets by liquidity. Logarithm main trend. Time frame 1 week (smaller time frame, to understand the shown and described, is not necessary). Cryptocurrency is an imitation of utility with a good legend, which is traded on liquid exchanges (in the decline phase in the next cycle) most likely there will be delists, if they do not make a “restart” (rebranding). A big plus in the crypto legend of this project is that it is mentioned as the basis of the legend of Web3 and AI. What is it. Phala Network is an execution layer for Web3 AI. By allowing AI to understand blockchains and interact with them, it removes the barrier for the first billion users joining Web3. Phala Network's multi-security system is a solution to the problem of AI execution. Based on Phala Network, you can easily create hack-proof and unstoppable AI agents tightly integrated with on-chain smart contracts using AI-Agent Contract. Agentize smart contracts: create AI agents for smart contracts using natural and programming languages. End of participation phase. Created a project at the end of the participation phase in 2020 09 before entering the distribution zone of the last cycle with the highs of 2021. Market distribution . Then, under the hype of alts, very aggressive convincing marketing and pumping over +1500%. Long distribution (more than 9 months) with price retention at a huge profit and publication of convincing fairy tales-news for “pouring” fresh fuel (mass pipel) through info wires in the market distribution zone of 2021. Phase of decline to the recruitment zone. (partial change of hands, those who created, they do not need it). Phase of decline from the sales zone (advertisement is good), to the purchase zone (no advertising, no activity) -93%. That is, the “fresh fuel” money of investors turned into “dust” on the spot (conditionally $ 1000 of super promising next "shit", in $ 50-100), on futures still in the distribution zone “disappeared”. Phase of accumulation (use of many short alt seasons to shake the price and “shake out”). Upon reaching the recruitment zone, — reverse. They made a reversal, pump-buyout of liquidity (their heavy orders) by a large % (+580%), which served as the starting points for the formation of the horizontal pump / dump channel range, that is, conditional accumulation. Now another wedge is being formed locally in the horizontal channel — its breakthrough, the beginning of the pumping and another altseason, which can develop into the participation phase. It is worth noting that they can enter the long stop loss and long liquidation zone when forming a wedge (this often happens). Take this into account in your money management in advance. Accept risks, or distribute entry money when implementing force majeure in advance, even if you do not lie that this is possible. The capitulation phase (part of accumulation, liquidity collection), that is, “dumping passengers” and the final liquidation of their faith, does not always happen, which is logical. On weak assets (very old, low liquidity), outright scams that have "outlived their usefulness", the capitulation phase sometimes ends in a complete scam. Alt-seasons of accumulation and capitulation zones . During this time, there were 3 average alt seasons, which naturally affected the price of this cryptocurrency (3 pumping waves in the channel +580%, +300%, +650% (average gain/drop conditionally in half), price movements in the median zone of a large trend channel. Participation phase — most likely, there will be a series of pumps with sticks under the market trend as a whole, and most importantly, the hype of everything related to AI. Distribution phase — most likely will be shorter in time than before, and still I would exit mostly under the mirror zone of the previous distribution, as the project is “old”, the hype "the chart remembers the deceived investors". Then two options, the development of the paths of which depends on the market as a whole, and not on this candy wrapper. a) Consolidation and exit from it to the second zone of the final distribution ("the hamster is not scared", "it will grow forever"). b) Transition to the decline phase, then the fading of marketing, the final loss of liquidity (supporting the project with money), and a gradual (delists, regulation, norms) or sharp scam (hacking, etc.). It does not matter which path we take in the distribution phase, the final path, like everything similar created under the hype, is the loss of liquidity, oblivion and scam. Therefore, do not forget to sell such (99.999% of the crypto market) at high prices, despite the positive news deception creeping into the mind through the ears and eyes. Rebranding. Restart. Resetting price charts. If they do it like EOS and similar "old" scams — rebranding (preparing for a new market hype in advance), and remove all charts from exchanges, so that for the new market hype as a whole, the project would be “fresh” according to the chart, new, that is, the previous scam of "few experienced investors" would not be visible, then pumping up more than +1000% is possible, but this is irrational... As you need to spend a lot of money, it is easier to create a new imitation of something useful... The market phases are clearly visible on the chart. I also described everything in detail.
Disclaimer
Any content and materials included in Sahmeto's website and official communication channels are a compilation of personal opinions and analyses and are not binding. They do not constitute any recommendation for buying, selling, entering or exiting the stock market and cryptocurrency market. Also, all news and analyses included in the website and channels are merely republished information from official and unofficial domestic and foreign sources, and it is obvious that users of the said content are responsible for following up and ensuring the authenticity and accuracy of the materials. Therefore, while disclaiming responsibility, it is declared that the responsibility for any decision-making, action, and potential profit and loss in the capital market and cryptocurrency market lies with the trader.