
ONE
Harmony
| تریدر | نوع سیگنال | حد سود/ضرر | زمان انتشار | مشاهده پیام |
|---|---|---|---|---|
No results found. | ||||
Price Chart of Harmony
سود 3 Months :
سیگنالهای Harmony
Filter
Sort messages by
Trader Type
Time Frame
SIGNOLL
تحلیل جدید Harmony (ONE) با الگو: آیا این ارز به یک دلار میرسد؟
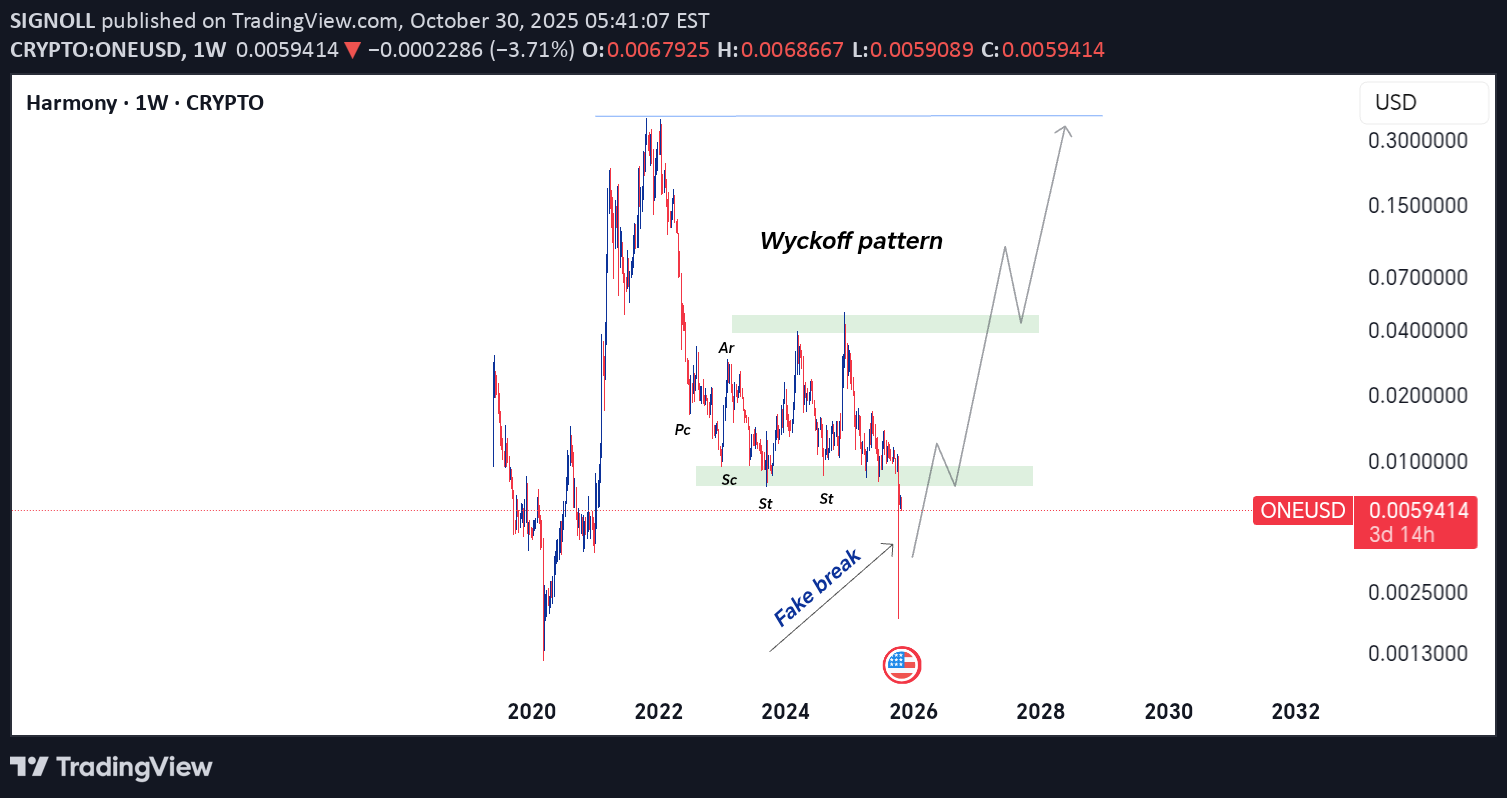
Another Analysis of Harmony Currency Based on the Wyckoff Pattern
SIGNOLL
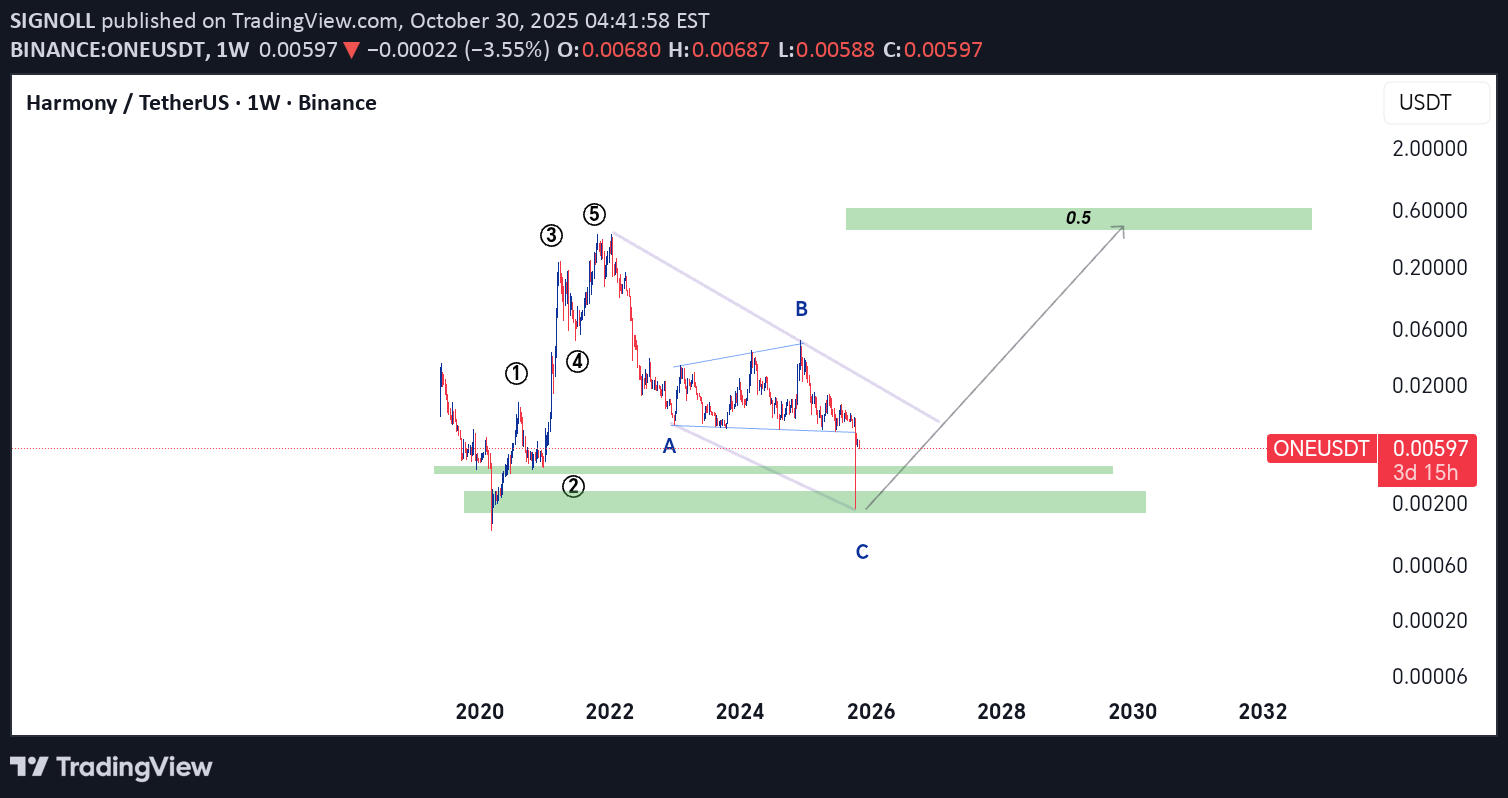
هارمونی (ONE) بعد از اصلاح، آماده پرواز به کجا؟ پیشبینی بزرگ با تحلیل امواج الیوت!

Zorroreny
آیا تاریخ تکرار میشود؟ راز پنهان الگوی صعودی $ONE و هدف ۱۰ دلاری!
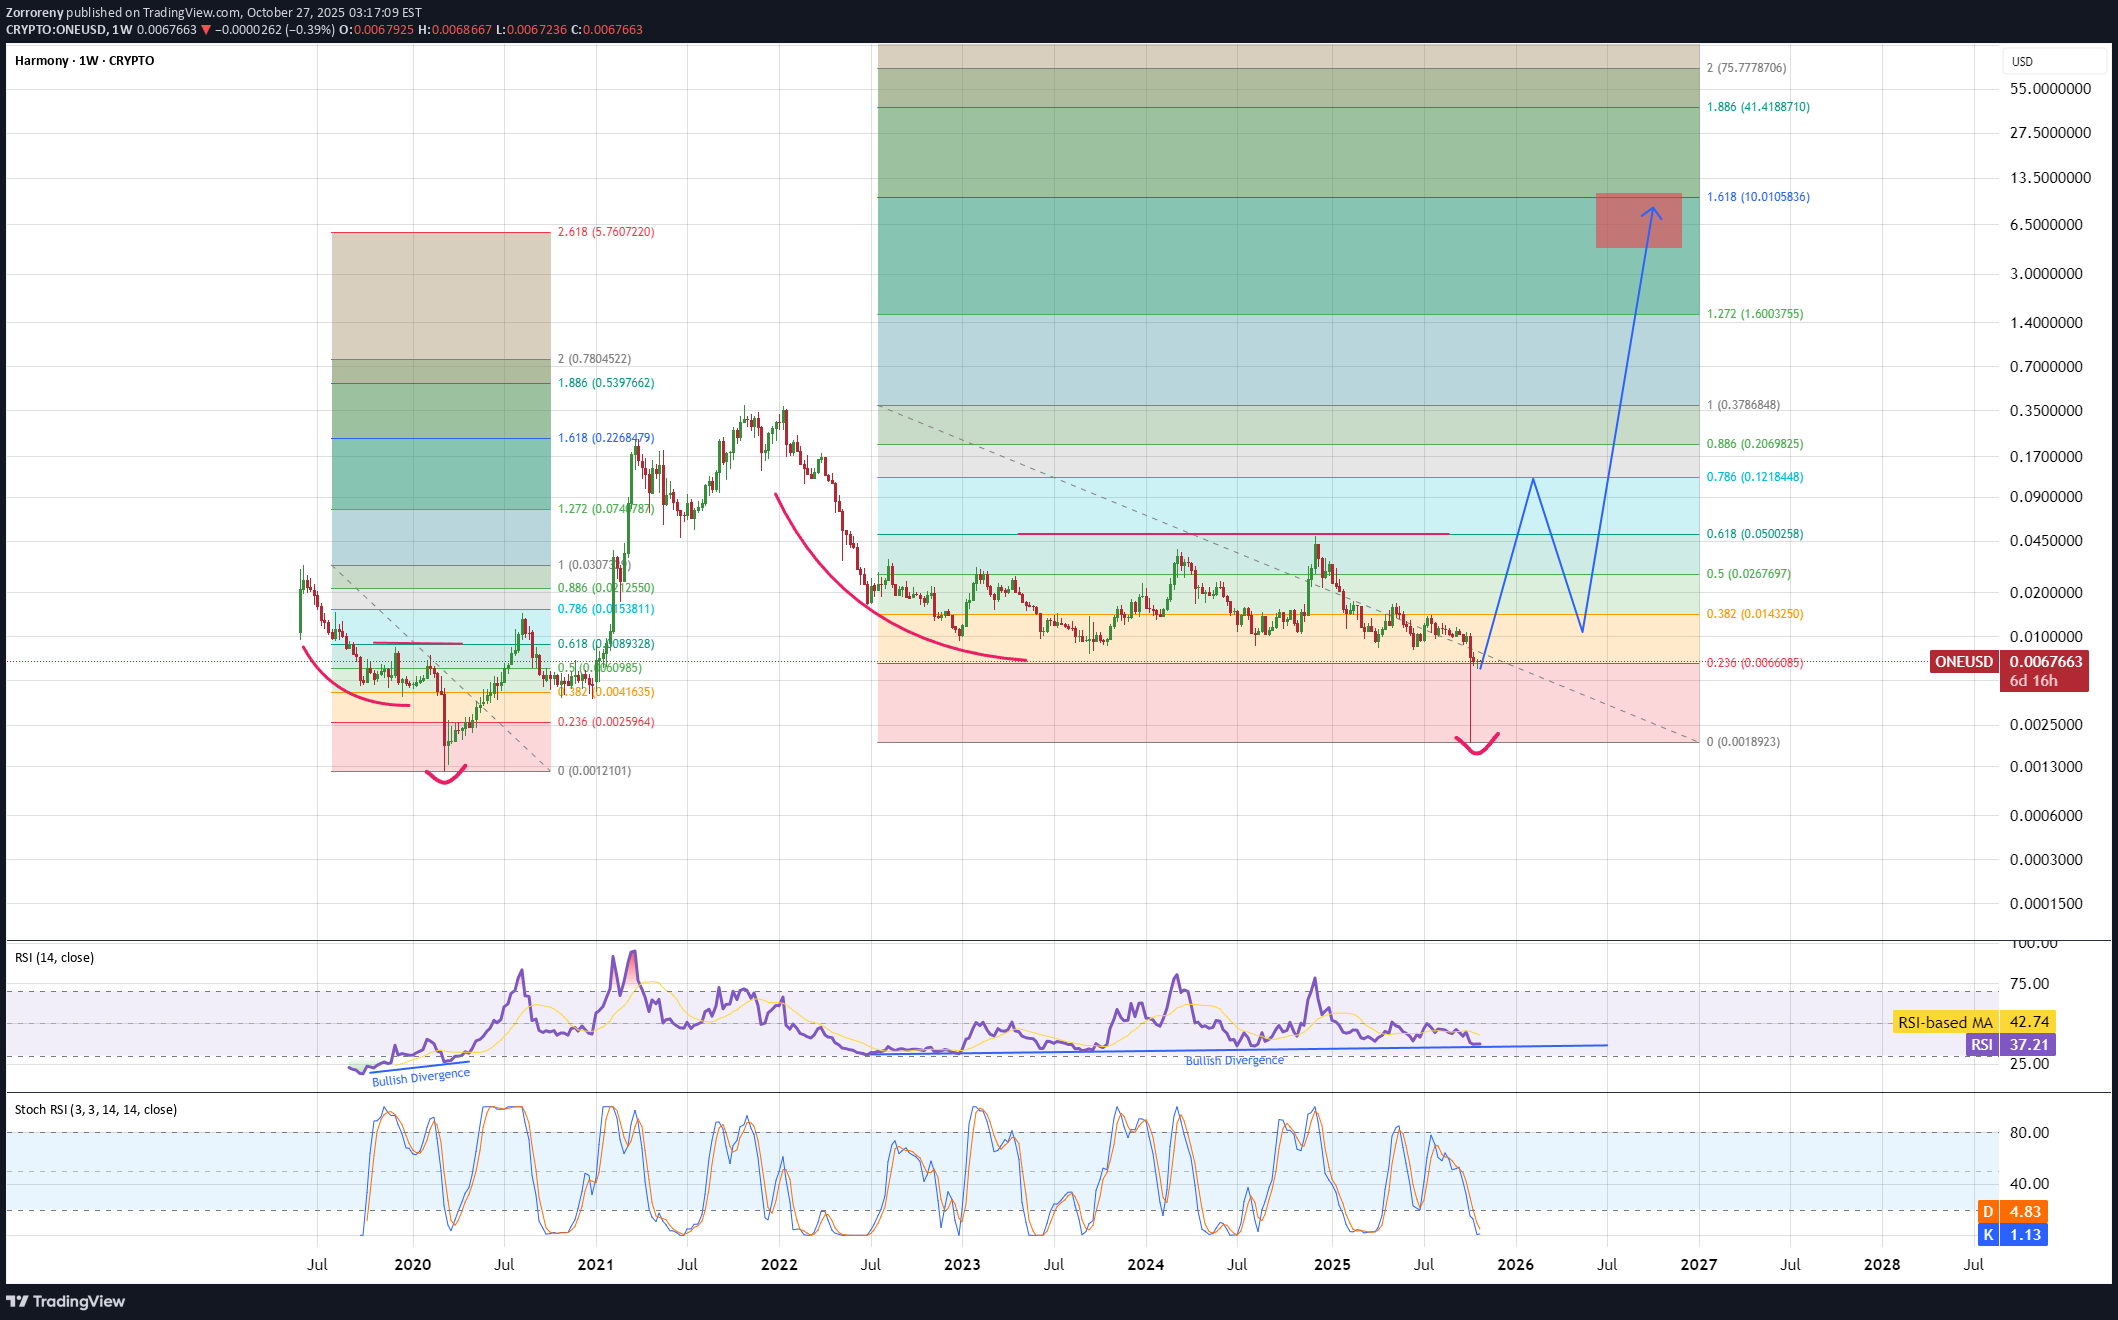
ONE developed exactly same pattern with same fibb levels as in 2020. Just as in 2020 we have now bullish divergence and if history repeats we can now expect push to new ATH with target being 10$ range. 1st conformation of this plan is push to fibb 0.786 range and then correction back to fibb 0.382 to form a higher low.

نمونه فرمولاسیون توبو چیست؟ آیا برای کار شما مناسب است؟
Let's see if the formation study will work as an example.

CryptoAnalystSignal
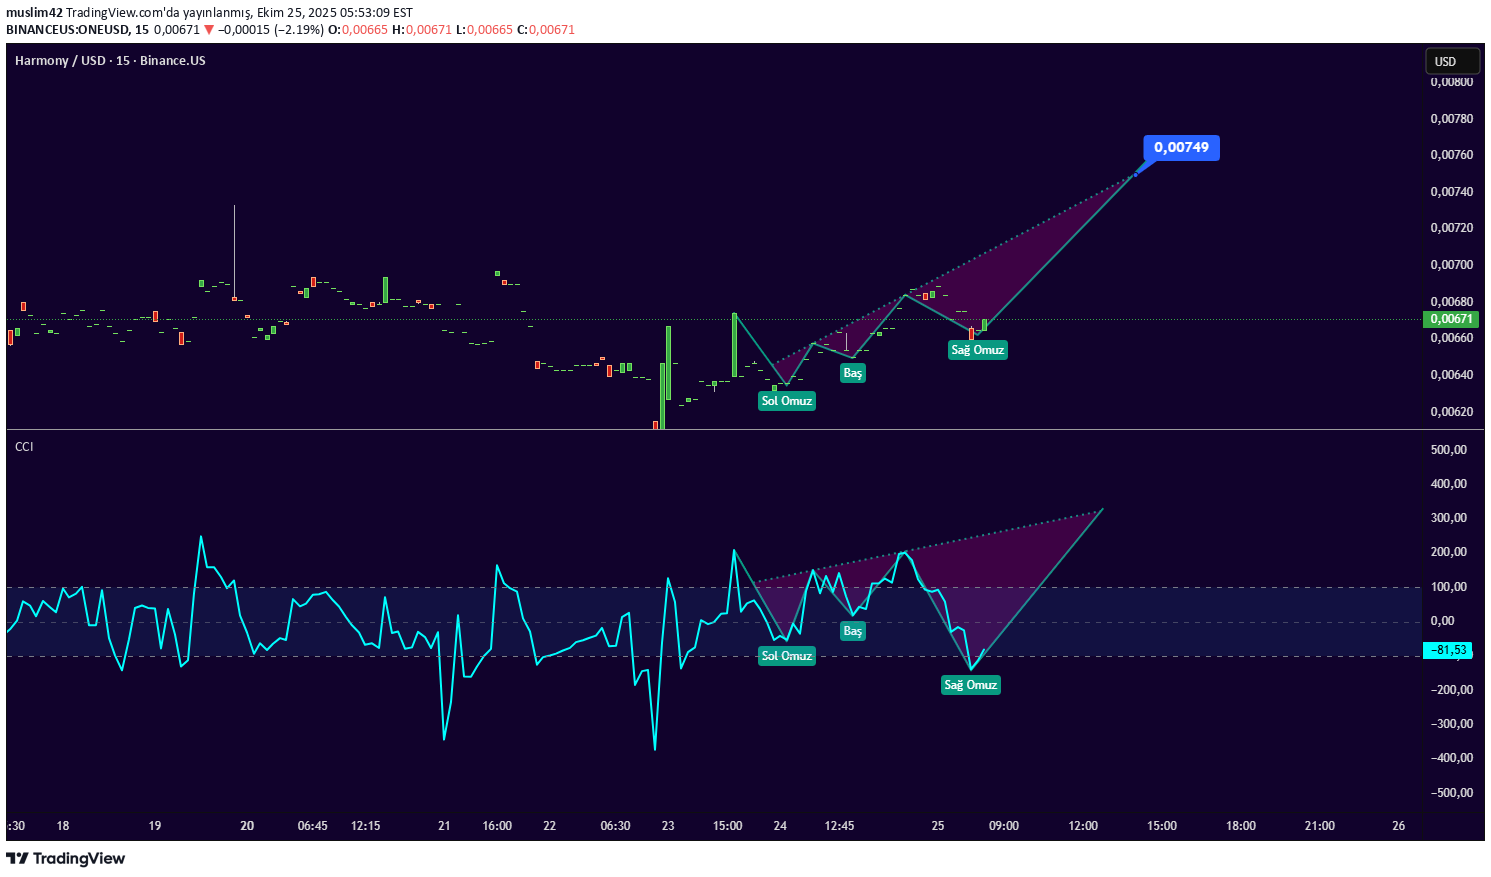
آیا ارز ONE در آستانه بازگشت صعودی است؟ تحلیل دقیق سطوح کلیدی و اهداف قیمتی

#ONE The price is moving within a descending channel on the 1-hour frame, adhering well to it, and is heading for a strong breakout and retest. We have a bearish trend on the RSI indicator that is about to be broken and retested, which supports the upward breakout. There is a major support area in green at 0.00652, representing a strong support point. We are heading for consolidation above the 100 moving average. Entry price: 0.00691 First target: 0.00706 Second target: 0.00721 Third target: 0.00739 Don't forget a simple matter: capital management. When you reach the first target, save some money and then change your stop-loss order to an entry order. For inquiries, please leave a comment. Thank you.

CryptoNuclear
آیا ONE/USDT قبل از بازگشت بزرگ، آخرین کف قیمتی را لمس میکند؟

The weekly chart of ONE/USDT tells the story of a full crypto market cycle: from the euphoric highs of 2021 to a prolonged downtrend that has now brought price back into the historical accumulation zone between 0.0055 – 0.0042 — the same area that preceded ONE’s previous bull run. The breakdown below 0.00915 triggered a wave of panic selling and swept deep liquidity, forming a massive lower wick that pierced the yellow demand zone. Such movements often mark the capitulation phase, where retail traders capitulate and smart money begins accumulating silently beneath the surface. --- Structure & Technical Overview Macro trend: Strong multi-year downtrend with consistent lower highs and lower lows since 2021. Key demand zone: The yellow block (0.0055 – 0.0042) acts as the last major demand zone and potential base for a new market cycle. Candle behavior: The large wick suggests a liquidity grab — a common signal that downside exhaustion may be near if confirmed by a strong weekly close above the zone. Major resistance levels: 0.0130 → 0.01625 → 0.0200 → 0.0240 → 0.0355 — these levels could serve as potential retest or breakout targets if a trend reversal occurs. --- Bullish Scenario Main condition: A weekly close back above 0.00915 would signal a key reclaim and potential structural reversal. Confirmation signals: Rising buy volume and the formation of a higher low above the yellow zone. Upside targets: 1. 0.0130 – first technical rebound level 2. 0.01625 – 0.0200 – mid-range supply zone 3. 0.0355 – macro target if reversal sustains Bullish narrative: “Smart money accumulates when fear dominates. The quiet phase of accumulation might already be underway.” --- Bearish Scenario Bearish confirmation: A weekly close below 0.0042 would confirm a full structural breakdown. Next target: A continuation lower toward the psychological area of 0.0023, entering a deep undervaluation phase. Bearish narrative: “If the yellow zone fails, ONE could enter the final leg of its downcycle — a phase only the most patient investors endure.” --- Strategy & Opportunity Short-term traders: Wait for a confirmed reclaim above 0.00915 before considering long entries. Long-term investors: The 0.0055 – 0.0042 range remains a potential accumulation area — but only with disciplined risk management below support. Core principle: “True reversals are not born from optimism, but from despair.” --- Conclusion ONE stands at a critical multi-year inflection point. The 0.0055 – 0.0042 range represents the final battleground between capitulation and rebirth. If the zone holds and price reclaims 0.00915, a new cycle could begin. If it breaks lower, expect deeper undervaluation before the next accumulation phase forms. The market is testing patience — separating believers from trend followers. --- #ONEUSDT #HarmonyONE #CryptoAnalysis #AltcoinReversal #PriceAction #CryptoCapitulation #MarketCycle #TechnicalAnalysis #CryptoMarket #SupportResistance

satooshi1242
روند انفجاری در راه است: رسیدن به 350٪ تنها با کمی صبر!

As you can see from the chart, two important trendlines are broken and getting ready to hit 350% easily, but a bit of patience is required.

CryptoWithJames
خیز 50 درصدی ONE: سیگنال شکست الگوی گوه نزولی برای سود انفجاری!

#ONE UPDATE ONE Technical Setup Pattern: Bullish falling wedge pattern Current Price: $0.01265 Target Price: $0.01907 Target % Gain: 50.82% ONE is breaking out of a falling wedge pattern on the 1D timeframe. Current price is $0.01265 with a target near $0.01907, showing about 50% potential upside. The breakout confirms bullish momentum with structure favoring continuation. Always use proper risk management. Time Frame: 1D Risk Management Tip: Always use proper risk management.

هارمونی وان: چرا این پروژه undervalued است و پتانسیل صعودی عظیمی دارد؟

Great fundamentals, extremely undervalued project, Dyor

morningishappy
Really want to go to the moon
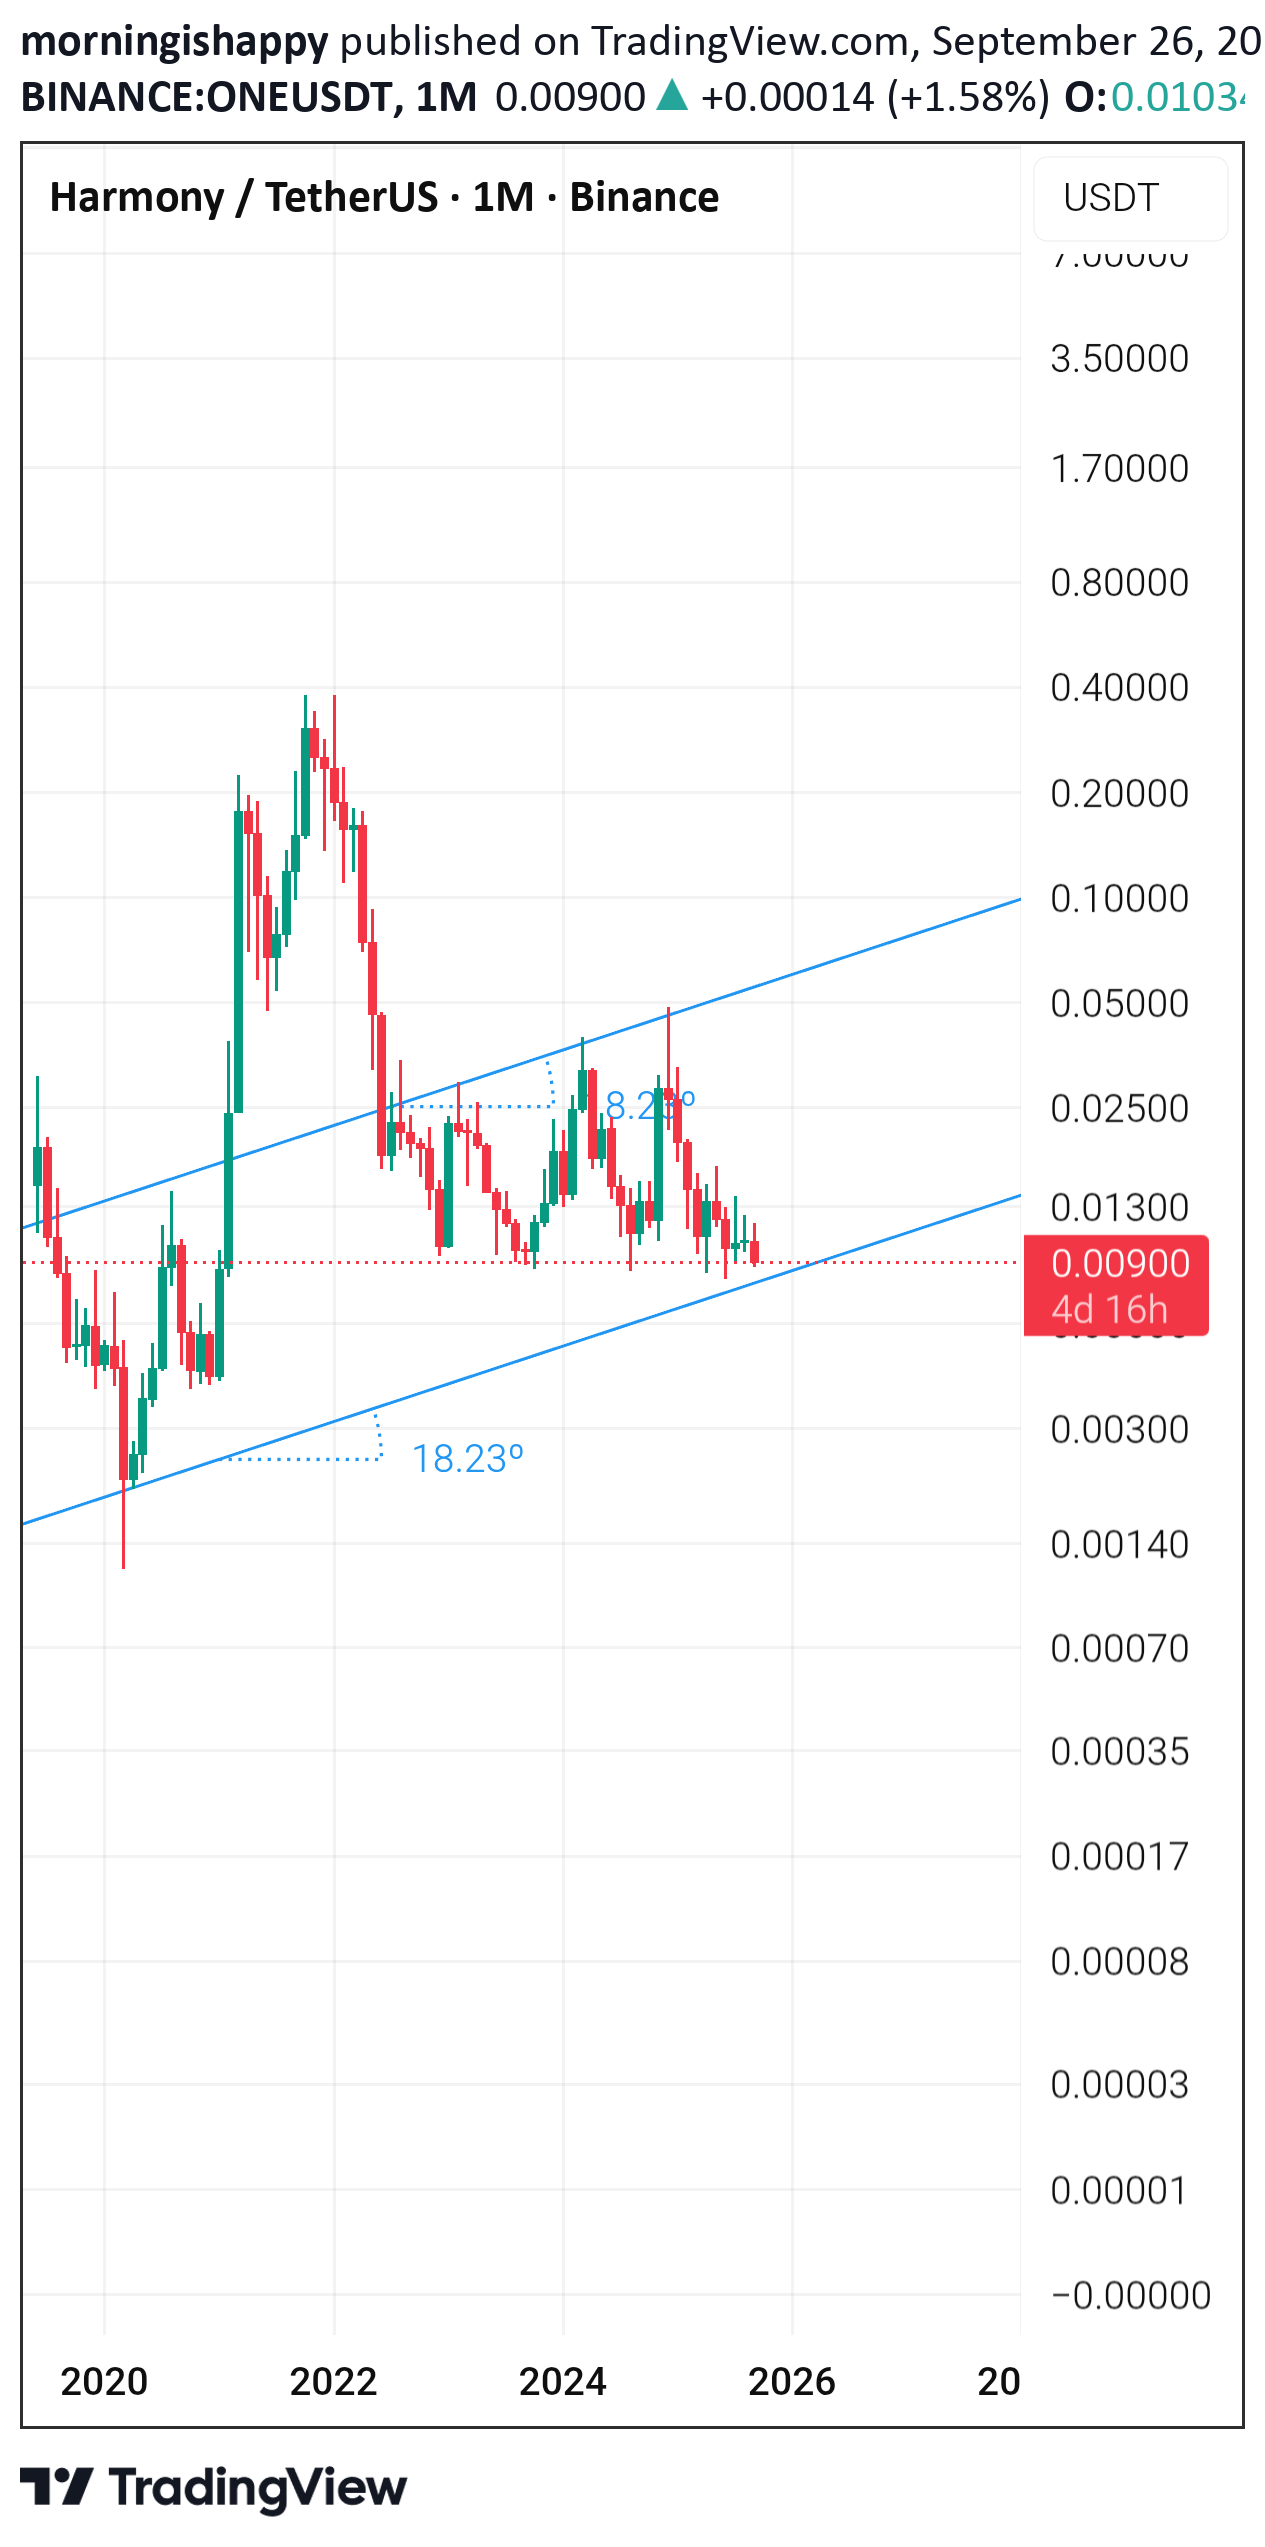
This chart is in monthly timeframe. So you you should be so patient for jumping.
Disclaimer
Any content and materials included in Sahmeto's website and official communication channels are a compilation of personal opinions and analyses and are not binding. They do not constitute any recommendation for buying, selling, entering or exiting the stock market and cryptocurrency market. Also, all news and analyses included in the website and channels are merely republished information from official and unofficial domestic and foreign sources, and it is obvious that users of the said content are responsible for following up and ensuring the authenticity and accuracy of the materials. Therefore, while disclaiming responsibility, it is declared that the responsibility for any decision-making, action, and potential profit and loss in the capital market and cryptocurrency market lies with the trader.