
MTL
Metal
| تریدر | نوع سیگنال | حد سود/ضرر | زمان انتشار | مشاهده پیام |
|---|---|---|---|---|
No results found. | ||||
Price Chart of Metal
سود 3 Months :
سیگنالهای Metal
Filter
Sort messages by
Trader Type
Time Frame

Bithereum_io
MTLUSDT 12H
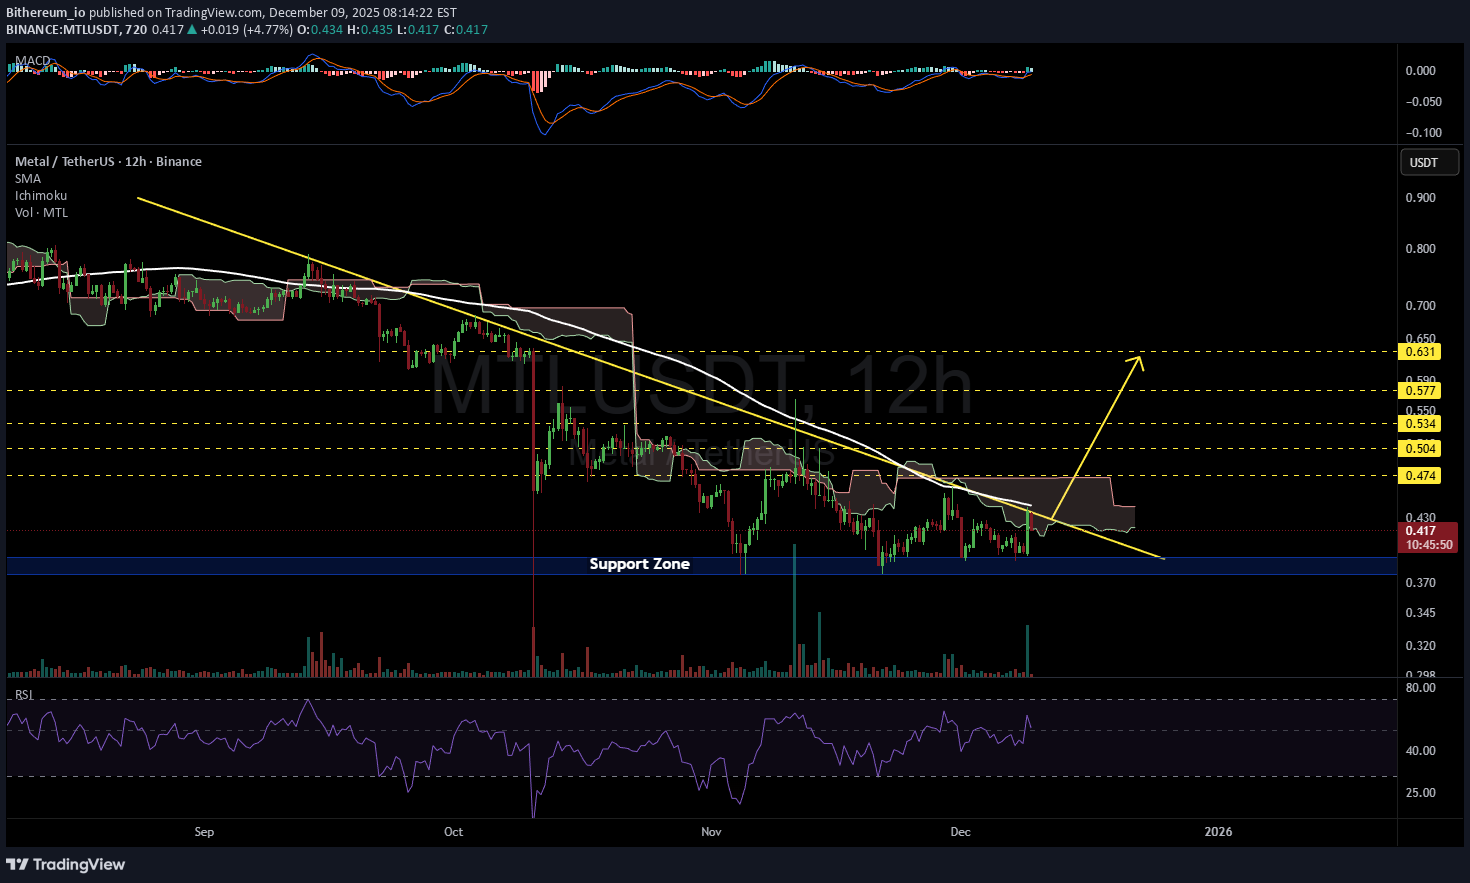
Keep an eye on the #MTL 12H timeframe chart. It has bounced off the support and entered the Ichimoku cloud, and it was rejected from the descending resistance and the SMA100. However, considering the volume and the fact that it is still inside the Ichimoku cloud, we can expect it to break the descending resistance soon. If that happens, the potential targets are: 🎯 $0.474 🎯 $0.504 🎯 $0.534 🎯 $0.577 🎯 $0.631 ⚠️ Always remember to use a tight stop-loss and maintain proper risk management.

gohani140
آیا فصل ریزش ارز تمام شده؟ راز بازار صعودی آینده!
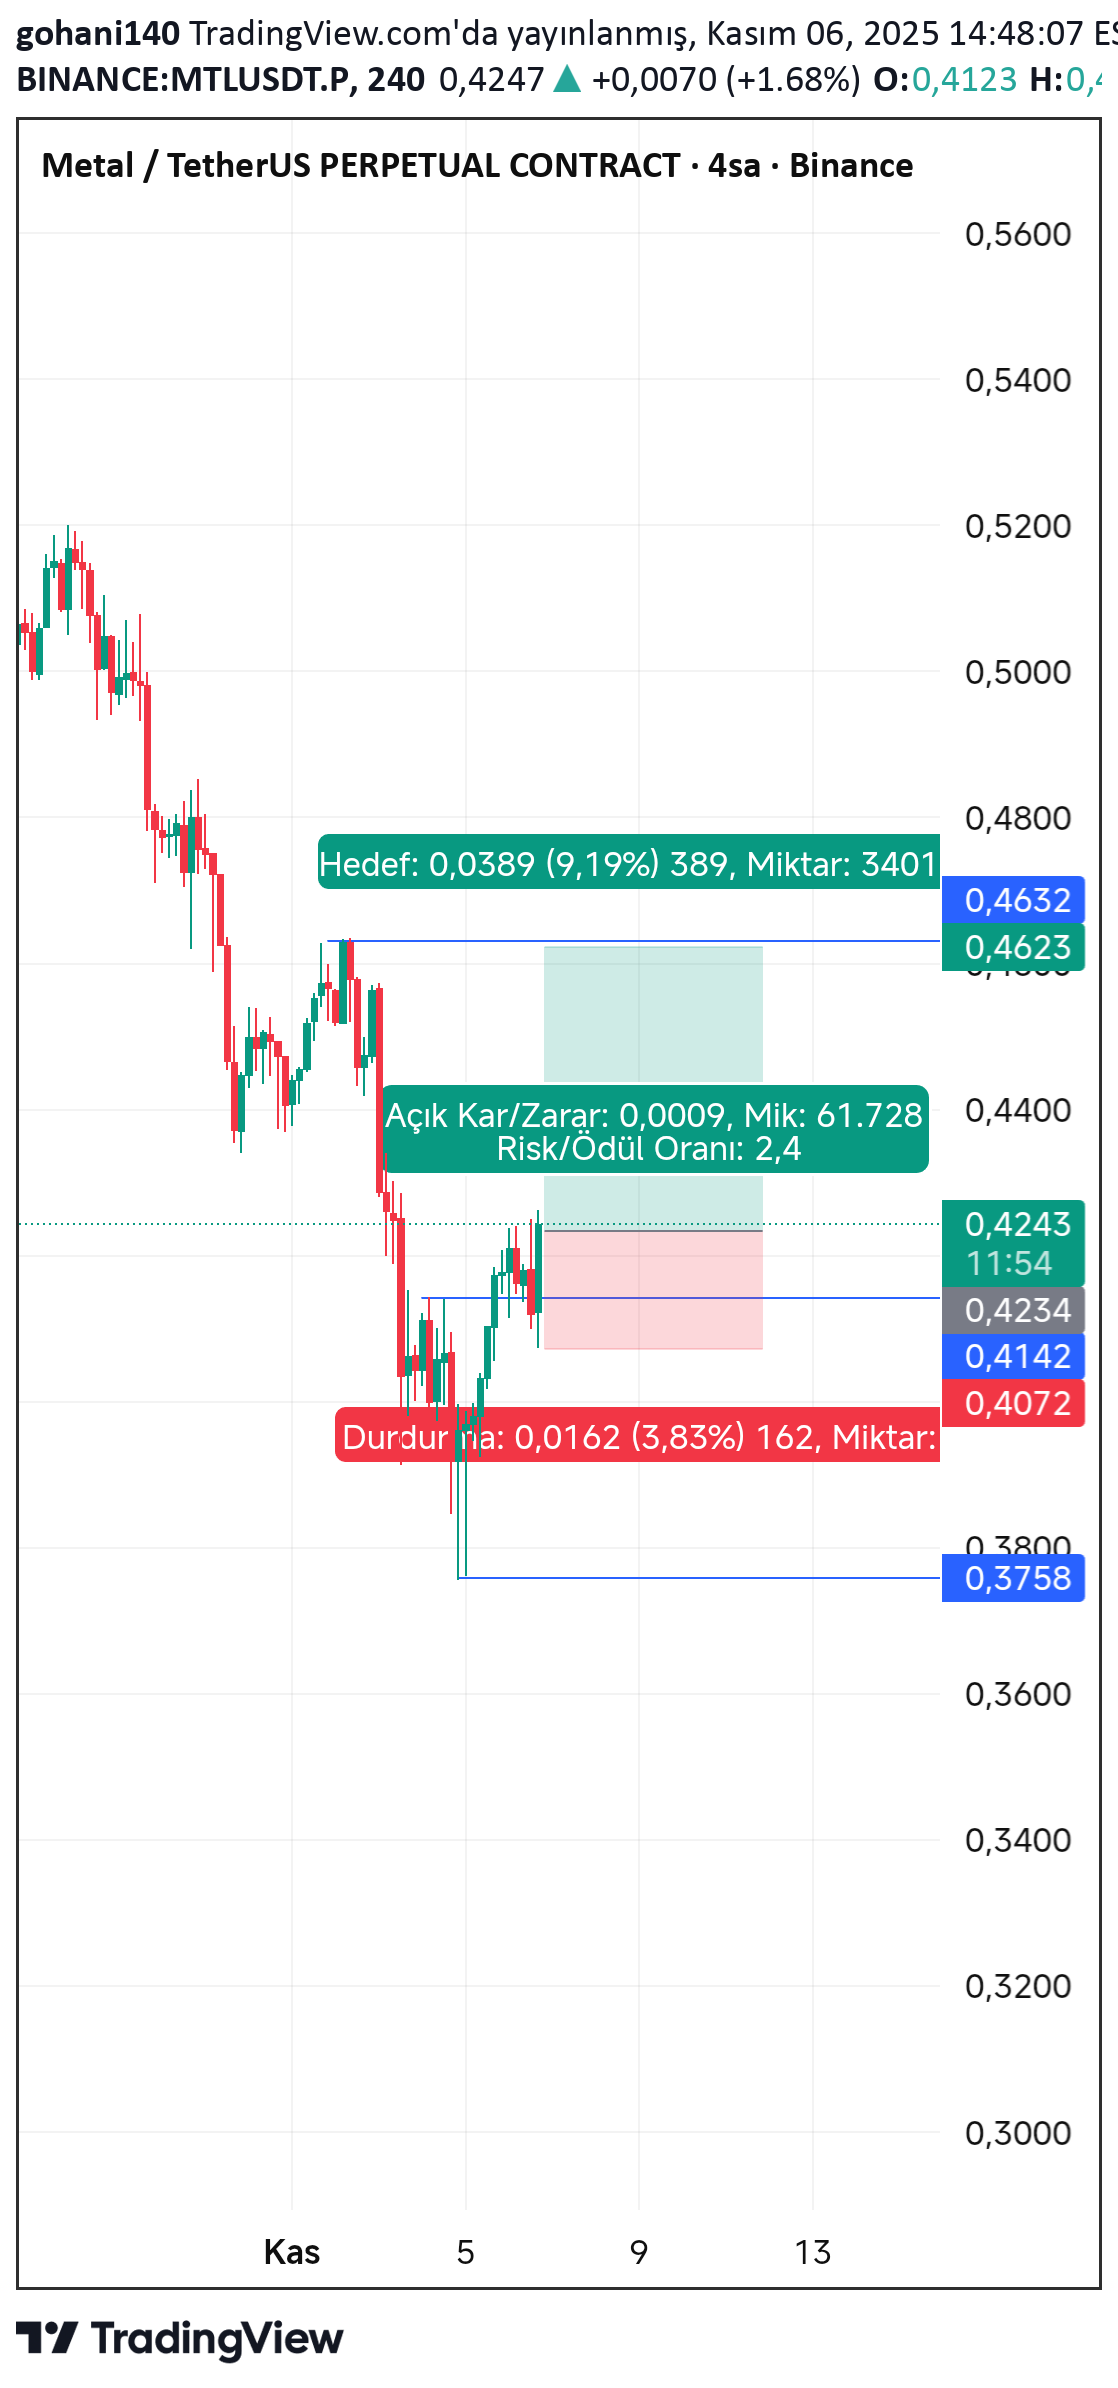
What is this bear season? It's not over yet. It's a scary dream. You have to be careful.

Kapitalist01
تحلیل تکنیکال لحظهای: آیا قیمت در آستانه انفجار است؟ (بدون توصیه سرمایهگذاری)
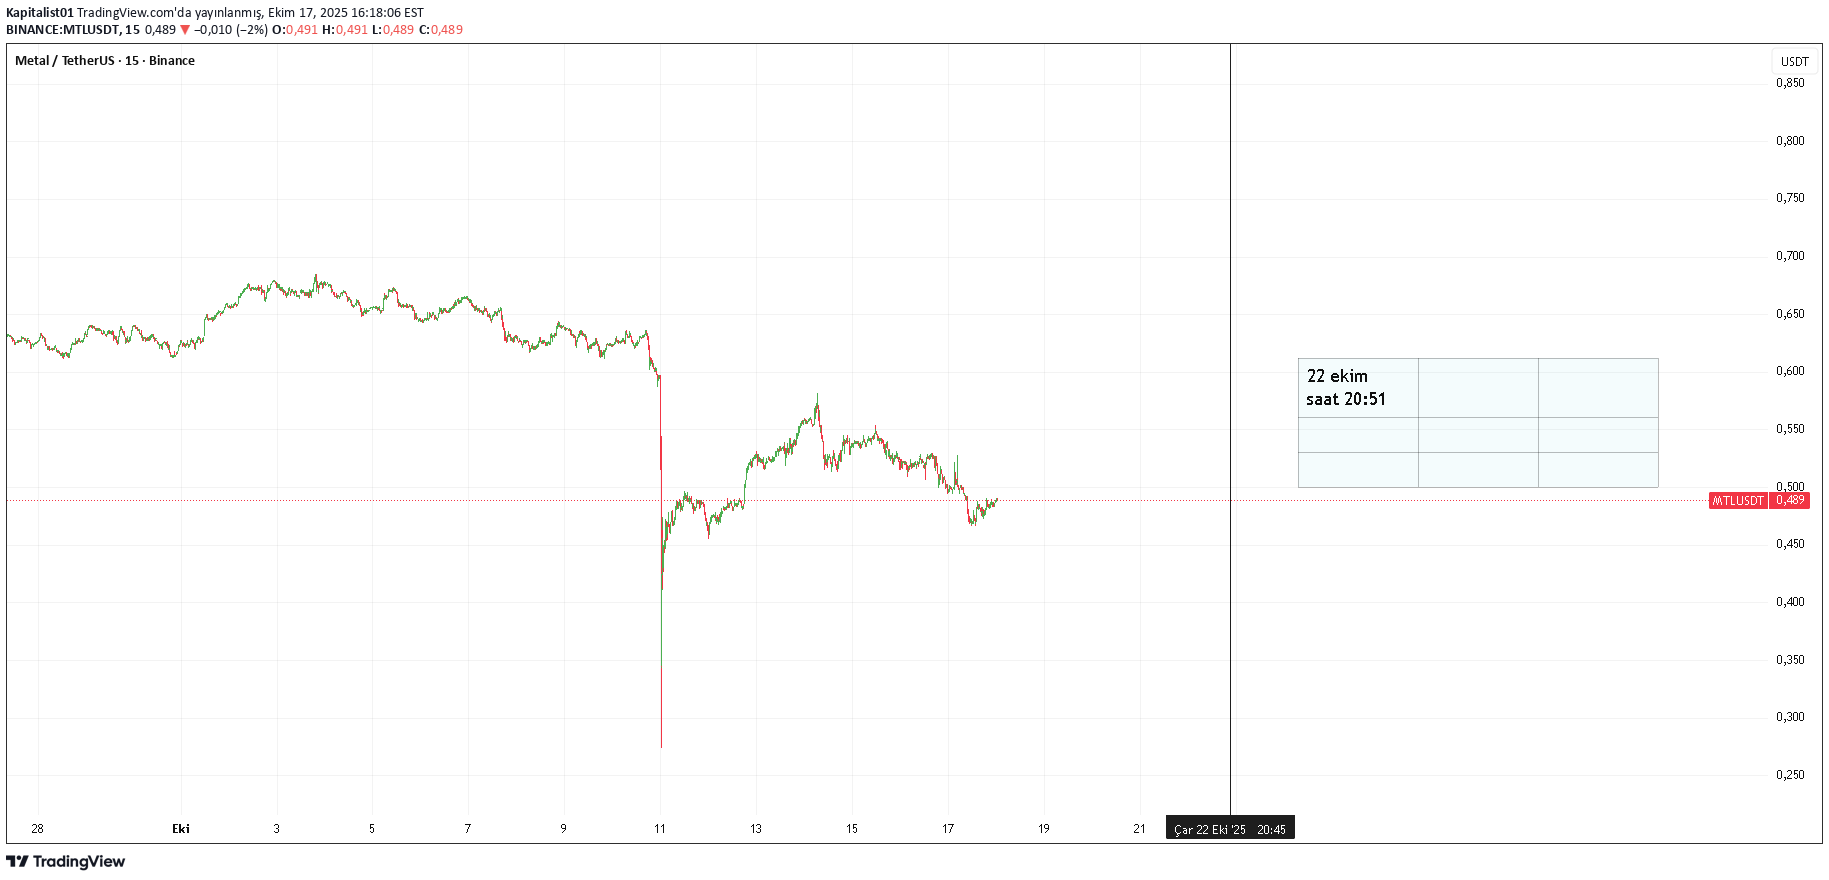
If it moves crookedly and does not liquidate, there is momentum. It is not investment advice

CryptoAnalystSignal
#MTL/USDT
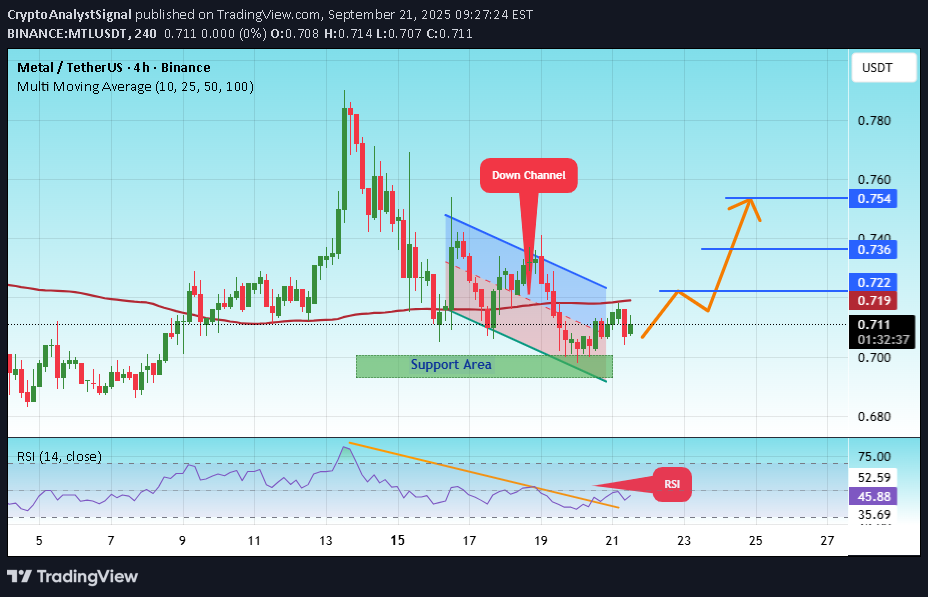
#MTL The price is moving within a descending channel on the 1-hour frame, adhering well to it, and is heading for a strong breakout and retest. We have a bearish trend on the RSI indicator that is about to be broken and retested, which supports the upward breakout. There is a major support area in green at 0.700, representing a strong support point. We are heading for consolidation above the 100 moving average. Entry price: 0.711 First target: 0.722 Second target: 0.736 Third target: 0.754 Don't forget a simple matter: capital management. When you reach the first target, save some money and then change your stop-loss order to an entry order. For inquiries, please leave a comment. Thank you.

leytonrobinsn
MTL/USDT long position
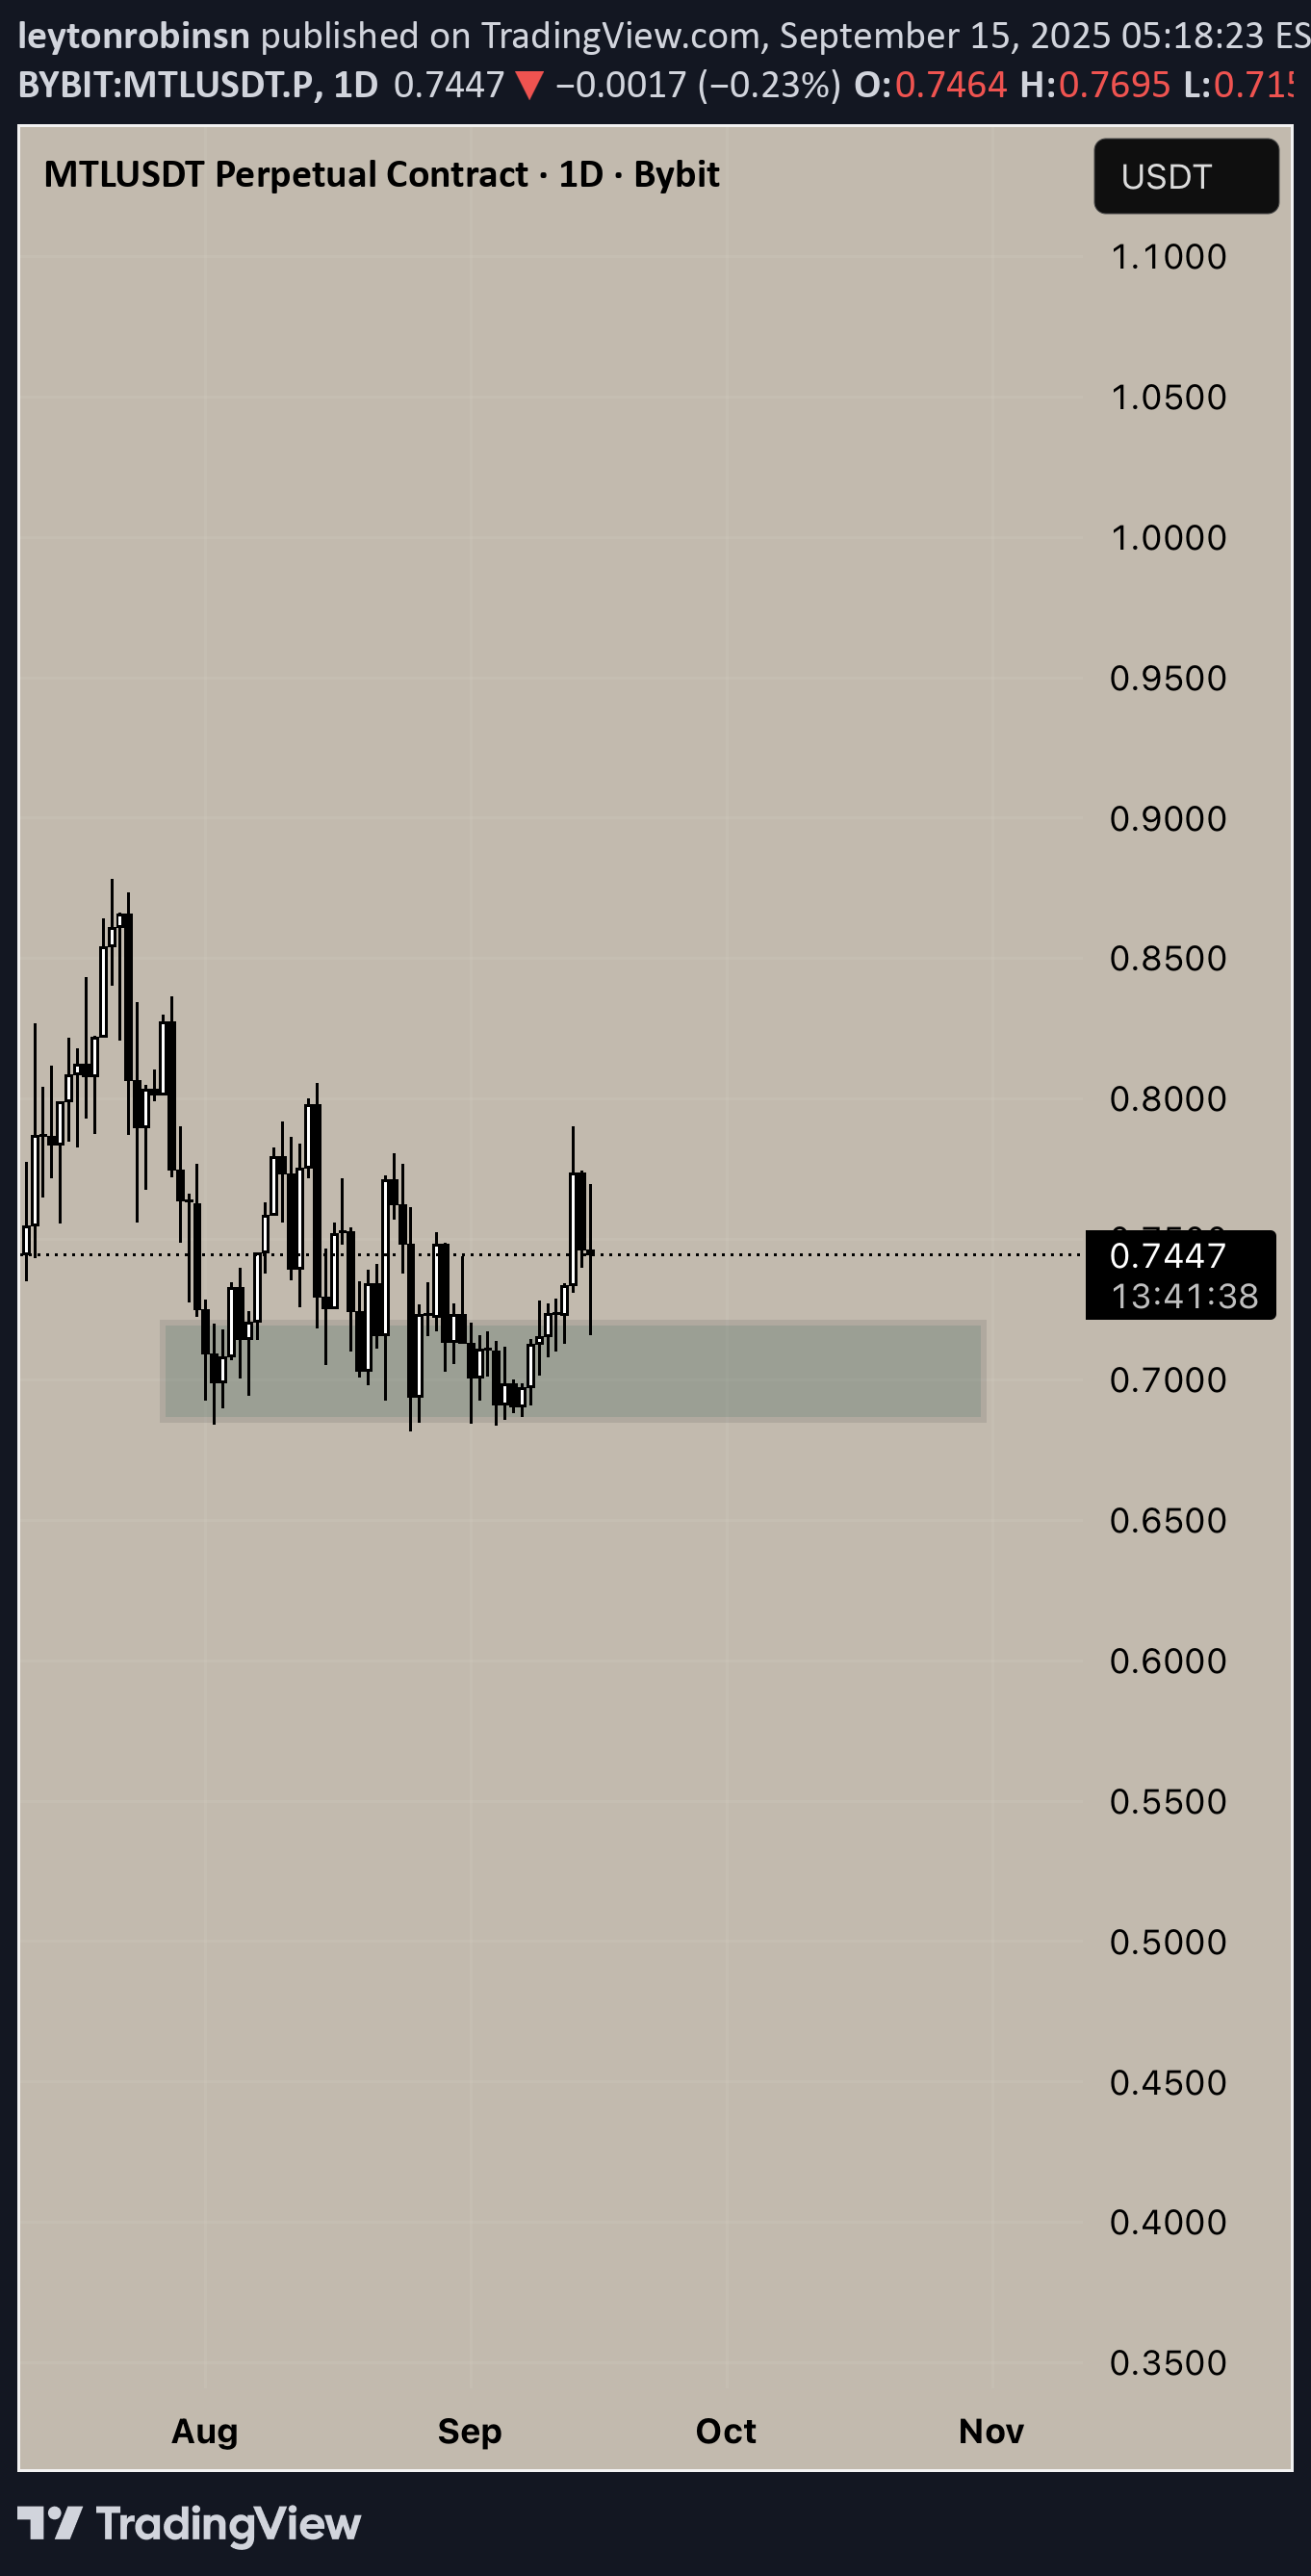
This appears to be a strong support zone for this token. We have seen multiple bounces and are currently displaying late rejection wicks on the daily chart. Setting an entry here will be the best strategy for a long position.

CryptoNuclear
MTLUSDT — Support Accumulation, Preparing for the Next Big Move?
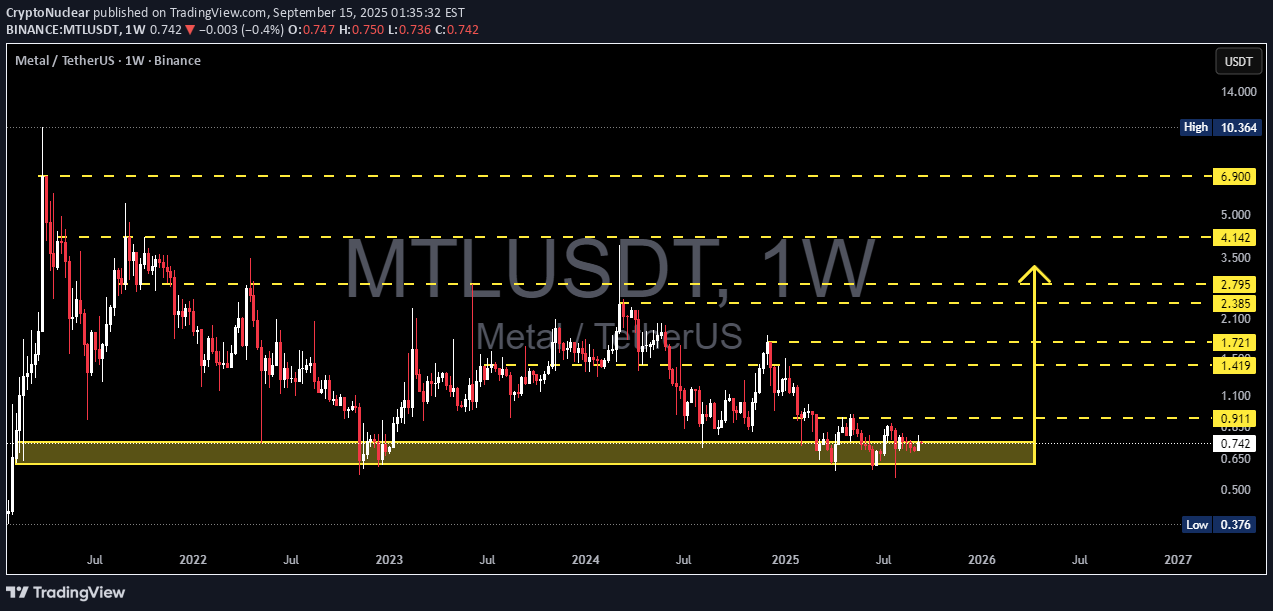
📝 Full Technical Analysis & Narrative MTL/USDT has come a long way. From the all-time high at $10.36, price has retraced into the multi-year support zone at $0.65 – $0.75, where it has been consolidating sideways for a prolonged period. The yellow box on the chart highlights a key demand zone that has been tested multiple times since 2022. Each time the market dipped into this range, buyers stepped in aggressively. This suggests that participants view this zone as “undervalued territory” for MTL. On the flip side, sellers remain strong — every bounce has been capped by layered resistances at $0.911 → $1.42 → $1.72 → $2.38 → $2.79 → $4.14 → $6.90. These levels form the walls that must be broken to confirm a long-term trend reversal. The current price structure can be described as a flat accumulation range, often a foundation for the next major breakout or breakdown move. --- 🚀 Bullish Scenario Trigger: Weekly close above $0.911 would confirm the first breakout signal. Upside Targets: Initial: $1.42 → $1.72 (first major resistance cluster). Next: $2.38 → $2.79 (historical supply zone). Extended targets if a broader altcoin rally kicks in: $4.14 → $6.90 → $10.36. Catalysts: Stronger altcoin market cycle. Increasing accumulation volume at the support base. Strategy: Accumulate gradually within the $0.65–$0.75 zone and add confirmation entries once $0.911 is reclaimed on a weekly close. --- ⚠️ Bearish Scenario Trigger: Weekly close below $0.65. Implication: Breakdown of the long-standing accumulation structure → opens the path towards $0.376 (historical low). If this fails, new all-time lows could form. Risk: Loss of demand strength, sellers regain full control. Strategy: Avoid long exposure below $0.65. Possible short setups only if breakdown is confirmed with volume. --- 📌 Technical Structure Range Accumulation: Price has been trapped between $0.65 and $0.911 for more than a year. Multi-touch support: Several long wicks bouncing from support → strong buyer interest. Decreasing volatility: Tight consolidation range → usually a precursor to a big breakout move. Key Insight: As long as $0.65 holds, upside potential remains intact. --- 🎯 Trading Plan Summary Bullish case: Accumulate at support, confirmation entry above $0.911 → targets $1.42 / $1.72 / $2.79. Bearish case: Breakdown below $0.65 → target $0.376 or lower. Risk management: Conservative stop-loss below support; risk max 1–2% per trade. Scale out profits at each resistance. MTL is in a “calm before the storm” phase. Short-term traders may exploit the range, while long-term investors wait for a decisive breakout to confirm a potential trend reversal. --- #MTLUSDT #MetalToken #CryptoAnalysis #AltcoinOpportunities #TechnicalAnalysis #SupportResistance #AccumulationZone #BreakoutOrBreakdown #CryptoTrading
Bithereum_io
MTLUSDT 1D
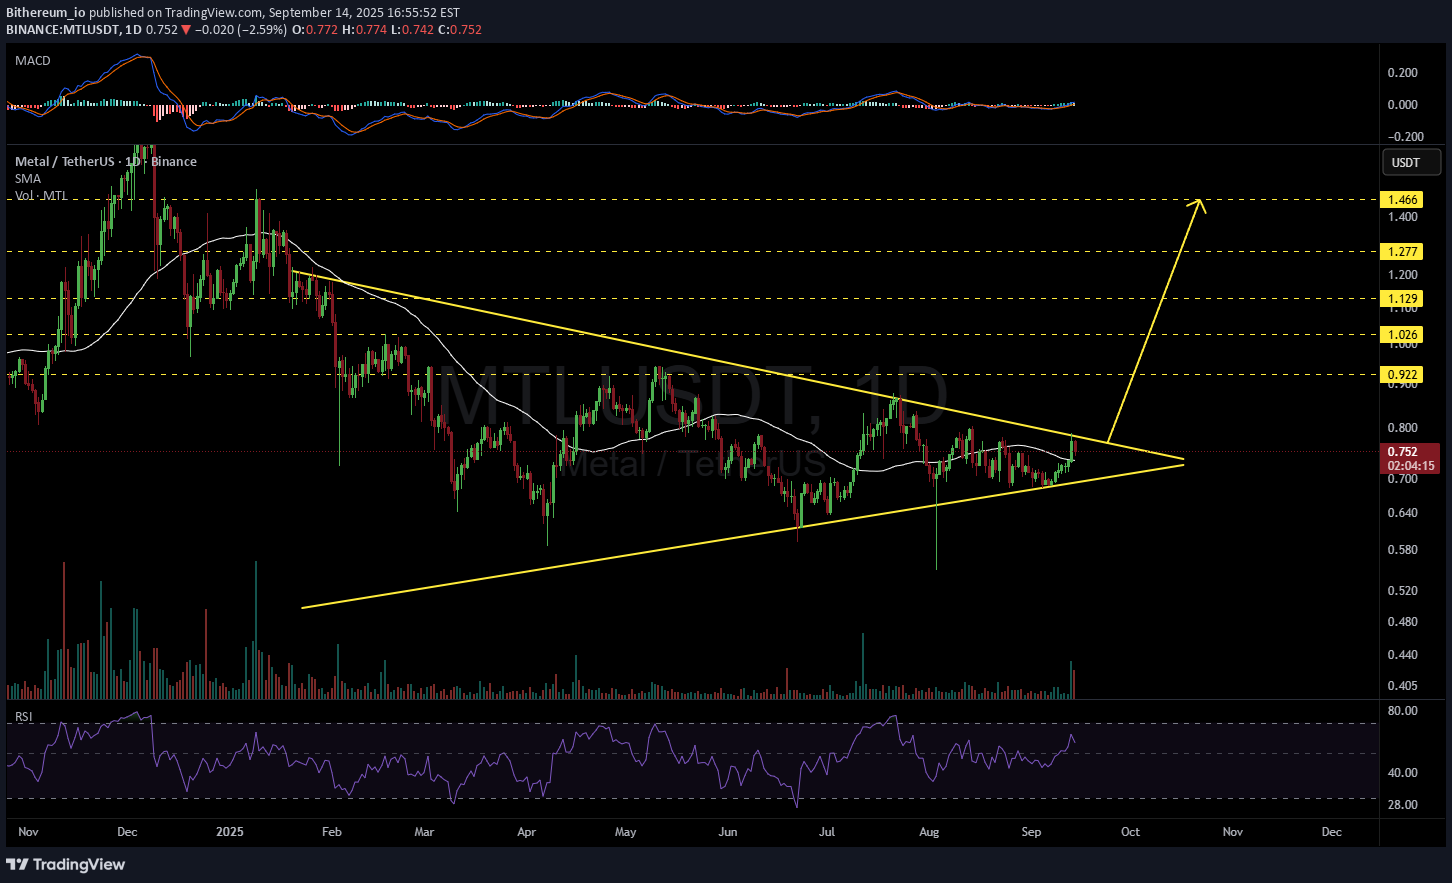
#MTL is moving within a symmetrical triangle on the daily timeframe. If it breaks out above the triangle resistance, the targets are: 🎯 $0.922 🎯 $1.026 🎯 $1.129 🎯 $1.277 🎯 $1.466 ⚠️ Always remember to use a tight stop-loss and follow proper risk management.

HPotter
Good moment for try to Buy MTL


behdark
MTL Rebuy Setup – Perfect Entry Ahead! (3D)

MTL (Metal DAO) is currently developing within Wave C of a classic diametric pattern, based on Elliott Wave theory. This structure suggests a high-probability corrective phase that typically leads to sudden and sharp movements before a potential reversal.As of now, MTL has not yet reached the identified green buy zone, but price action is approaching it. This zone has been highlighted by analysts as a major area of interest for a potential rebuy scenario once touched, based on market structure and historical behavior.Importantly, the setup includes a clearly defined invalidation level. If the price closes a daily candle below this invalidation level, the current wave count would no longer be valid, and traders should reassess the market outlook.Until this invalidation occurs, the current count remains intact, and market participants may monitor the ongoing price action for potential bullish continuation after Wave C completes.For risk management, please don't forget stop loss and capital managementComment if you have any questionsThank You

aet61
MTLUSDT // Cup handle formation

Although there is a cup-handle formation on the chart, the targets are determined according to Fibonacci. As a formation condition, we need closings above 0.804.
Disclaimer
Any content and materials included in Sahmeto's website and official communication channels are a compilation of personal opinions and analyses and are not binding. They do not constitute any recommendation for buying, selling, entering or exiting the stock market and cryptocurrency market. Also, all news and analyses included in the website and channels are merely republished information from official and unofficial domestic and foreign sources, and it is obvious that users of the said content are responsible for following up and ensuring the authenticity and accuracy of the materials. Therefore, while disclaiming responsibility, it is declared that the responsibility for any decision-making, action, and potential profit and loss in the capital market and cryptocurrency market lies with the trader.