
MOVE
Movement
| تریدر | نوع سیگنال | حد سود/ضرر | زمان انتشار | مشاهده پیام |
|---|---|---|---|---|
No results found. | ||||
Price Chart of Movement
سود 3 Months :
سیگنالهای Movement
Filter
Sort messages by
Trader Type
Time Frame

CryptoNuclear
MOVEUSDT — Descending Triangle Critical: Breakout or Breakdown?
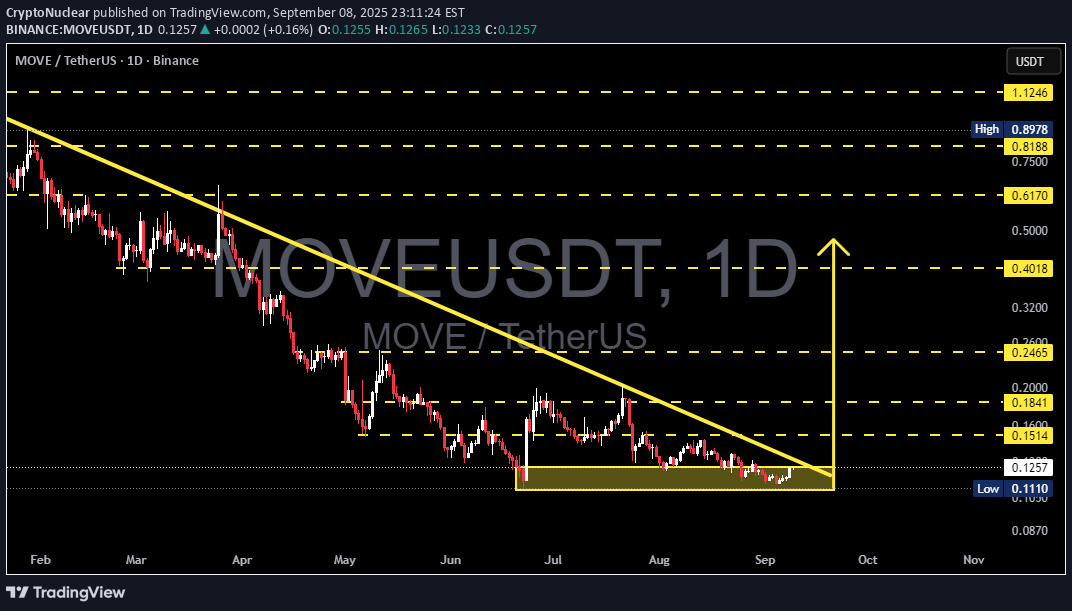
📊 Chart Analysis The MOVE/USDT daily chart is currently forming a clear Descending Triangle pattern. This structure is defined by: A downward sloping resistance trendline (yellow) that has been pressing the price lower since the beginning of the year. A horizontal support zone (yellow box) around 0.105 – 0.125 USDT, acting as the last stronghold for buyers. This pattern signals that the market is in a compression phase. Price has repeatedly failed to break above the descending trendline, while support has also been tested multiple times but still holds. This indicates we are entering a make-or-break moment for MOVE. --- 🔼 Bullish Scenario If price manages to break above the descending trendline with a strong daily close and rising volume, this could be a potential reversal signal. First confirmation level: Breakout above 0.1514. Upside targets: TP1: 0.1514 (+20%) TP2: 0.1841 (+46%) TP3: 0.2465 (+96%) With sustained momentum, a mid-term target could extend to 0.4018 or higher. The bullish case would be further supported by signs of bullish divergence on RSI or MACD. --- 🔽 Bearish Scenario On the other hand, if price fails to hold the 0.105 – 0.125 support zone and closes daily below this area with increased volume, strong selling pressure could drive further downside. Bearish targets: 0.087 (−31%) 0.075 (−40%) 0.050 (−60%) A confirmed breakdown from a descending triangle within a downtrend often signals a strong continuation to the downside. --- 📌 Pattern & Implications Descending Triangle is typically a bearish continuation pattern, though false breakouts to the upside are not uncommon in crypto markets. The current support zone is the critical decision level that will determine the next major move. Traders should wait for a confirmed breakout or breakdown before committing, in order to avoid bull traps or bear traps. --- ⚖️ Conclusion MOVE/USDT is standing at a critical decision point. Bullish bias if daily close above the trendline and 0.1514 with strong volume → upside potential to 0.1841 / 0.2465. Bearish bias if daily close below 0.105 → downside targets at 0.087 / 0.075. This is a make-or-break moment, and confirmation from price action and volume will be crucial before entering a position. --- #MOVE #MOVEUSDT #Crypto #TechnicalAnalysis #DescendingTriangle #SupportResistance #Breakout #BearishScenario #BullishScenario #DYOR

abuzer0234
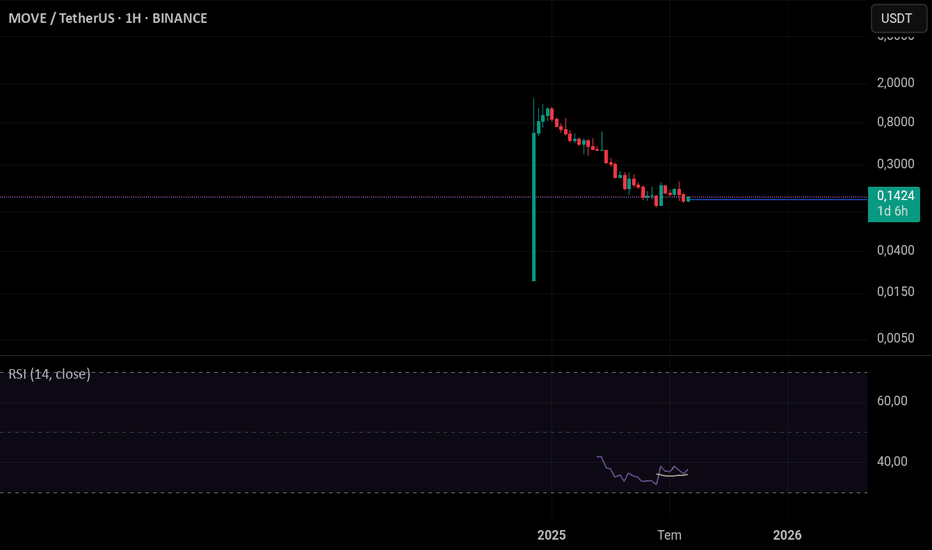
Sabreden 60x alır.
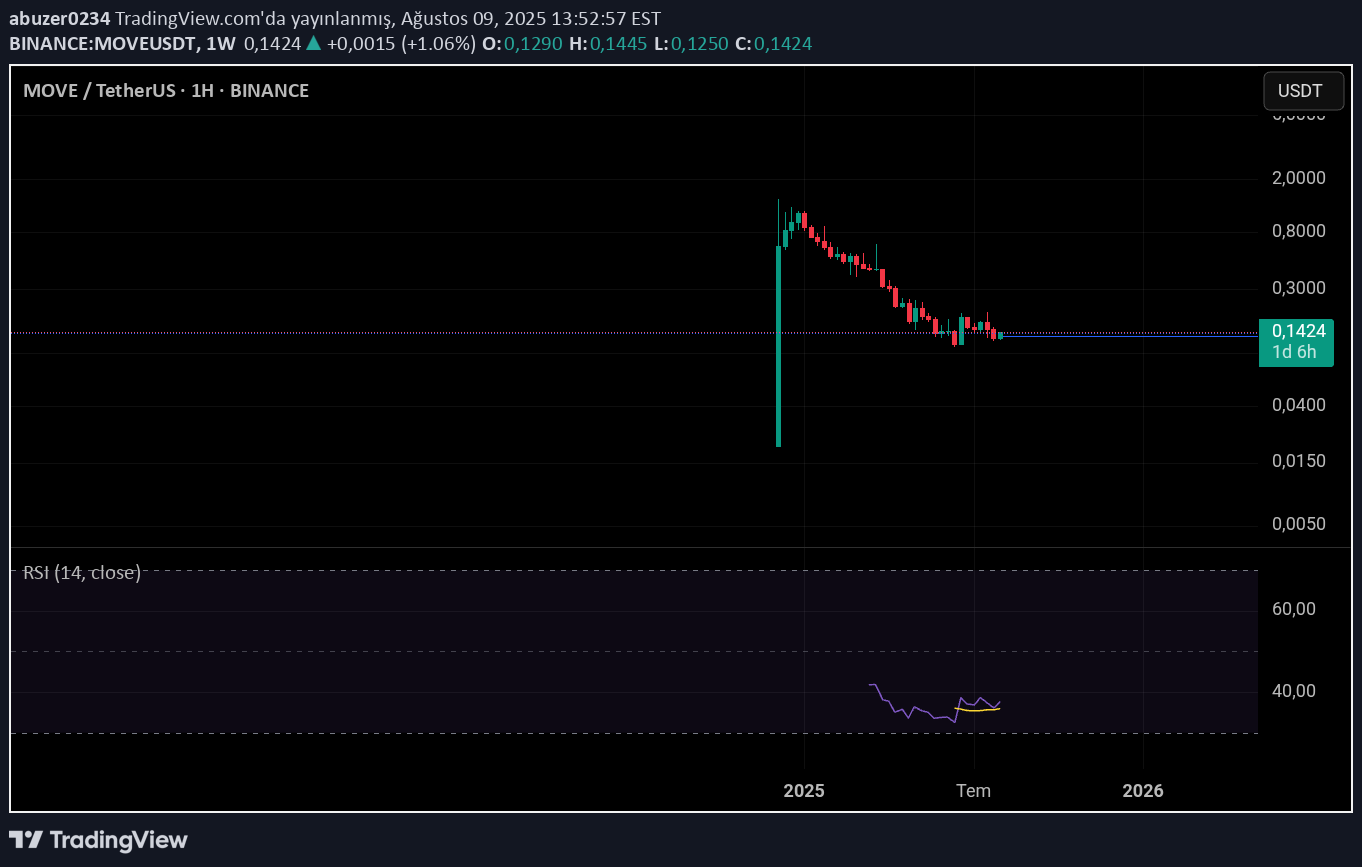
My target of 8 dollars will come in the bull season, but it is necessary to be patient ... YTD.
abuzer0234
Sabreden 60x alır.
My target of 8 dollars will come in the bull season, but it is necessary to be patient ... YTD.

سیگنال آلفا کریپتو
⚜️ $ Move/USDT 🛒 Purchase range: 0.180 - 0.196 ⚡️ Target: 🎯t1: 0.22 🎯T2: 0.25 🎯t3: 0.28 🎯T4: 0.32 🎯t5: 0.38 🎯t6: 0.48 🔺 Limit limit: 0.16 💵 Suggested Balance: 5 % Capital 🔥 @signal_alpha 🔥

aydinalperen019
#moveusdt

Türkçe: Likidite temizlenmesi ve boğa yapısının onayı sonrası, destek bölgesinden tepki bekleniyor. English: After liquidity sweep and bullish confirmation, a bounce from support is expected.

Joky39
Move | Long
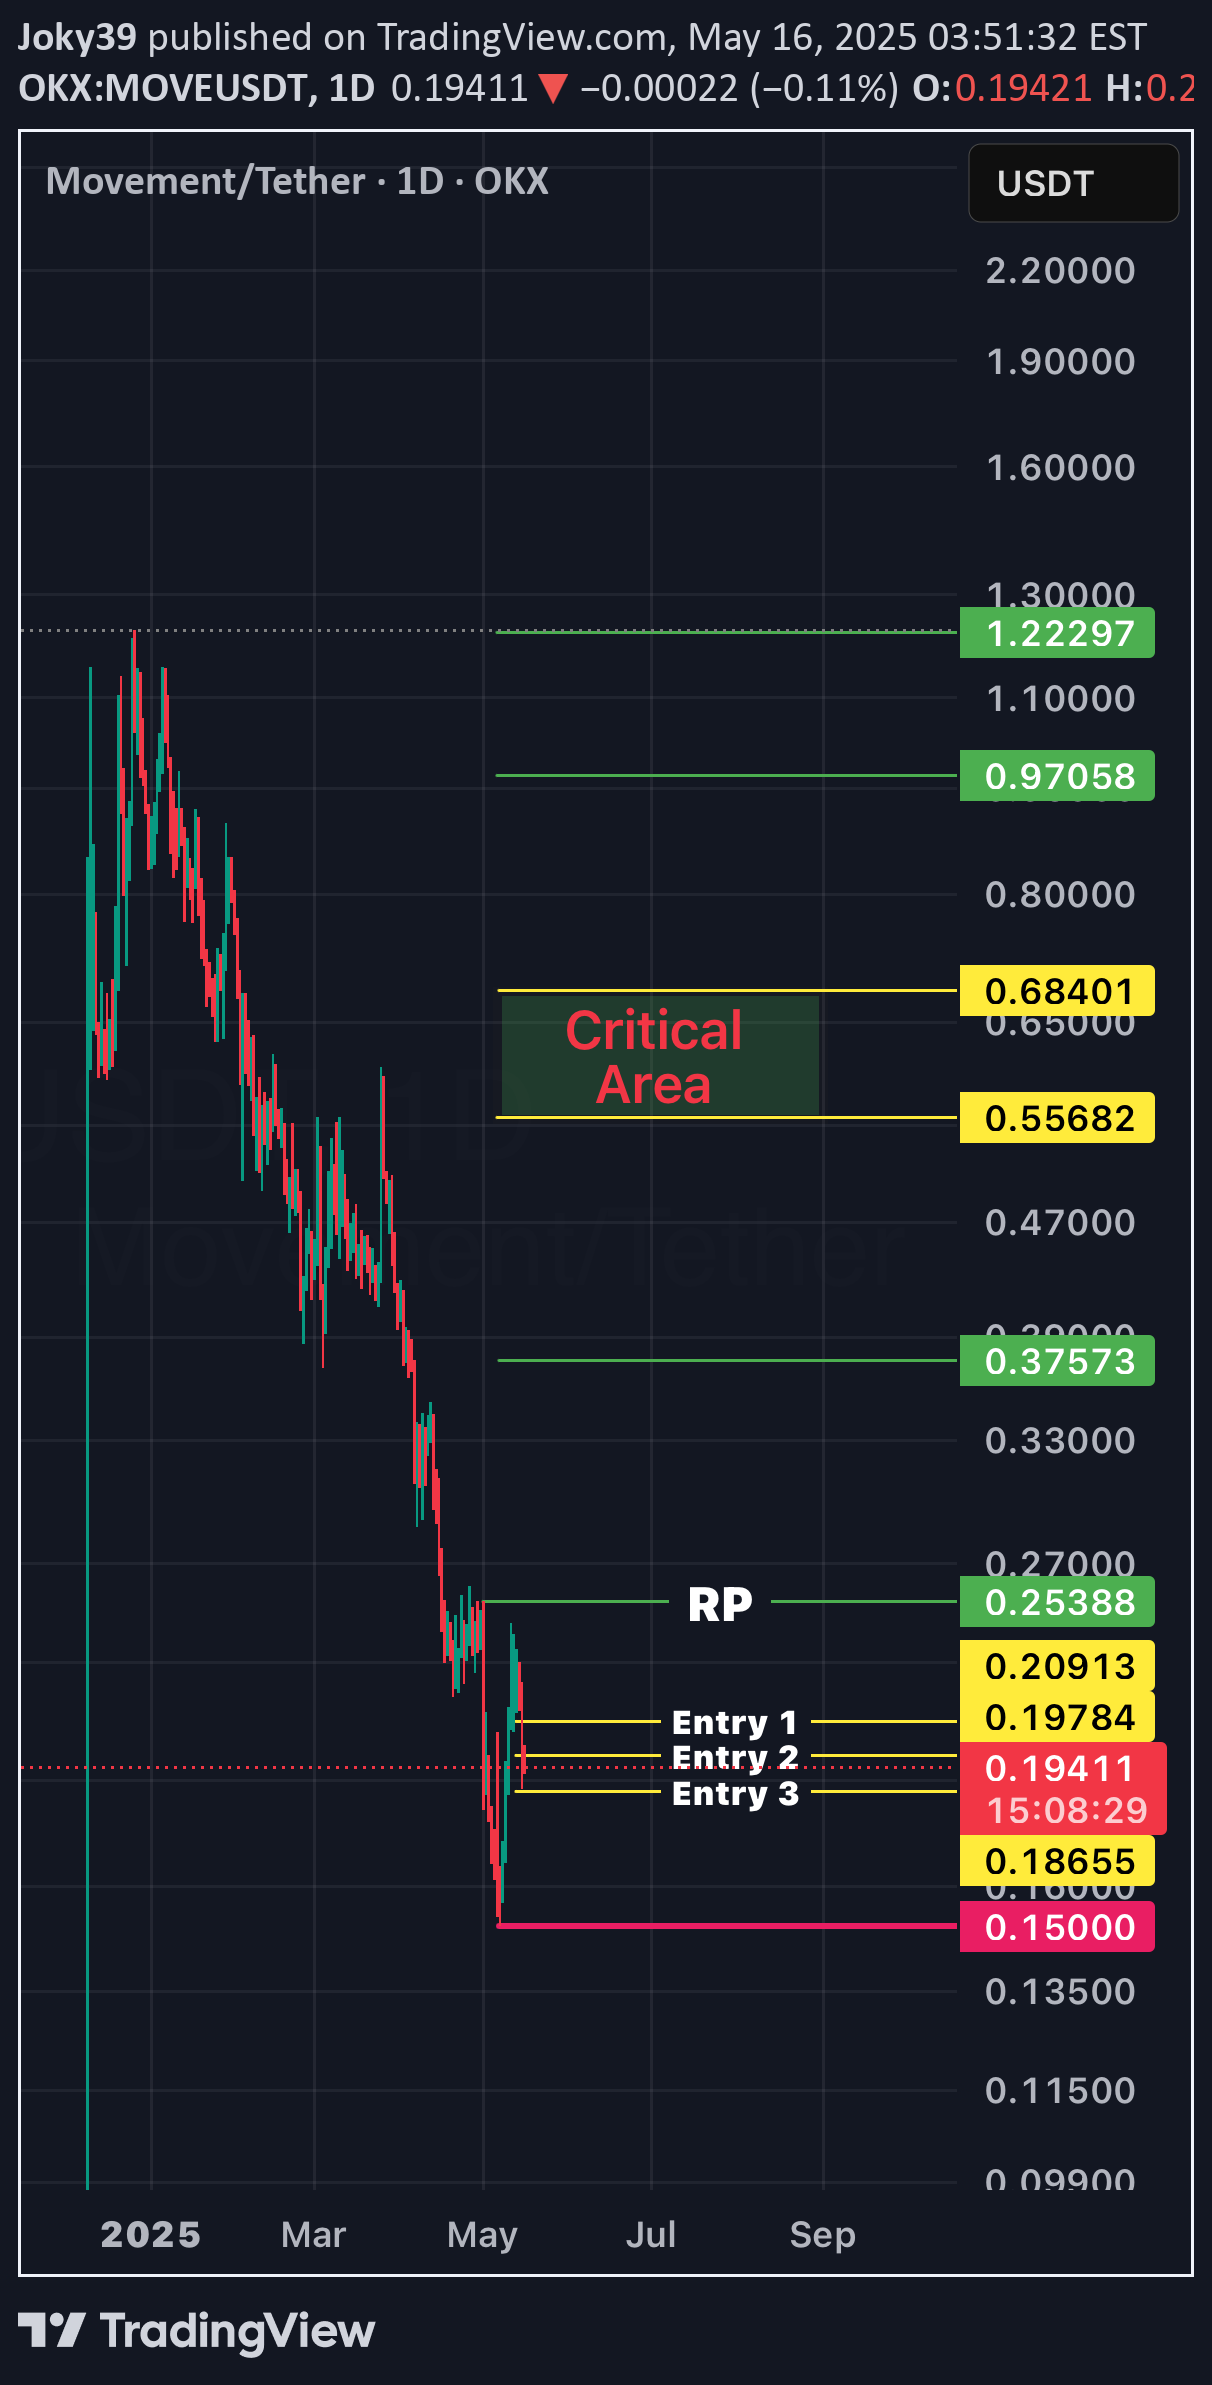
MOVE remains bullish. Entry 1 and Entry 2 have already been triggered, and Entry 3 is close to being activated. If Entry 3 is triggered, we could potentially see a parabolic bounce from this level, as it aligns with the 0.618 Fibonacci retracement—a key zone for strong reversals.
Joky39
Long Signal
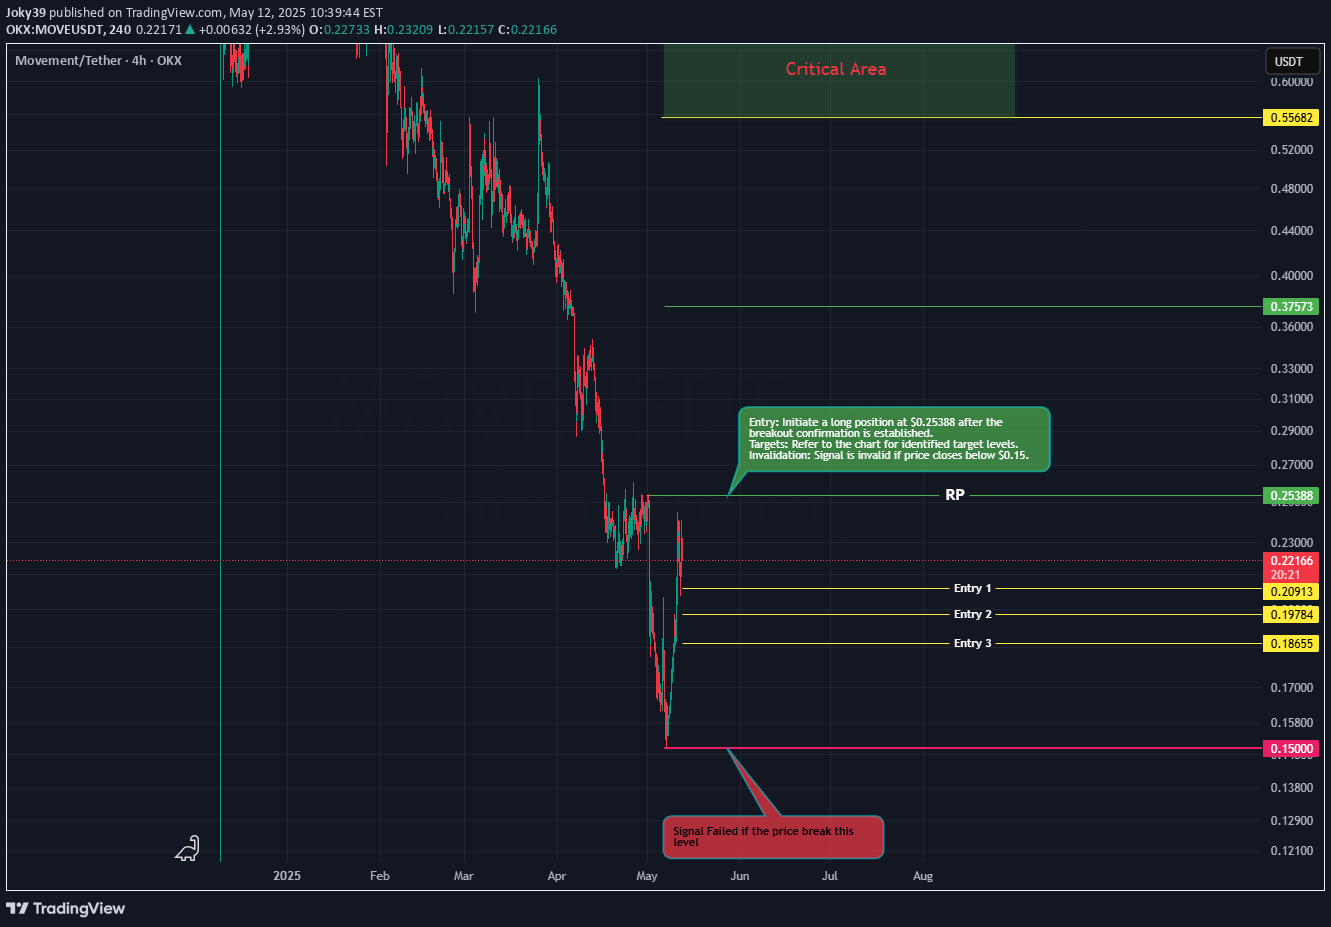
Entry: Initiate a long position at $0.25388 after the breakout confirmation is established. Targets: Refer to the chart for identified target levels. Invalidation: Signal is invalid if price closes below $0.15.

RP_cryptotrader
MOVE hughe FW breakout incomming?
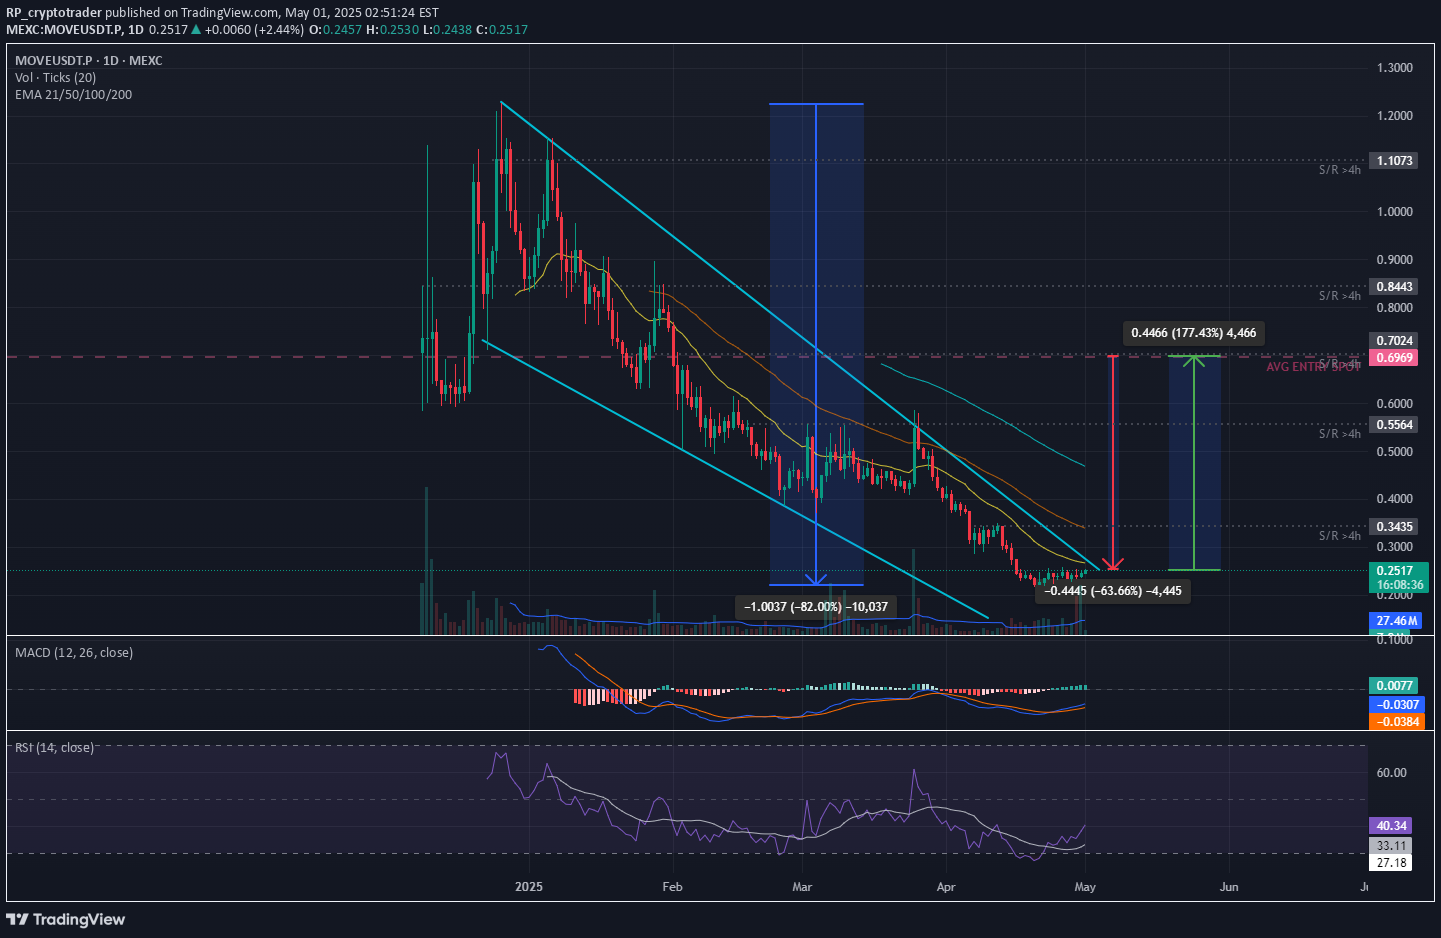
MOVE has been dropping over 80% from it's ATH. This looks like bearmarket scenario's. But as I did mention before in other posts. This bull cycle is different and especially for ALTCOINS. The massive growth in number of ALTS makes it hard to stand out and gain momentum. The money and social attention is widely spread over milions of coins now. The 1875 active accounts holding MOVE is reasonable for a relative new project jet it doesn't signal mass adoption. MOVE is a Layer1 / 2 and ZK coin in the smart contracts. It's also in the World Liberty Financial portfoilio and made in the USA. These fundamentals are bullisch for MOVE. A breakout from the FW pattern could make it take off at rocket pace towards the former highs. Allong the way we can see and identify several major S/R line that have to be broken first. Indicators: The rounded bottom / consolidation could mark the bottom. Stoch indicator: The STOCH shows signs of recovery Golden Cross: The short term MA has been crossing the Long term MA signaling recovery. Volume: The low volume is typical for the consolidation. CONSOLIDATION above support and below resistance The level where we find MOVE right now looks like consolidation and bottom possibility. With support at 0,218 a small resistance at 0,34 and a major resistance at 0,56. My trading plan for now: I will open a new bigger SPOT position in order to lower my AVG ENTRY that has lost over 60% in the last months. A run up from this level to the S/R level 0,56 means a 177% profit.

SarperPro
MOVEUSDT
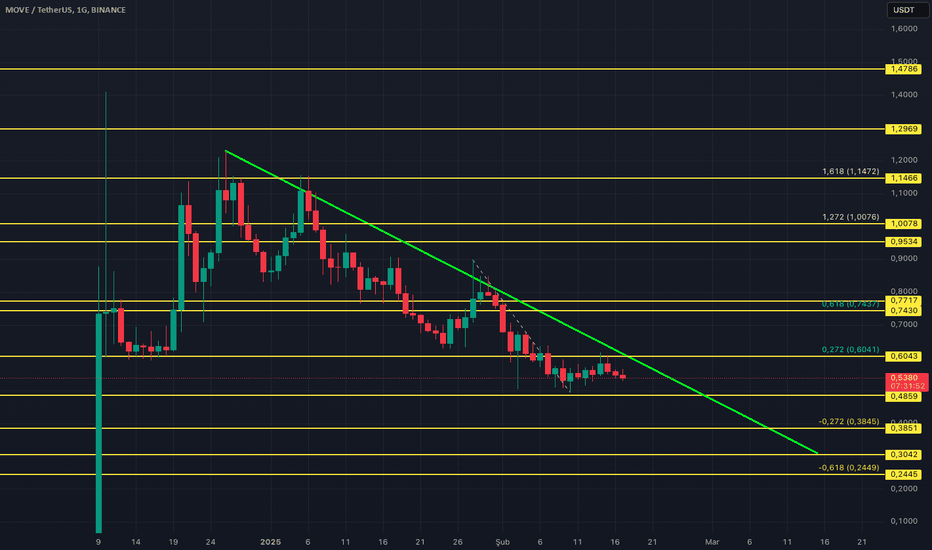
You can follow the Moveusdt graph. It can make a larger leap from 0.49. It is my own opinion, not investment advice

sedatsonmez07
move shortum
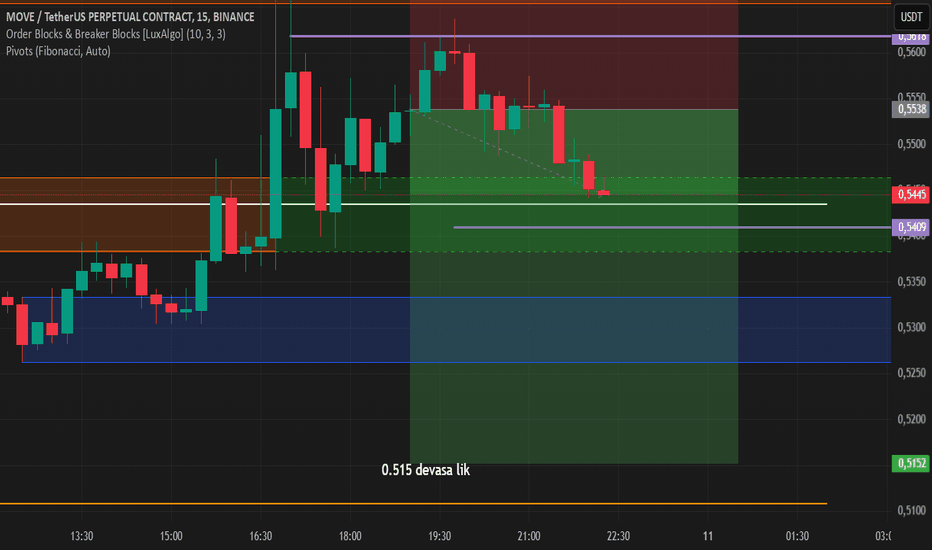
I gave it late, but manage it. super prices and gains.
Disclaimer
Any content and materials included in Sahmeto's website and official communication channels are a compilation of personal opinions and analyses and are not binding. They do not constitute any recommendation for buying, selling, entering or exiting the stock market and cryptocurrency market. Also, all news and analyses included in the website and channels are merely republished information from official and unofficial domestic and foreign sources, and it is obvious that users of the said content are responsible for following up and ensuring the authenticity and accuracy of the materials. Therefore, while disclaiming responsibility, it is declared that the responsibility for any decision-making, action, and potential profit and loss in the capital market and cryptocurrency market lies with the trader.