
LAYER
Solayer
| تریدر | نوع سیگنال | حد سود/ضرر | زمان انتشار | مشاهده پیام |
|---|---|---|---|---|
خرید | حد سود: تعیین نشده حد ضرر: تعیین نشده | 12/25/2025 |

Price Chart of Solayer
سود 3 Months :
سیگنالهای Solayer
Filter
Sort messages by
Trader Type
Time Frame
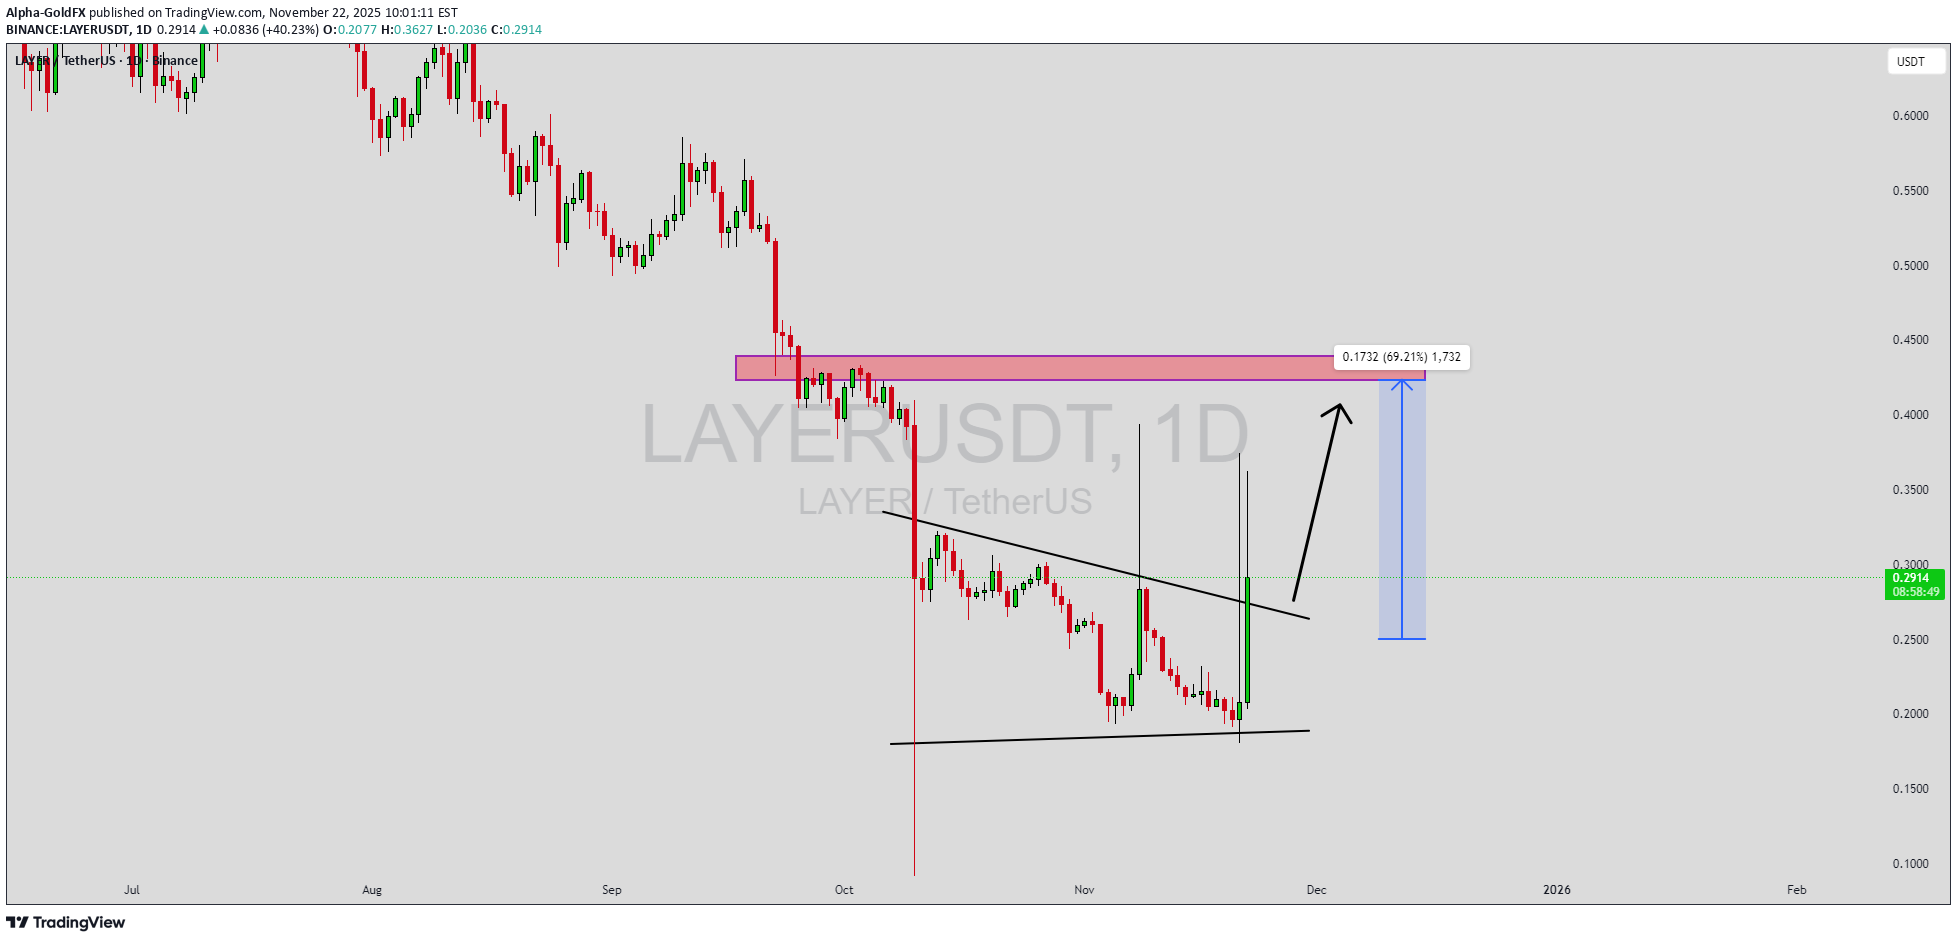
LAYERUSDT Forming Falling Wedge
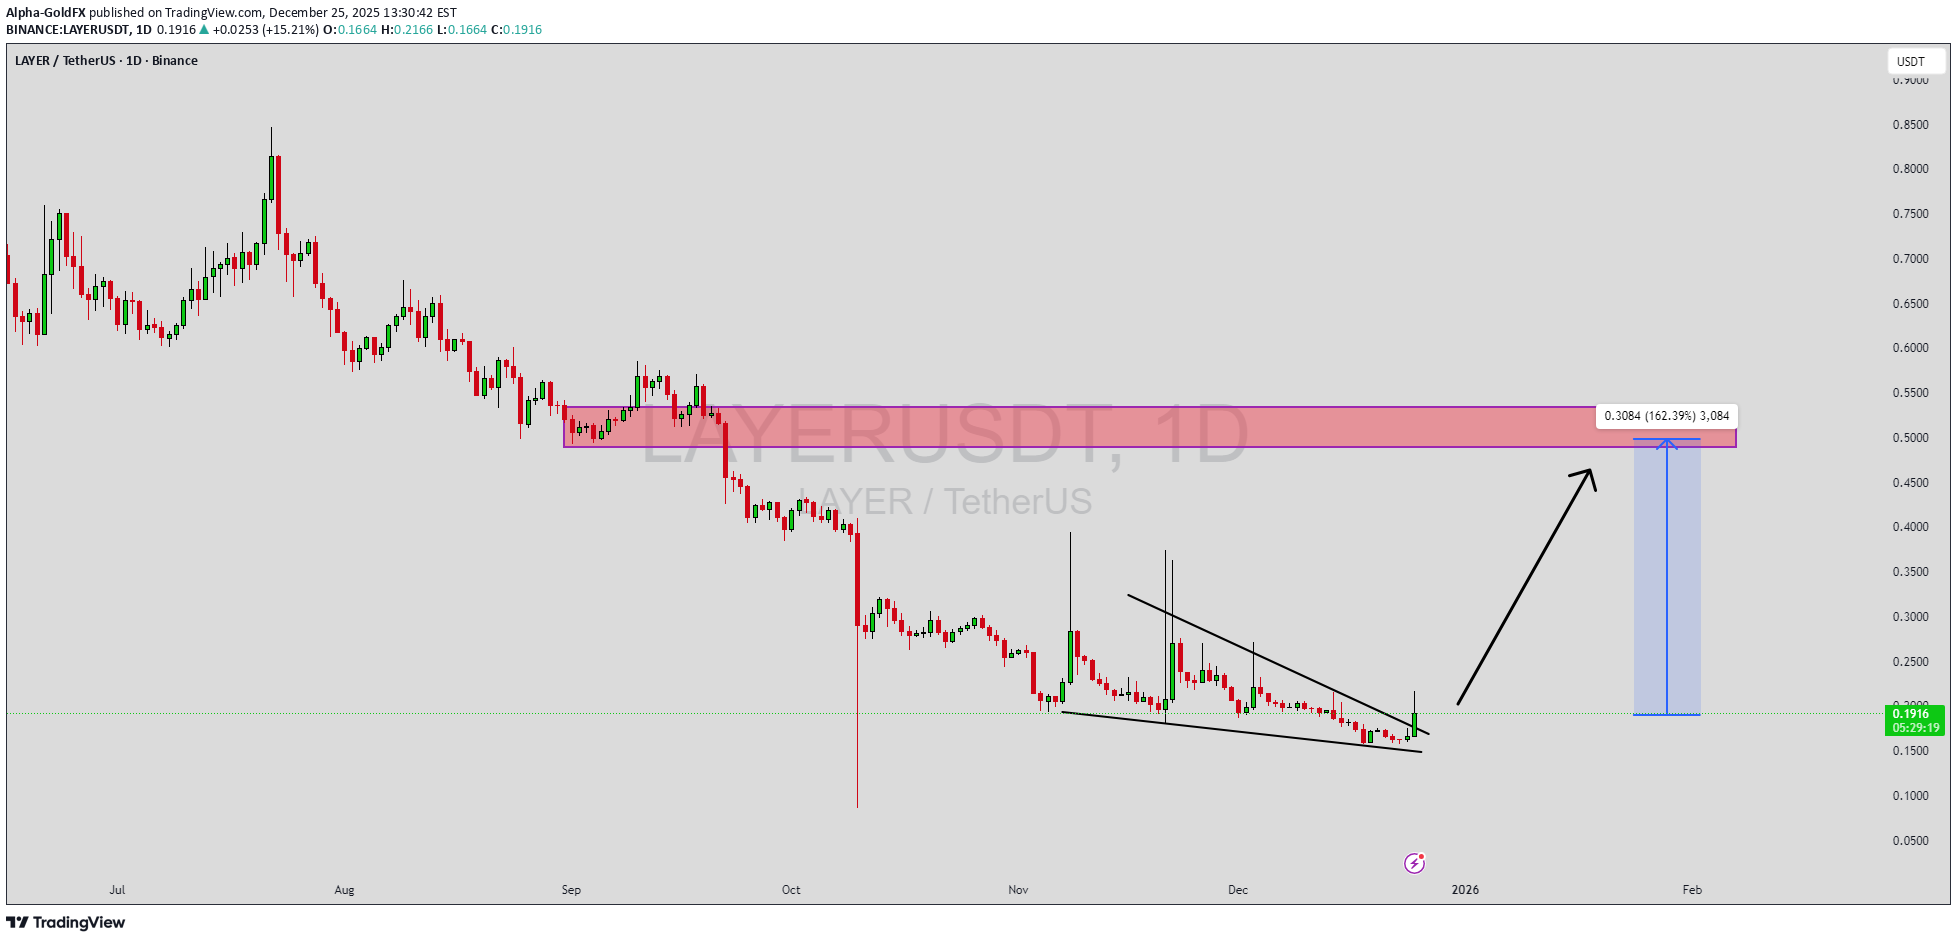
LAYERUSDT is forming a clear falling wedge pattern, a classic bullish reversal signal that often indicates an upcoming breakout. The price has been consolidating within a narrowing range, suggesting that selling pressure is weakening while buyers are beginning to regain control. With consistent volume confirming accumulation at lower levels, the setup hints at a potential bullish breakout soon. The projected move could lead to an impressive gain of around 140% to 150% once the price breaks above the wedge resistance. This falling wedge pattern is typically seen at the end of downtrends or corrective phases, and it represents a potential shift in market sentiment from bearish to bullish. Traders closely watching LAYERUSDT are noting the strengthening momentum as it nears a breakout zone. The good trading volume adds confidence to this pattern, showing that market participants are positioning early in anticipation of a reversal. Investors’ growing interest in LAYERUSDT reflects rising confidence in the project’s long-term fundamentals and current technical strength. If the breakout confirms with sustained volume, this could mark the start of a fresh bullish leg. Traders might find this a valuable setup for medium-term gains, especially as the wedge pattern completes and buying momentum accelerates. ✅ Show your support by hitting the like button and ✅ Leaving a comment below! (What is your opinion about this Coin?) Your feedback and engagement keep me inspired to share more insightful market analysis with you!

LAYER/USDT-Ready
LAYER/USDT appears to have completed the final stage of a liquidity sweep, where weak hands were shaken out below key support. This behavior is commonly seen at the end of corrective cycles, setting the stage for a strong directional move.

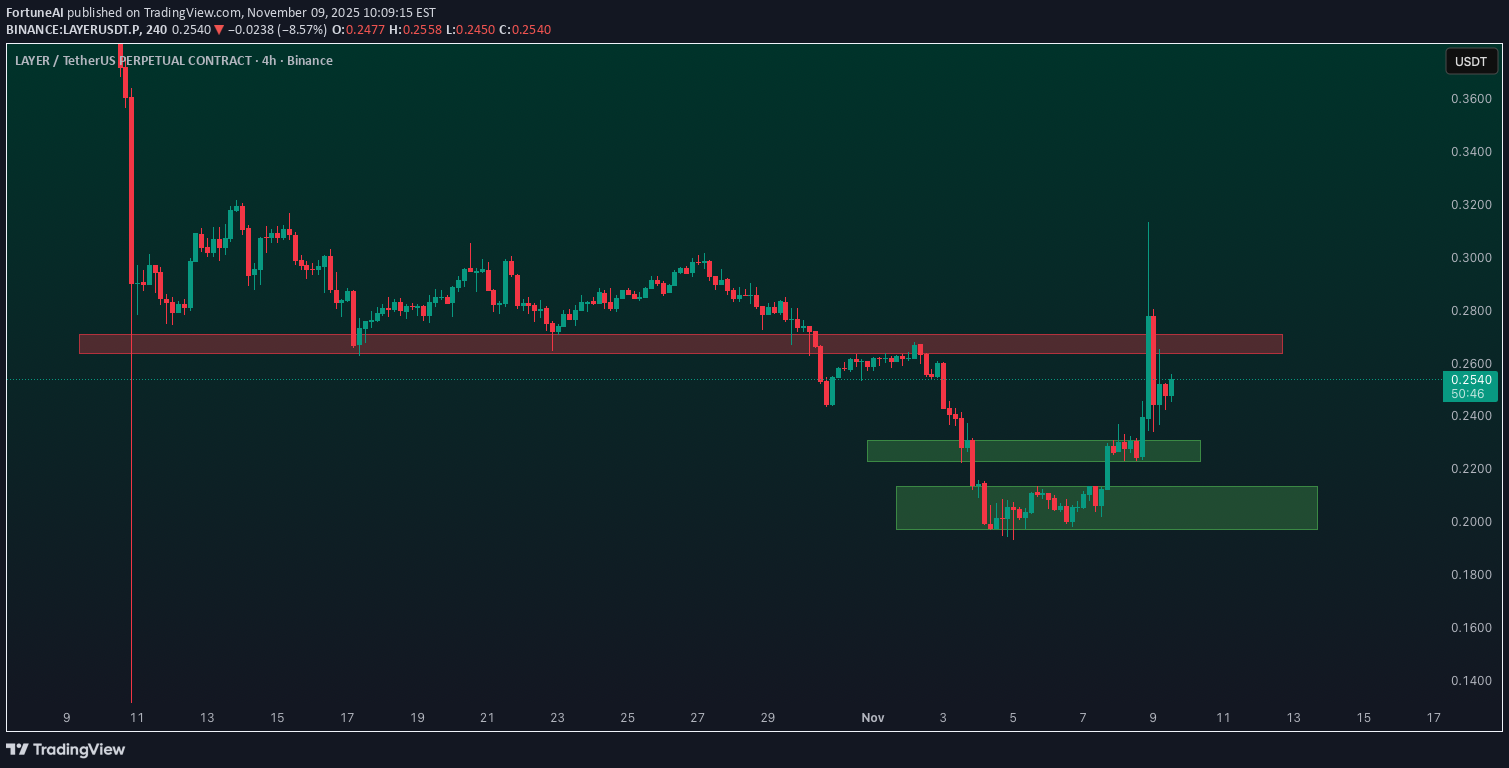
شکست انقلابی لایه (LAYER): آیا قیمت به سقفهای سبز نزدیک میشود؟
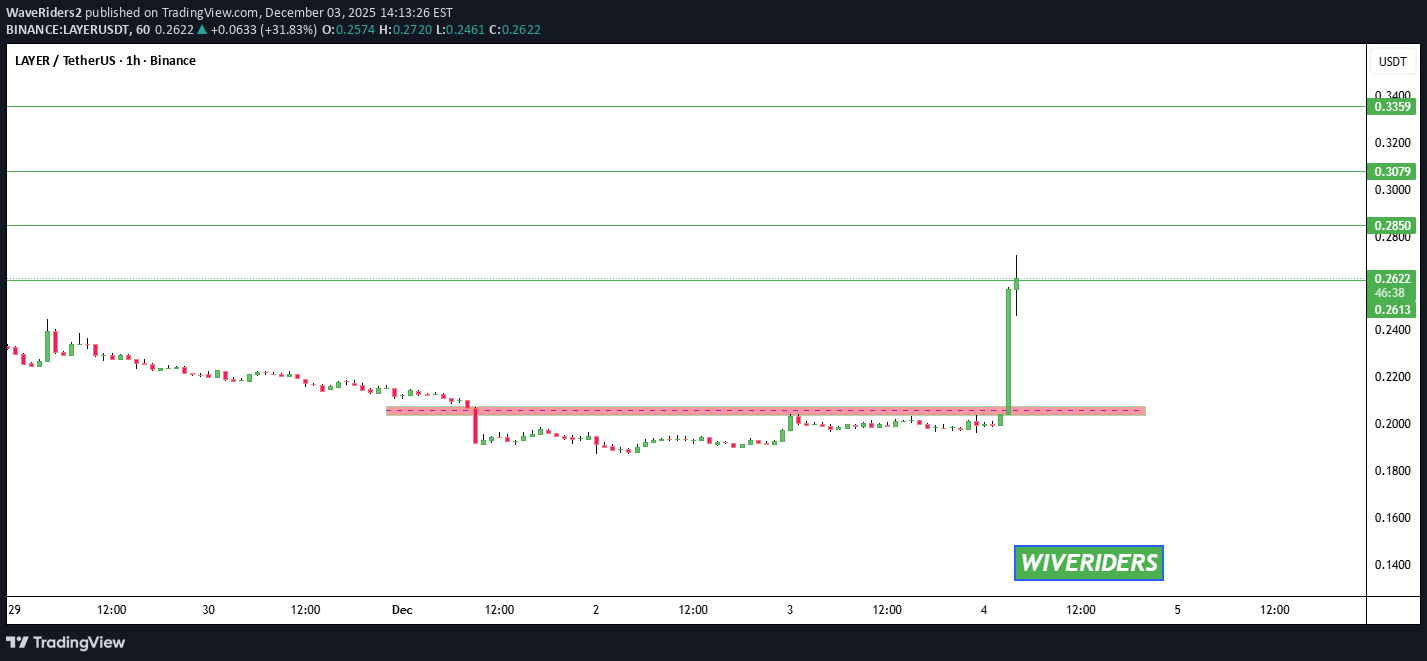
🚨📊 LAYER Update LAYER has just broken out above the red resistance zone 🔴🚀 with strong, big bullish candles, showing powerful buyer momentum. With this clean breakout, LAYER could continue moving up toward the green line targets 🟩🎯 as long as price holds above the old resistance (now turned support). Key points: 🔴 Red resistance broken 🚀 Strong bullish breakout candles 🟩 Next targets = green line levels Support flip increases bullish continuation chances
آیا لایه (LAYER) در آستانه انفجار قیمتی است؟ سیگنال صعودی قوی در نمودار!
LAYERUSDT is forming a clear falling wedge pattern on the daily chart, a classic bullish reversal signal that often indicates an upcoming breakout in the high-performance Solana ecosystem of late 2025. The price has been consolidating within a narrowing range around $0.23, suggesting that selling pressure is weakening while buyers are beginning to regain control through higher lows amid the recent 37% surge from oversold depths. With good trading volume exploding to over $288 million in the last 24 hours—dominated by Binance's LAYER/USDT pair—the setup hints at a potential bullish breakout soon, especially as RSI rebounds from oversold territory near 40 and the wedge nears its apex. The projected move could lead to an impressive gain of 60% to 70%+ once the price breaks above the wedge resistance near $0.27, targeting levels up to $0.39 in the near-term rally. This falling wedge pattern is typically seen at the end of downtrends or corrective phases, and it represents a potential shift in market sentiment from bearish to bullish as LAYERUSDT stabilizes post its October lows at $0.085. Traders closely watching LAYERUSDT are noting the strengthening momentum from Solayer's InfiniSVM architecture, which leverages RDMA and InfiniBand for 1MM+ TPS and near-zero latency, fueling real traction in decentralized high-frequency trading. The good trading volume adds confidence to this pattern, showing that market participants are positioning early in anticipation of a reversal, with open interest spiking 60% and over 1.8 million trades signaling whale accumulation. Investors’ growing interest in LAYERUSDT reflects rising confidence in the project’s long-term fundamentals, like the hardware-accelerated network's multi-execution model and integrations targeting $79 million market cap growth. If the breakout confirms with sustained volume, this could mark the start of a fresh bullish leg, amplified by predictions eyeing $3+ highs in 2025's scaling boom. Traders might find this a valuable setup for medium-term gains, especially as the wedge pattern completes and buying momentum accelerates toward $0.50+ in the Solana DeFi surge. ✅ Show your support by hitting the like button and ✅ Leaving a comment below! (What is You opinion about this Coin) Your feedback and engagement keep me inspired to share more insightful market analysis with you!

تحلیل تکنیکال لایه (LAYER): سیگنال صعود قوی با استراتژی ورود و خروج دقیق!
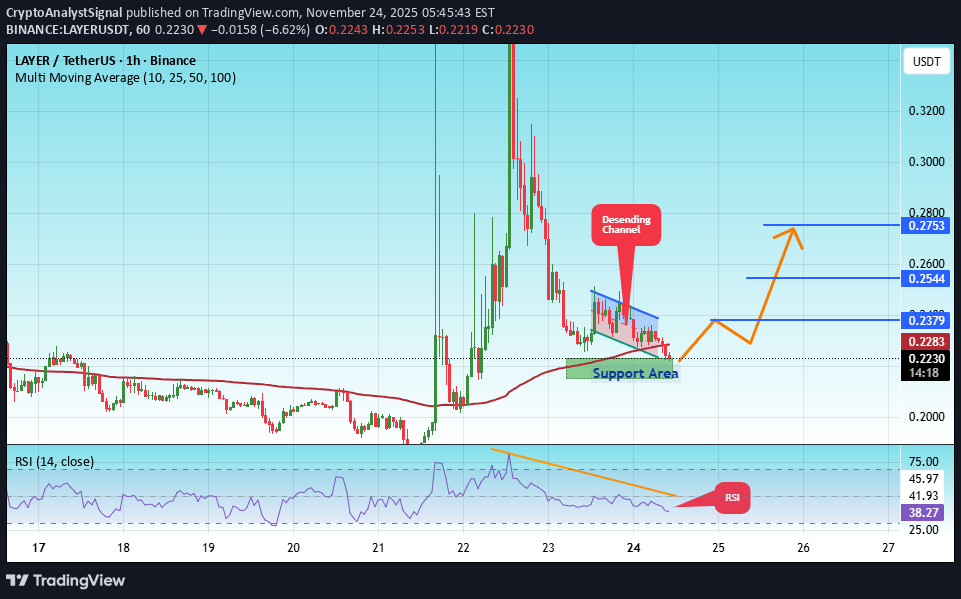
#LAYER The price is moving within an ascending channel on the 1-hour timeframe and is adhering to it well. It is poised to break out strongly and retest the channel. We have a downtrend line on the RSI indicator that is about to break and retest, which supports the upward move. There is a key support zone in green at 0.2187, representing a strong support point. We have a trend of consolidation above the 100-period moving average. Entry price: 0.2240 First target: 0.2380 Second target: 0.2544 Third target: 0.2753 Don't forget a simple money management rule: Place your stop-loss order below the green support zone. Once you reach the first target, save some money and then change your stop-loss order to an entry order. For any questions, please leave a comment. Thank you.

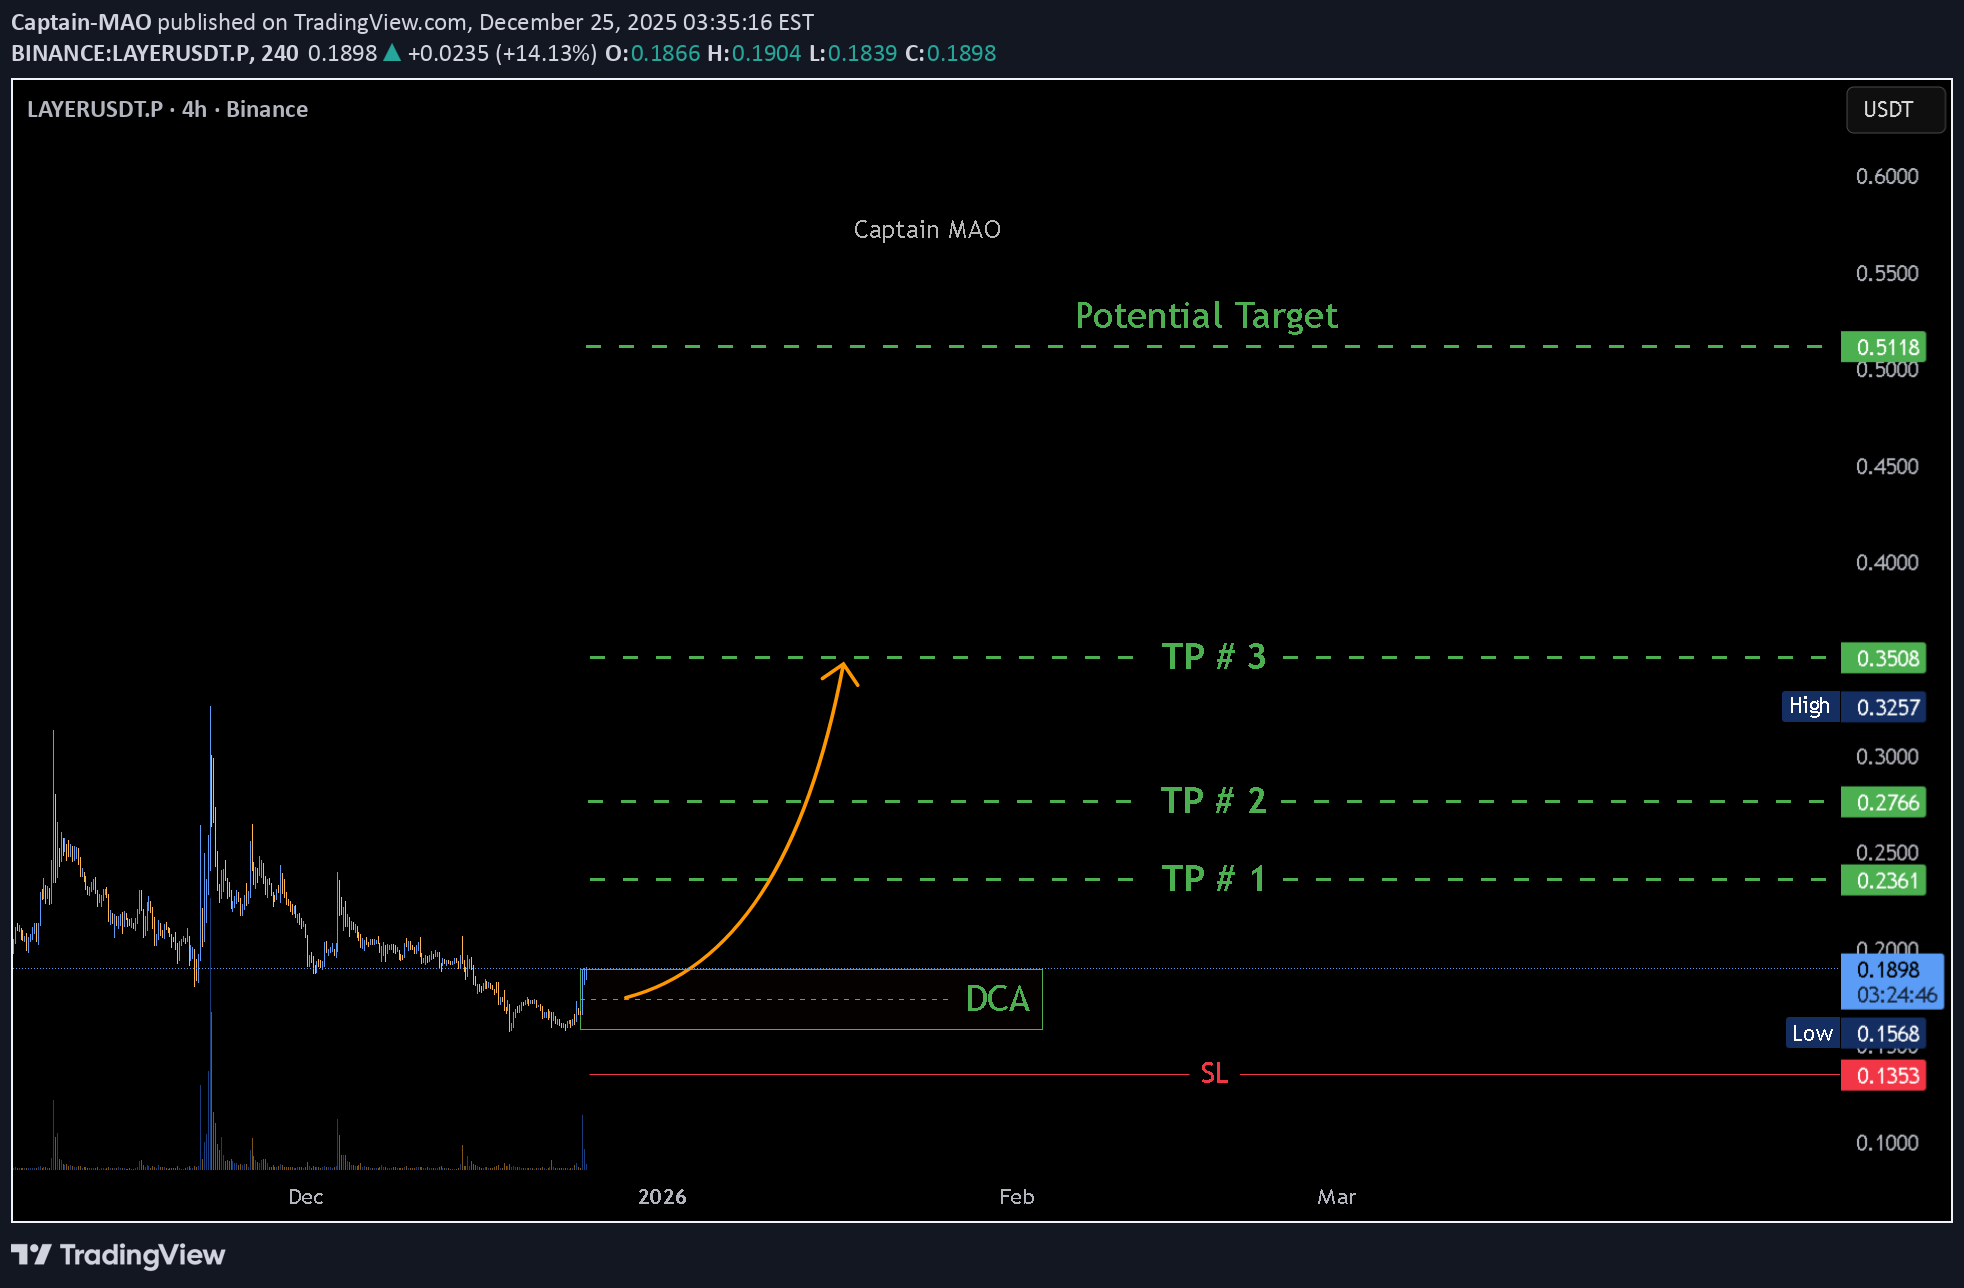
کف گرد در نمودار: فرصت خرید با نشانههای صعودی قوی!
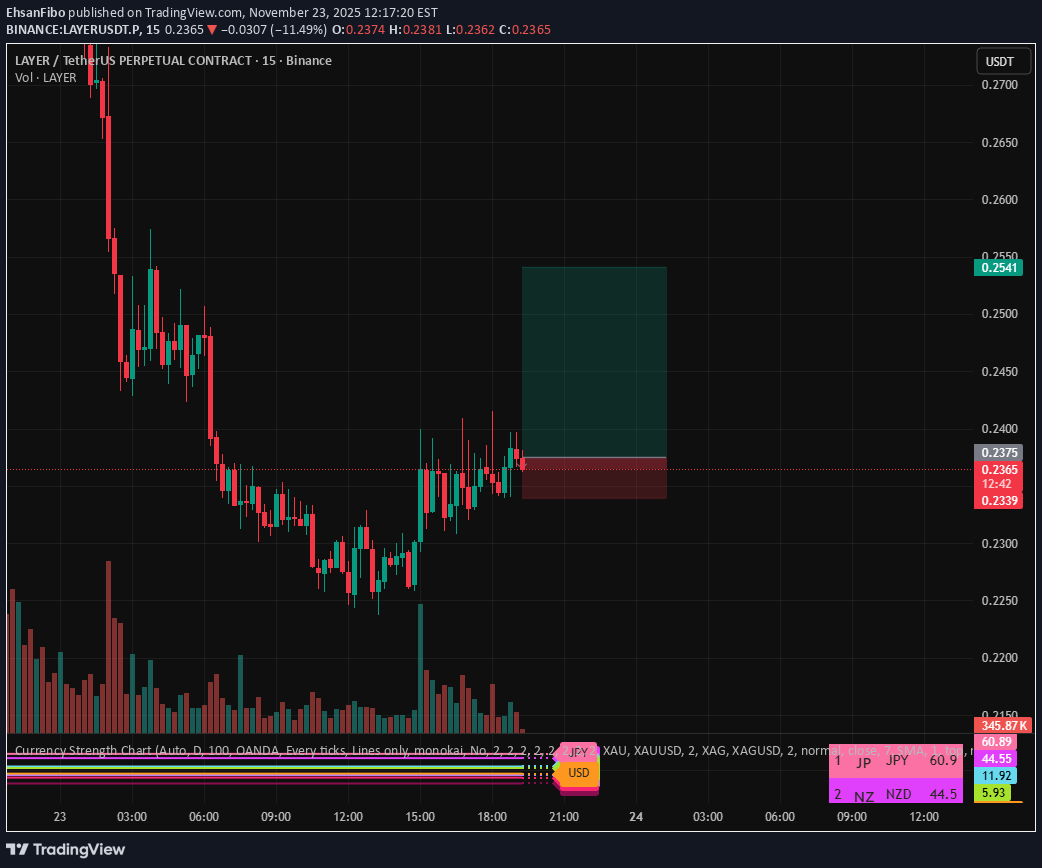
After a prolonged downtrend, price has formed a rounded bottom and is now showing signs of bullish accumulation. Multiple higher lows indicate that buyers are gradually stepping in. Price is currently retesting a minor support level with steady volume, creating a potential opportunity for a continuation move toward the next resistance. My entry is based on this bullish structure, with a stop below the recent swing low and a target aligned with the upper resistance zone.
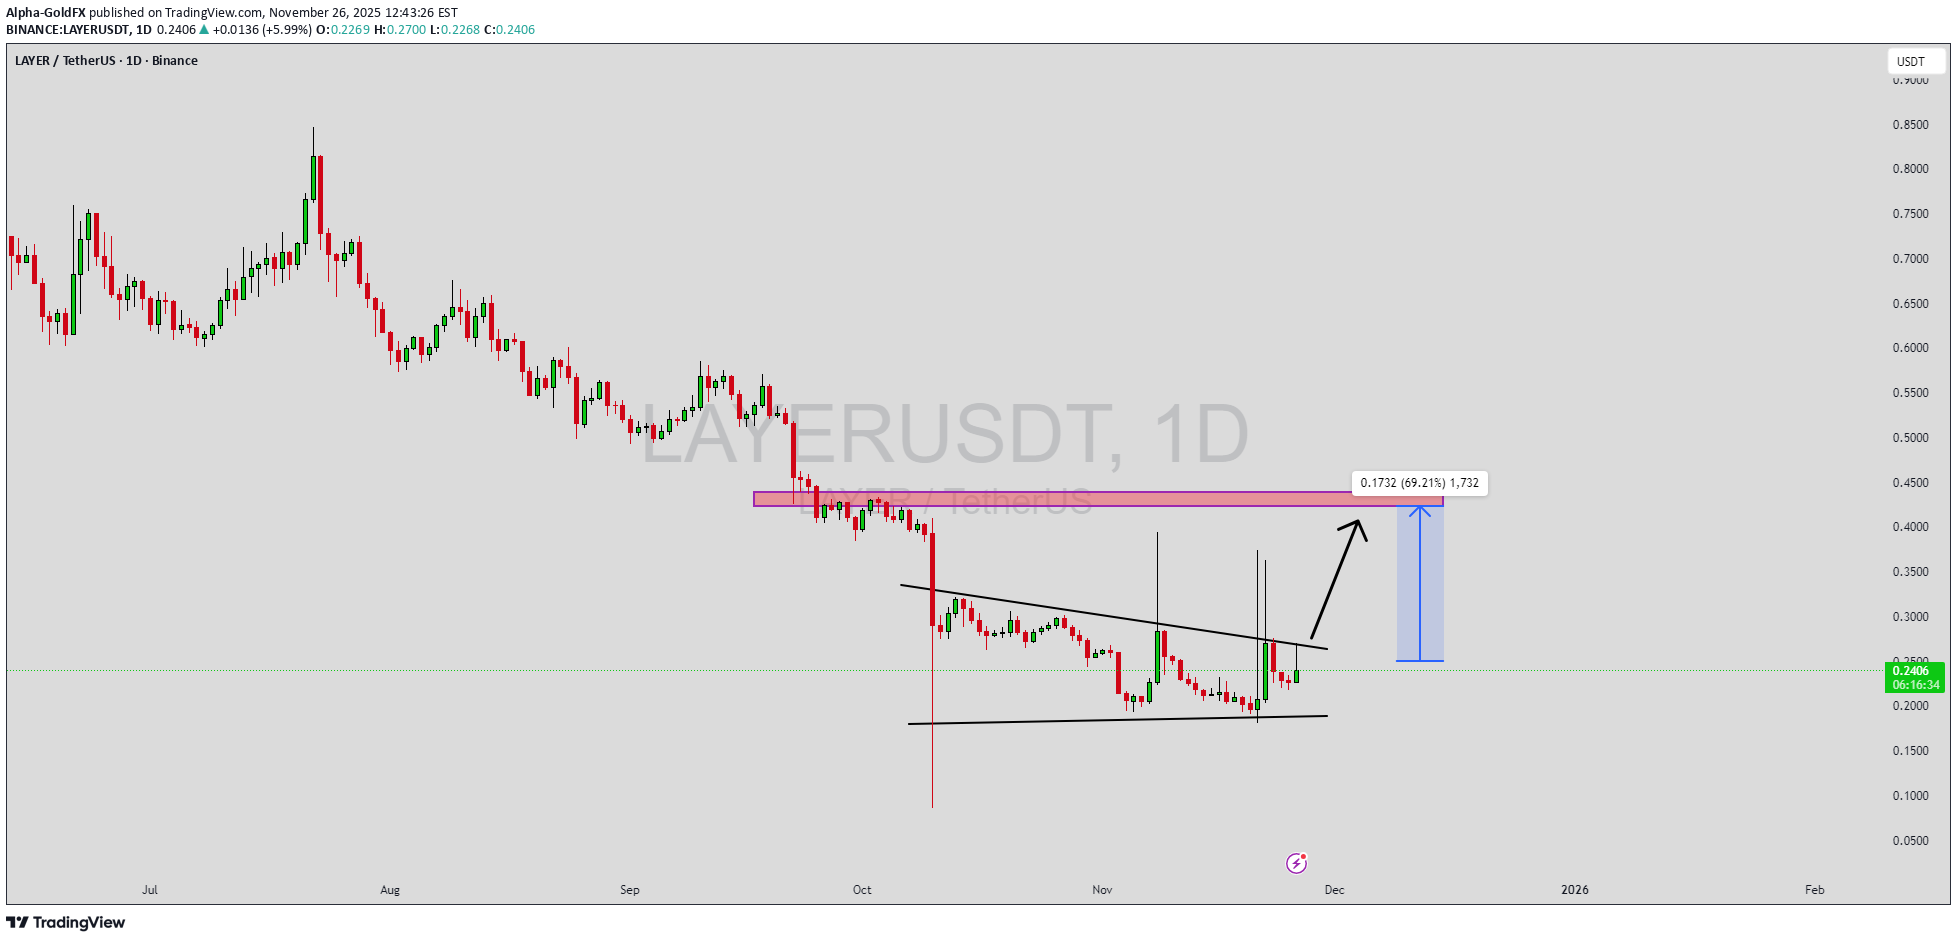
هشدار صعودی LAYERUSDT: الگوی گُوِه نزولی و احتمال جهش ۶۰ درصدی!
LAYERUSDT is forming a clear falling wedge pattern on the daily chart, a classic bullish reversal signal that often indicates an upcoming breakout in the high-performance Solana ecosystem of late 2025. The price has been consolidating within a narrowing range around $0.23, suggesting that selling pressure is weakening while buyers are beginning to regain control through higher lows amid the recent 37% surge from oversold depths. With good trading volume exploding to over $288 million in the last 24 hours—dominated by Binance's LAYER/USDT pair—the setup hints at a potential bullish breakout soon, especially as RSI rebounds from oversold territory near 40 and the wedge nears its apex. The projected move could lead to an impressive gain of 60% to 70%+ once the price breaks above the wedge resistance near $0.27, targeting levels up to $0.39 in the near-term rally. This falling wedge pattern is typically seen at the end of downtrends or corrective phases, and it represents a potential shift in market sentiment from bearish to bullish as LAYERUSDT stabilizes post its October lows at $0.085. Traders closely watching LAYERUSDT are noting the strengthening momentum from Solayer's InfiniSVM architecture, which leverages RDMA and InfiniBand for 1MM+ TPS and near-zero latency, fueling real traction in decentralized high-frequency trading. The good trading volume adds confidence to this pattern, showing that market participants are positioning early in anticipation of a reversal, with open interest spiking 60% and over 1.8 million trades signaling whale accumulation. Investors’ growing interest in LAYERUSDT reflects rising confidence in the project’s long-term fundamentals, like the hardware-accelerated network's multi-execution model and integrations targeting $79 million market cap growth. If the breakout confirms with sustained volume, this could mark the start of a fresh bullish leg, amplified by predictions eyeing $3+ highs in 2025's scaling boom. Traders might find this a valuable setup for medium-term gains, especially as the wedge pattern completes and buying momentum accelerates toward $0.50+ in the Solana DeFi surge. ✅ Show your support by hitting the like button and ✅ Leaving a comment below! (What is You opinion about this Coin) Your feedback and engagement keep me inspired to share more insightful market analysis with you!

تحلیل لایه (LAYER) روی نمودار روزانه: آیا ریزش در راه است یا آماده انفجار قیمتی است؟
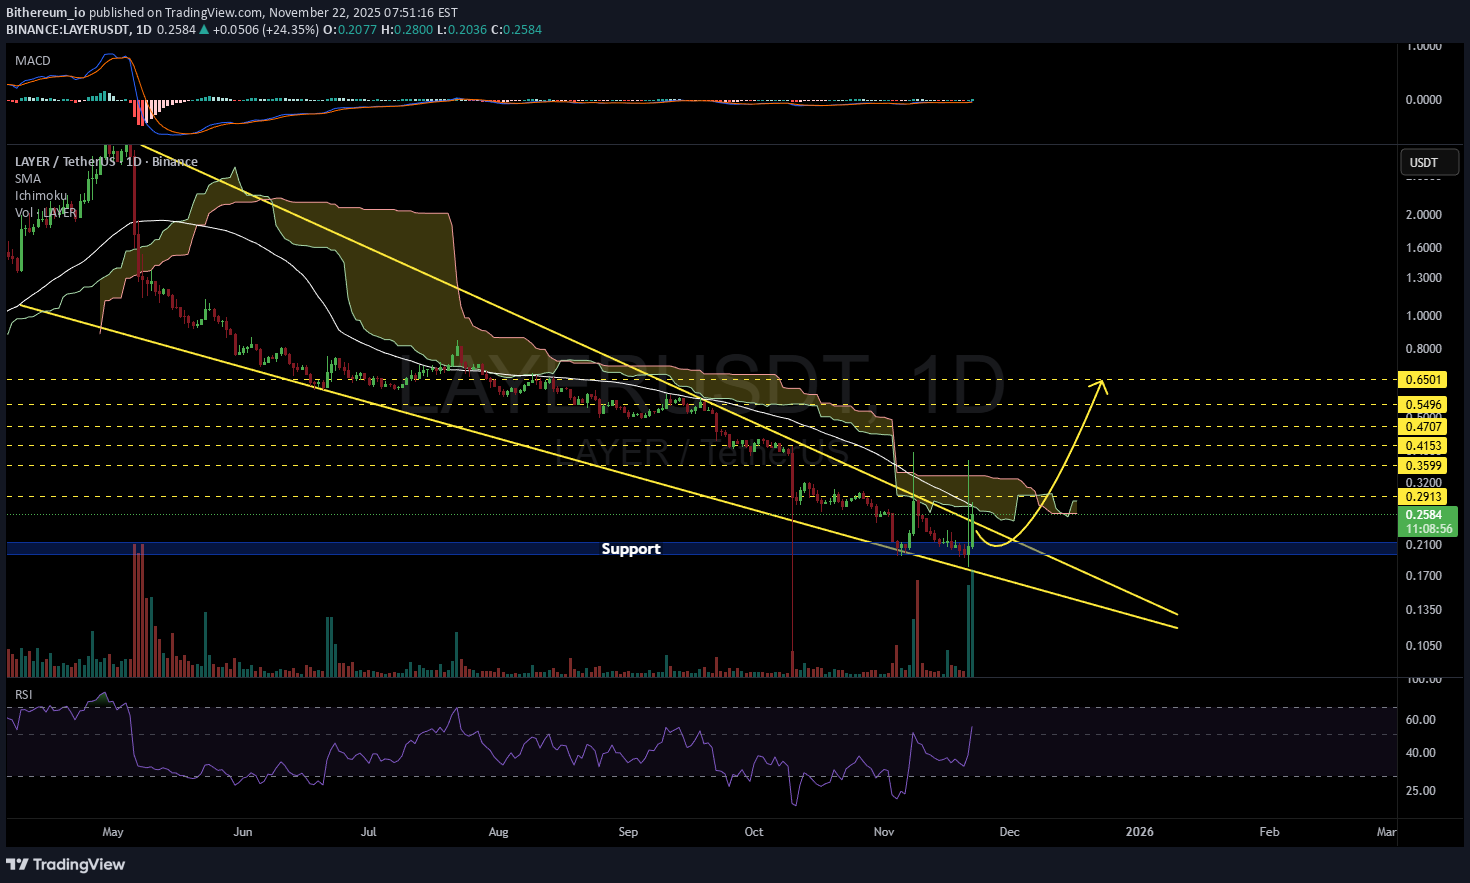
#LAYER is attempting to break above the falling wedge pattern on the daily chart, but it’s also running into a resistance cluster that includes the Ichimoku cloud and the daily SMA50. Because of this, there’s a chance it may pull back into the wedge and retest the support. Consider buying a small bag here and near the support zone. If price breaks above the entire resistance cluster, the potential upside targets are: 🎯 $0.2913 🎯 $0.3599 🎯 $0.4153 🎯 $0.4707 🎯 $0.5496 🎯 $0.6501 ⚠️ Always remember to use a tight stop-loss and maintain proper risk management.

لایه ۰.۲۴: پروژههایی که نادیده گرفته شدهاند و در آستانه انفجارند!

when ur down and you went lower with no reason its a made up crash it shall have made up sytories of great news as weel NFA just making sexy guess guys do your own ressearc or send me some JELLYJELLY tokens for love and kisses

Disclaimer
Any content and materials included in Sahmeto's website and official communication channels are a compilation of personal opinions and analyses and are not binding. They do not constitute any recommendation for buying, selling, entering or exiting the stock market and cryptocurrency market. Also, all news and analyses included in the website and channels are merely republished information from official and unofficial domestic and foreign sources, and it is obvious that users of the said content are responsible for following up and ensuring the authenticity and accuracy of the materials. Therefore, while disclaiming responsibility, it is declared that the responsibility for any decision-making, action, and potential profit and loss in the capital market and cryptocurrency market lies with the trader.