
JTO
Jito
| تریدر | نوع سیگنال | حد سود/ضرر | زمان انتشار | مشاهده پیام |
|---|---|---|---|---|
No results found. | ||||
Price Chart of Jito
سود 3 Months :
سیگنالهای Jito
Filter
Sort messages by
Trader Type
Time Frame

iMoneyTeam
JTO Buy/Long Signal (4H)

JTO is currently at key levels and we have a bullish CH on the chart. Above the current price the CP move appears as a spike which indicates there is no significant resistance. On pullbacks to the support zones we can look for buy or long positions. The targets are marked on the chart. Take partial profit at the first target and move the stop loss to breakeven. Do not enter the position without capital management and stop setting Comment if you have any questions thank youAfter hitting the first entry point the price pumped more than 10 percent and reached the first target.

JTO – Weekly Outlook

Price broke below the previous support and confirmed an S/R flip, turning that level into resistance. Last wick from October 6th is now fully filled, which means that inefficiency has been resolved. We are currently trading below key weekly support, and price is consolidating at lows. At this point, there is no clear confirmation of a reversal yet. Key observation: If price creates a deviation below current support, I’ll be watching for long opportunities on lower timeframes, targeting a move back into the range. If not, this level may act as acceptance and continuation to the downside. Patience is key here — let the market show its hand. Levels to watch: Resistance: previous weekly support (now S/R flip) Support: current lows after wick fill What do you think — deviation reclaim incoming or further downside first?

CoinKingKripto
JTOUSDT – Makro Yapı Analizi ve 2026–2027 Olası Yol Haritası
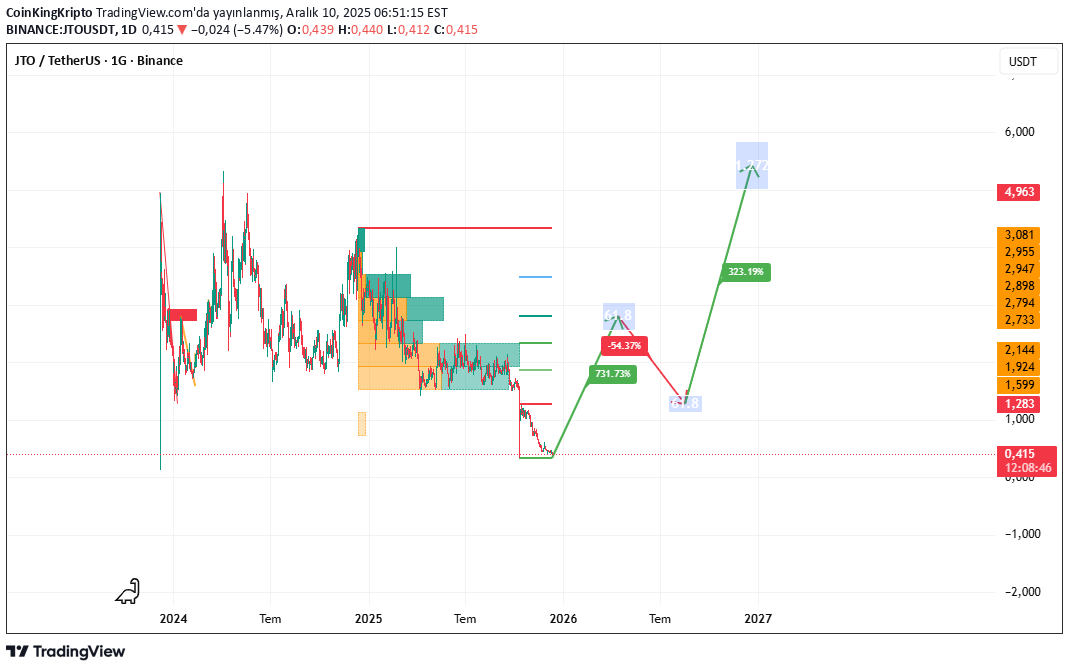
JTO broke the horizontal squeeze it had been in for a long time and entered the macro capitulation zone. The price is currently operating at the lowest liquidity support according to the historical volume profile. Although this region has not generated strong demand in the past, it increases the possibility of a medium-to-long-term return as it is an area where excessive sales are concentrated. 1️⃣ Structural View • The wide distribution structure in the 2024–2025 period was broken down. • The price made a clean liquidity purge by falling below all previous major supports. • The area currently marked on the chart is the first technical ground for a potential macro bottom formation. 2️⃣ Possible Scenario (Data Based) Green road: If the demand from the bottom region is supported, the price has the potential to recover in the first half of 2026 and produce a counter-attack up to the 700%+ band. It is technically normal to expect an interim correction after this rise. Long term goal: With the 2027 bull cycle, a major trend reversal scenario extending to the macro resistance area may come into play. 3️⃣ Risk Area (Red Scenario) In case of selling pressure at the intermediate resistance after the rise, the -54% retracement area will be the critical threshold for reaccumulation. 4️⃣ Strategic Note This study is not a “prediction”; It is a structural probability map derived entirely from current price behavior. The real trend confirmation for JTO begins when the price reclaims the 1.00–1.28 zone. If persistence is achieved above this region, the macro trend reversal towards 2027 will technically strengthen.

Bithereum_io
احتمال انفجار قیمت JTO: فرصت خرید در کف کانال نزولی با نشانههای صعودی!

#JTO is moving inside a falling wedge pattern on the 12H timeframe and has printed an RSI bullish divergence, which increases the probability of a breakout to the upside. Keep an eye on it. In case of a breakout, the potential targets are: 🎯 $0.538 🎯 $0.619 🎯 $0.684 🎯 $0.749 🎯 $0.842 🎯 $0.961 ⚠️ Always remember to use a tight stop-loss and maintain proper risk management.
Bithereum_io
سیگنال انفجاری JTO: مثلث نزولی و شانس بزرگ صعود! (اهداف سقف جدید)
#JTO is moving inside a falling wedge pattern on the 12H timeframe and has printed an RSI bullish divergence, which increases the probability of a breakout to the upside. Keep an eye on it. In case of a breakout, the potential targets are: 🎯 $0.538 🎯 $0.619 🎯 $0.684 🎯 $0.749 🎯 $0.842 🎯 $0.961 ⚠️ Always remember to use a tight stop-loss and maintain proper risk management.

mehdishirian
تحلیل انفجاری JTO/USDT: سود 85 درصدی از پیشبینی دقیق!

Hello friends 😍 💁♂️ This time let's go to the JTO-USDT cryptocurrency ✅ And again a great analysis and a precise area 💁♂️ We introduced the apple cryptocurrency from the area marked with a red circle and were monitoring 👉 We expected the price to reach the lower purple area 👉 After a little price fluctuation, the price reached the area with a Sharpe movement and crossed that area too ✅The total drop rate from the marked area was about 85%, which was very amazing 🔥🔥🔥 ✅The drop rate to the lower purple area was also 60% 🔥🔥🔥 What's better than this? 😍 Yes, this was a great analysis with great results 💖⭐ 💁♂️ Has anyone used this analysis? 🤔Let me know your thoughts ⚠️ None of the analysis is a recommendation to buy or sell, but simply my personal opinions on the charts. You can use the charts and choose any that interest you and take a position if you wish. To support me, I would appreciate it if you boost the analysis and share it with your friends so that I can analyze it with more energy for you, my dears. Thank you all. 💖

CryptoNuclear
نقطه عطف JTO: آیا منتظر انفجار صعودی هستیم یا سقوط بیشتر؟

JTO is currently retesting its key support zone at 1.60–1.40, an area that has acted as a strong foundation since early 2024. Each touch of this zone has triggered notable buying reactions — signaling institutional accumulation, even as the broader trend remains under bearish pressure. Now, the market stands at a critical crossroad. Volume is fading, volatility is tightening, and price is compressing within the support zone — a classic setup before a large directional move. --- 🔹 Bullish Scenario — Reversal from the Accumulation Zone If the price can hold above 1.60–1.40 and break through the key resistance at 1.874, it could trigger a mid-term bullish reversal. Potential upside targets include: Target 1: 2.286 Target 2: 2.716 Extended targets: 3.227 – 3.972 Such movement would confirm the formation of a double-bottom accumulation base, often seen before a strong upward recovery. --- 🔻 Bearish Scenario — Breakdown Continuation On the other hand, if the price closes a 2D candle below 1.40, it would invalidate the accumulation structure and signal continuation of the broader downtrend. In this case, the next potential downside targets lie at 1.20 – 1.00, marking the next psychological and technical demand zones. --- 📊 Technical Structure & Market Dynamics The lower-highs formation remains intact, reflecting sustained medium-term bearish pressure. However, repeated long wicks below the yellow zone suggest liquidity sweeps — typical signs of smart-money accumulation before a rebound. The 1.60–1.40 zone now acts as the main battleground between long-term buyers and short-term sellers. --- ⚖️ Conclusion > JTO is at a decisive inflection point. Holding above 1.60–1.40 could spark a major rebound. Breaking below 1.40 could confirm another leg down toward 1.20–1.00. When volatility compresses and the market looks quiet — that’s often when the next big move begins. --- #JTO #CryptoAnalysis #Altcoin #TechnicalAnalysis #PriceAction #ReversalZone #CryptoMarket #SupportResistance #SwingTrade

Mike-BTD
JITO at the bottom of the range
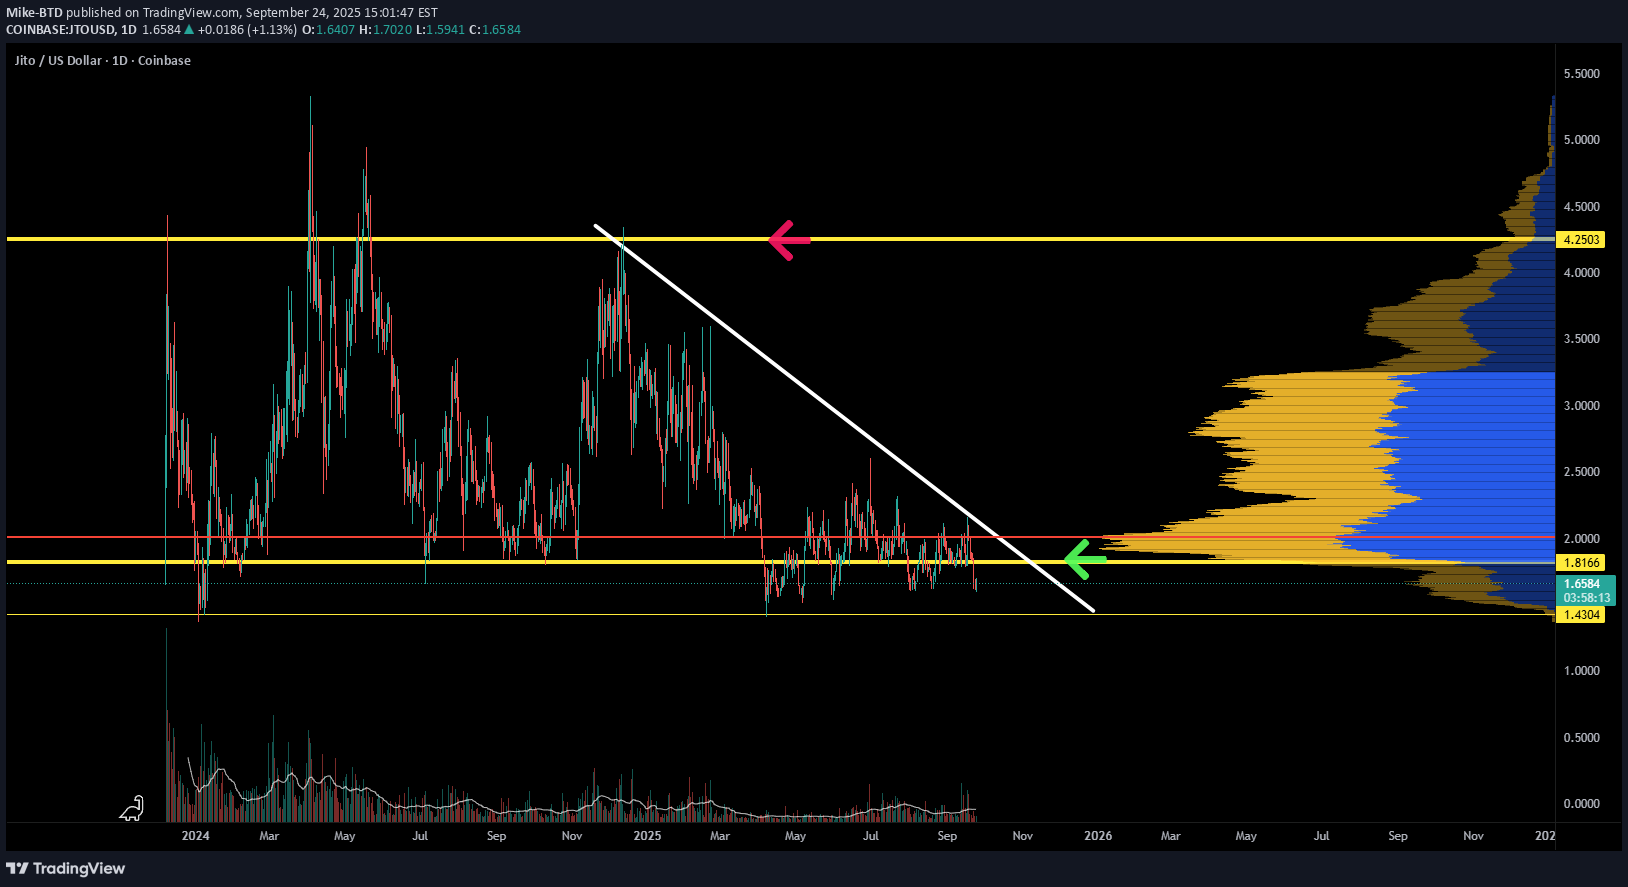
JTO has been holding strong at horizontal support for a few months. As this floor price is being established, the R:R is becoming an important part of a potential long-term setup. Invalidations are clear, and the ability to plan for a liquidation hunt is also clear. If you are bullish on the SOL narrative, this is not a bad time to consider obtaining some exposure.
CryptoNuclear
JTO/USDT — Ready Strong Rebound or a Major Breakdown?

📊 Full Analysis 1. Current Market Outlook JTO/USDT is now trading right inside the key demand zone (1.50–1.62), which has acted as a major support level since early 2024. Every retest of this zone has historically triggered a strong bounce, showing institutional buying interest around this area. However, repeated retests without significant breakouts are gradually weakening the support strength, making this level a true battleground for Bulls vs Bears. --- 2. Structure & Pattern Range Market: Since March 2025, JTO has been consolidating between 1.62–2.29, forming a clear sideways range. Lower Highs: Since late 2024, price has been forming lower peaks → a sign of continued selling pressure. Liquidity Sweep: The latest candle wicked below support before quickly bouncing back → a possible stop-hunt/liquidity grab. Demand Zone (Golden Box): 1.50–1.62 is the Decision Point that will determine whether JTO rebounds or breaks down. --- 3. Key Technical Levels Critical Support: 1.62 – 1.50 Minor Resistance: 1.874 Major Resistance: 2.286 (range top) Bullish Targets: 2.716 → 3.227 → 3.972 → 4.867 Bearish Targets: 1.30 → 1.00 → 0.95 (measured move projection) --- 4. Bullish Scenario (Rebound from Demand Zone) ✅ Aggressive Entry: Buy inside the demand zone 1.50–1.62 with strong rejection candle (hammer / bullish engulfing). ✅ Conservative Entry: Wait for breakout and close above 2.286, then enter on retest confirmation. 🎯 Upside Targets: Step 1: 1.874 → 2.286 Step 2: 2.716 → 3.227 → 3.972 Step 3: 4.867 if momentum continues. ⚠️ Invalidation: Daily/2D close below 1.50. --- 5. Bearish Scenario (Breakdown of Demand Zone) ❌ Trigger: Daily/2D close below 1.50 with strong selling volume. 🎯 Downside Targets: First: 1.30 (minor support) Second: 1.00 (psychological round number) Third: 0.95 (measured move target from range). ⚠️ Conclusion: If this zone fails, JTO risks entering a capitulation phase toward sub-$1 levels. --- 6. Market Narrative & Psychology For Bulls, the 1.50–1.62 zone is the last stronghold — holding this zone could form a double bottom and fuel a large reversal. For Bears, a clean breakdown of this zone would open a free fall toward $1 and below. In short, this is the make-or-break level for JTO, where the next big move will be decided. --- 📌 Conclusion As long as JTO holds above 1.50, upside targets toward 2.286 → 3.227 remain possible. If 1.50 breaks, expect a potential drop to 1.00 or even 0.95. Watch for 2D/daily candle close confirmation to validate the next major direction. --- JTO/USDT (2D) is now testing its multi-month demand zone at 1.50–1.62. This is the critical “Decision Point” for the market: Bullish: Rejection + breakout above 2.286 → targets 2.716 – 3.227 – 3.972 – 4.867. Bearish: Breakdown below 1.50 → downside targets 1.30 – 1.00 – 0.95. This zone will decide whether JTO forms a double bottom reversal or enters a bearish capitulation. Not financial advice — for educational purposes only. --- #JTO #JTOUSDT #CryptoAnalysis #DemandZone #SupportResistance #CryptoTrading #SwingTrade #Breakout #BearishScenario #BullishScenario
Bithereum_io
JTOUSDT 1D
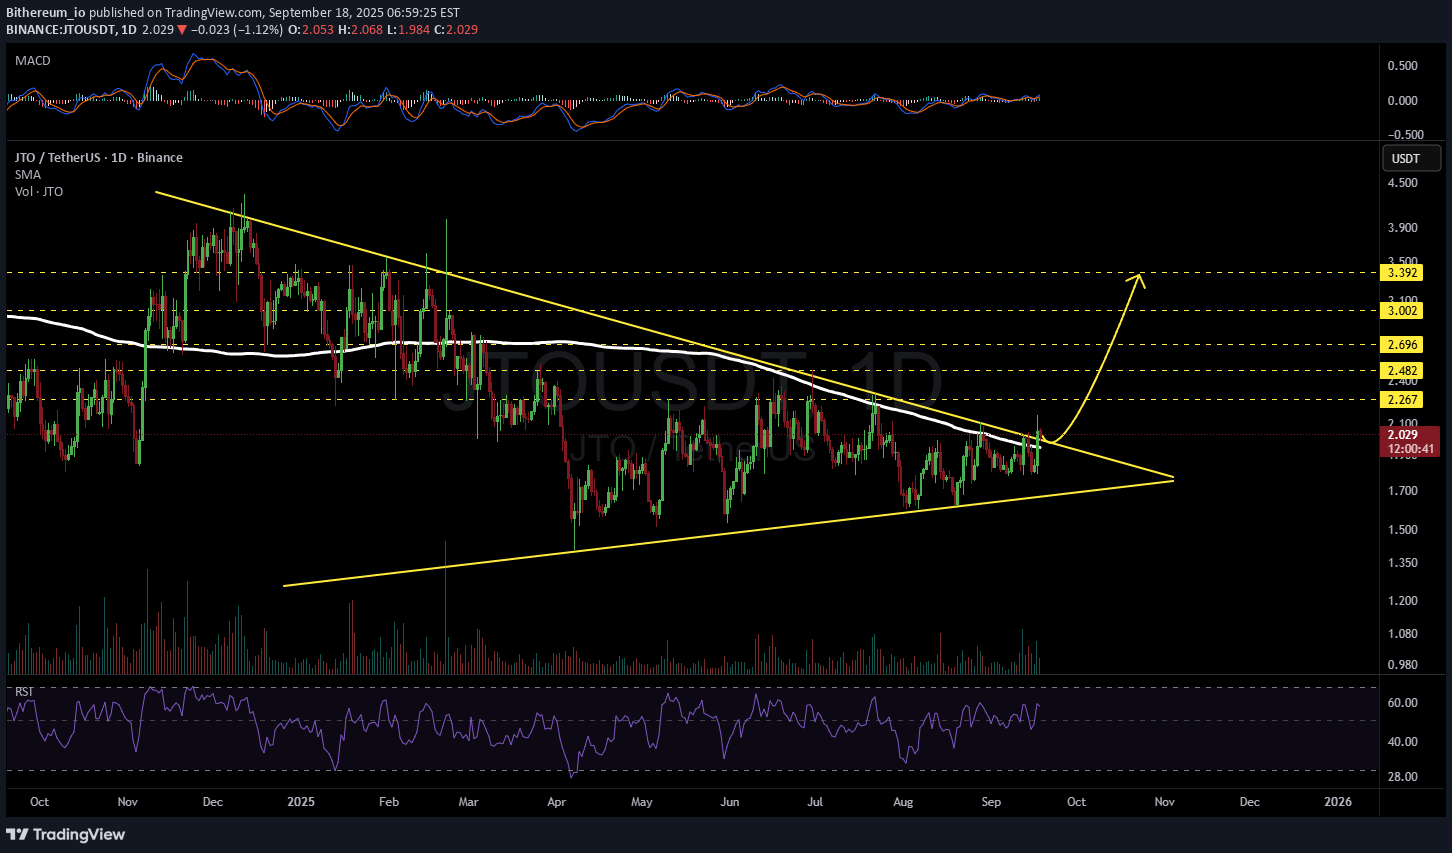
#JTO has broken above the triangle resistance and the SMA200 on the daily chart. In case of a successful retest, the potential targets are: 🎯 $2.267 🎯 $2.482 🎯 $2.696 🎯 $3.002 🎯 $3.392 ⚠️ Always remember to use a tight stop-loss and follow proper risk management.
Disclaimer
Any content and materials included in Sahmeto's website and official communication channels are a compilation of personal opinions and analyses and are not binding. They do not constitute any recommendation for buying, selling, entering or exiting the stock market and cryptocurrency market. Also, all news and analyses included in the website and channels are merely republished information from official and unofficial domestic and foreign sources, and it is obvious that users of the said content are responsible for following up and ensuring the authenticity and accuracy of the materials. Therefore, while disclaiming responsibility, it is declared that the responsibility for any decision-making, action, and potential profit and loss in the capital market and cryptocurrency market lies with the trader.