
IOTA
IOTA
| تریدر | نوع سیگنال | حد سود/ضرر | زمان انتشار | مشاهده پیام |
|---|---|---|---|---|
No results found. | ||||
Price Chart of IOTA
سود 3 Months :
سیگنالهای IOTA
Filter
Sort messages by
Trader Type
Time Frame

Bithereum_io
IOTAUSDT 12H
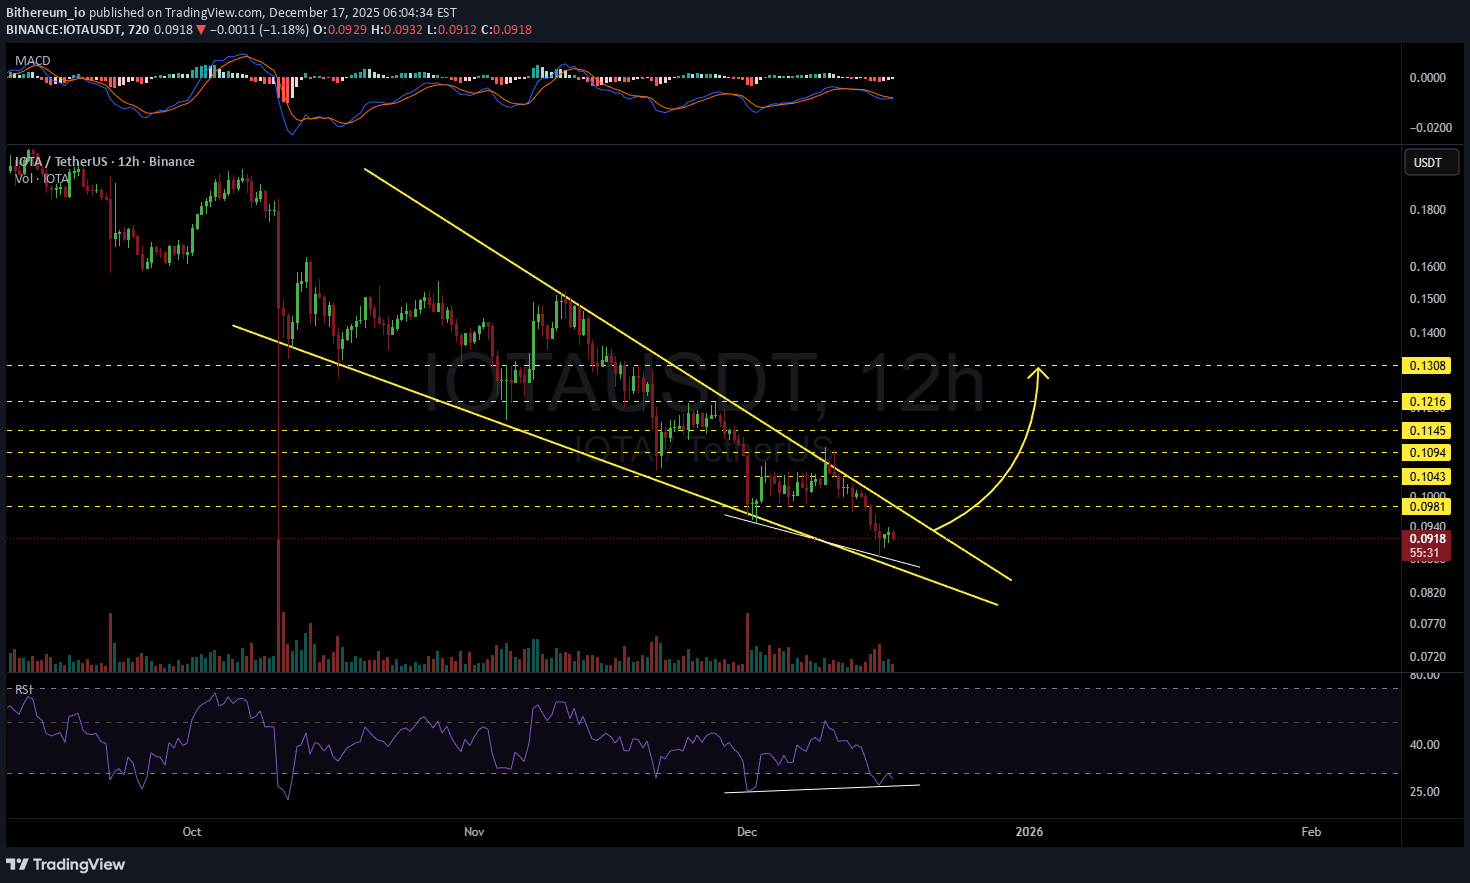
#IOTA is moving inside a falling wedge pattern on the 12H timeframe and has printed a bullish RSI divergence, so keep an eye on it. In case of a breakout above the wedge, the potential targets are: 🎯 $0.0981 🎯 $0.1043 🎯 $0.1094 🎯 $0.1145 🎯 $0.1216 🎯 $0.1308 ⚠️ Always remember to use a tight stop-loss and maintain proper risk management.

Cryptojobs
آیوتای آیندهساز: چرا این ارز دیجیتال در آستانه جهش ۳۰ درصدی است؟
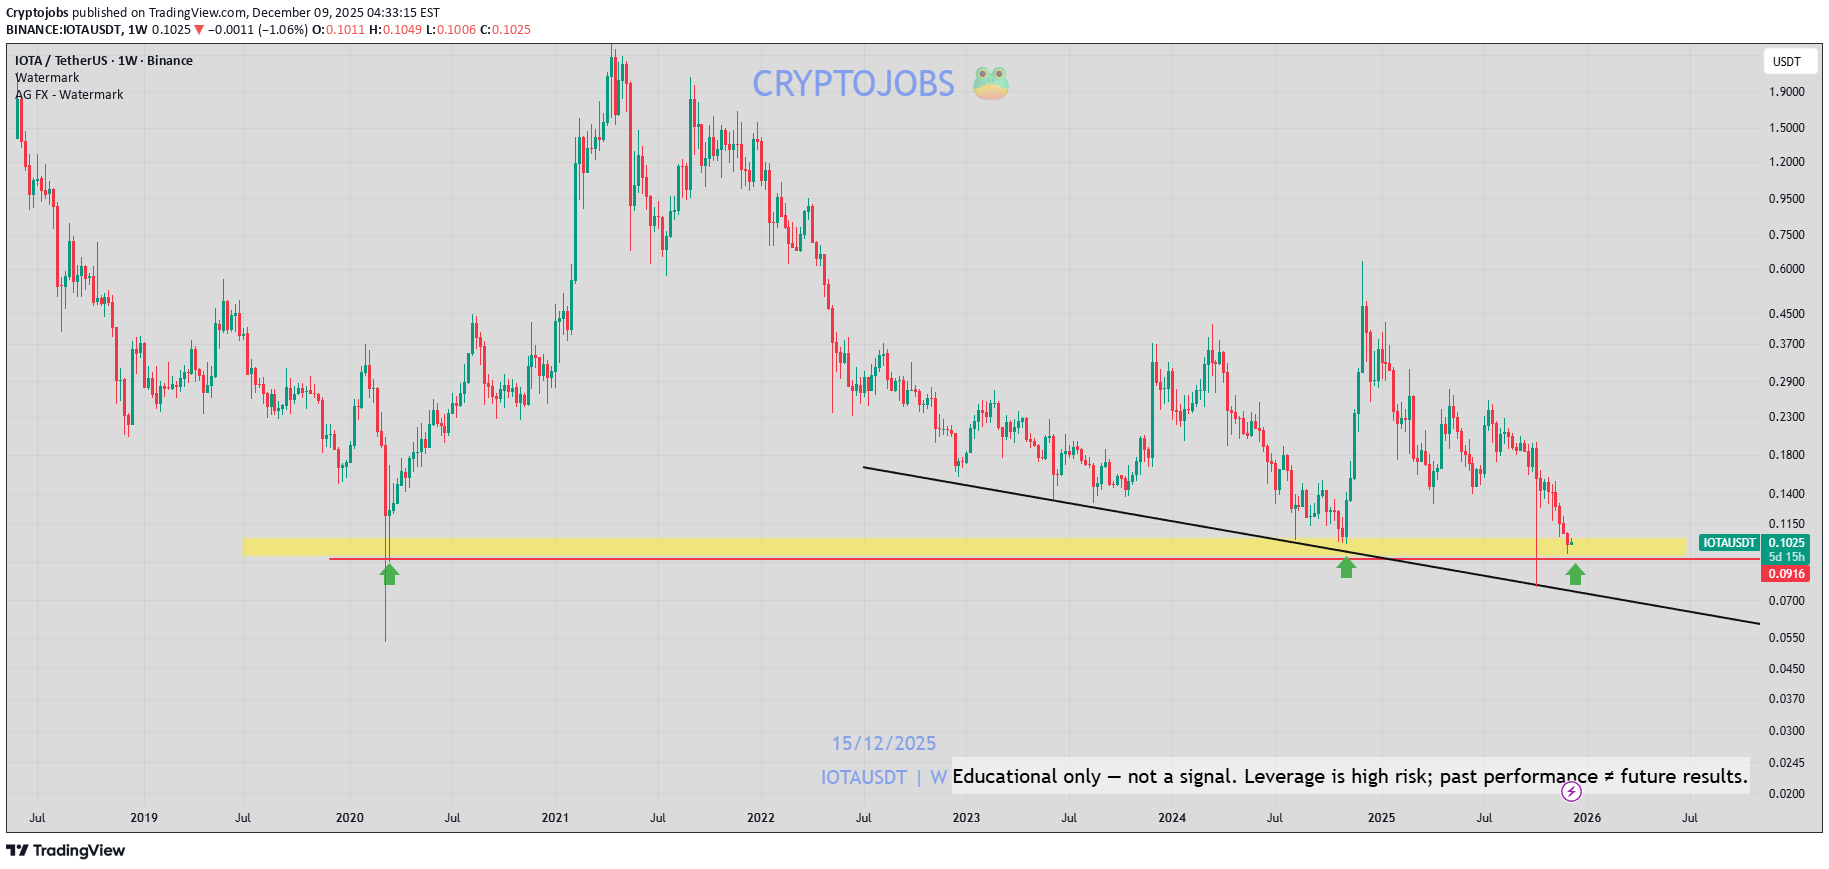
I'm bullish on IOTA 📈 10+ Years of building finally paying off! 🔥 Recent News: 🔸"IOTA is now connected to 150+ blockchains and 550+ assets, joining the global infrastructure that moves value across the internet." 🔸US expansion with @UpholdInc & Bitgo adding IOTA The combination of identity solutions, custody integrations, and cross-chain connectivity shows IOTA evolving from a concept into real-world infrastructure 🔥 Building infrastructure for mass adoption requires time, and we are getting close to seeing something huge 🚀 Technical outlook: ✅ Weekly support holding nicely - no break confirmation yet ⏳H4 falling wedge structure? Currently neutral on H4 - consolidating under the main downtrend. If bulls manage to break above, we could see a quick 30%+ move 📈 This should be an interesting play for whales. Wen moon? Soon™ 🌙 Not financial advice - DYOR & always manage your risk.

CryptoAnalystSignal
آیوت (IOTA) در آستانه انفجار قیمتی؛ تحلیل تکنیکال شانس صعود بزرگ را نشان میدهد!
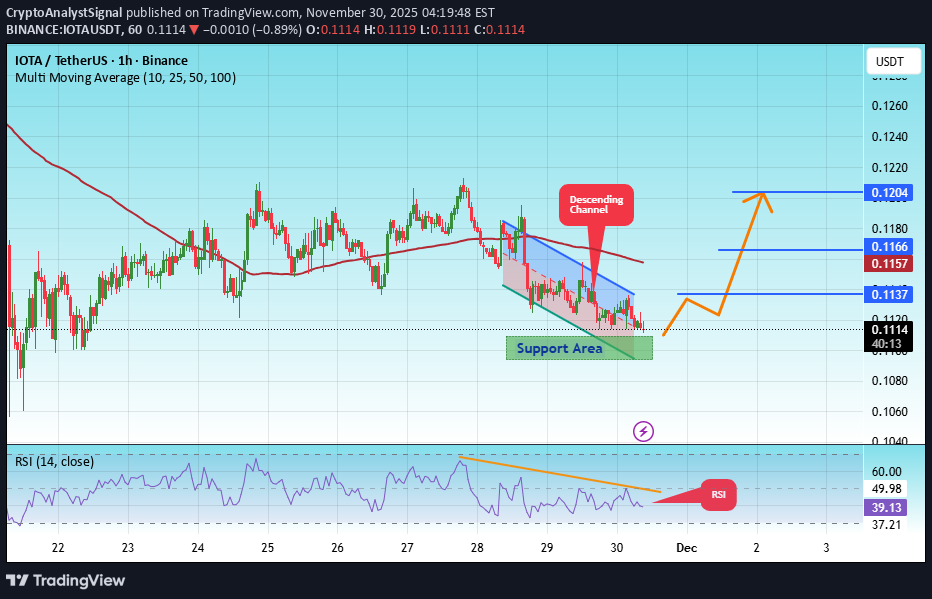
#IOTA The price is moving in a descending channel on the 1-hour timeframe. It has reached the lower boundary and is heading towards breaking above it, with a retest of the upper boundary expected. We have a downtrend on the RSI indicator, which has reached near the lower boundary, and an upward rebound is expected. There is a key support zone in green at 0.1100. The price has bounced from this level multiple times and is expected to bounce again. We have a trend towards consolidation above the 100-period moving average, as we are moving close to it, which supports the upward movement. Entry price: 0.1113 First target: 0.1137 Second target: 0.1166 Third target: 0.1204 Don't forget a simple principle: money management. Place your stop-loss below the support zone in green. For any questions, please leave a comment. Thank you.

CryptoWithJames
تحلیل تکنیکال آیوت، سیگنال انفجار قیمت از الگوی گُوِه نزولی!
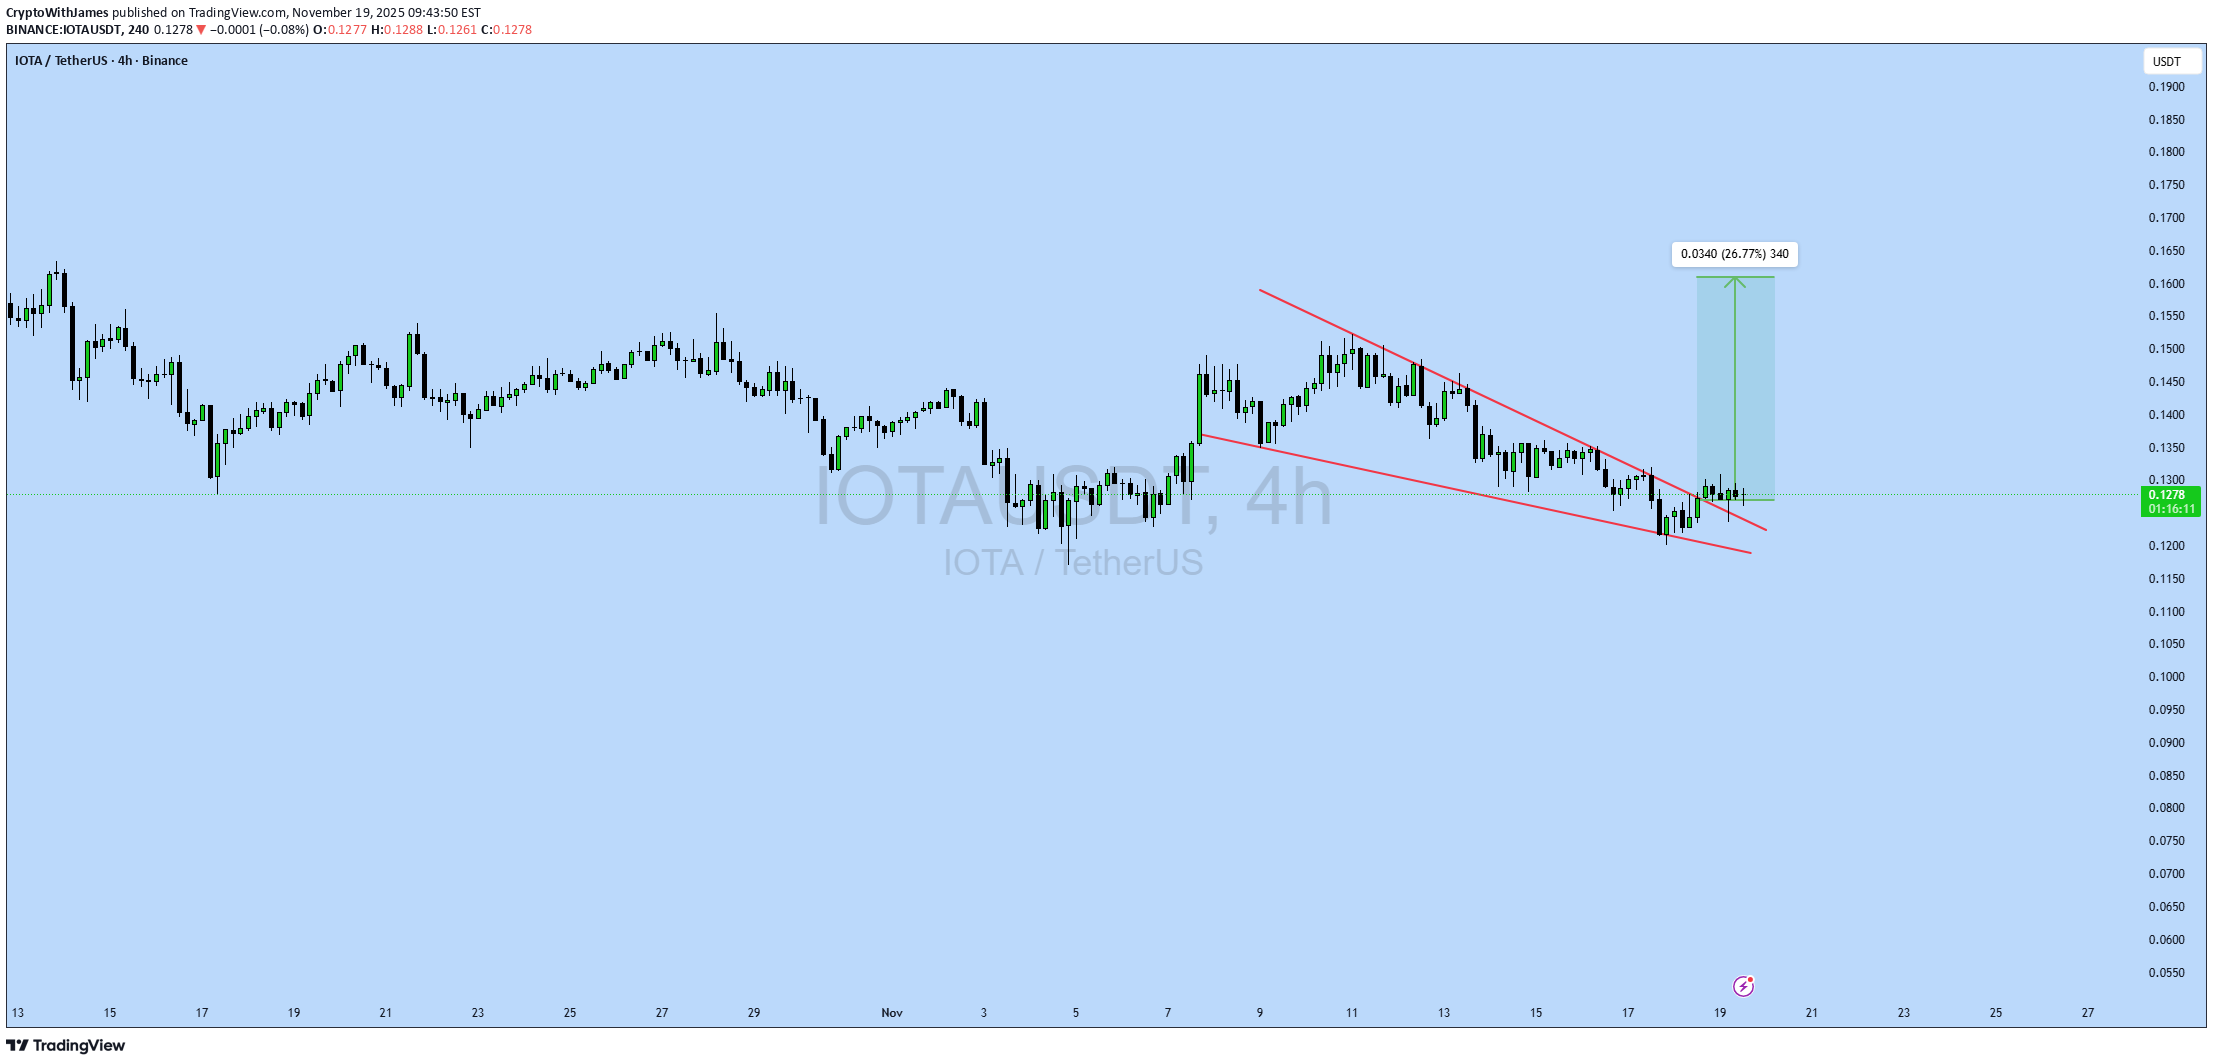
#IOTA UPDATE IOTA Technical Setup Pattern: Falling Wedge Pattern Current Price: $0.1272 Target Price: $0.1612 Target % Gain: 26.77% Technical Analysis: IOTA is breaking out of a falling wedge pattern on the 4H chart, signaling bullish potential. The price has moved above the wedge’s resistance trendline, showing early signs of momentum shifting upward. With the breakout confirmed, the price is positioned to move toward the projected target area if bullish pressure continues. Time Frame: 4H Risk Management Tip: Always use proper risk management.

asilturk
آیوتیا (IOTA): آیا تراز شدن کامل شد و غول اینترنت اشیا آماده صعود است؟

IOTA is an open source project based on distributed ledger technology (DLT), designed specifically for the Internet of Things (IoT) ecosystem. The Main Purpose of IOTA, which we added to the portfolio at the 0.1393$ price band with IOTA (miota), ranked 89th, with a market value of 640 Million dollars, 4.6 Billion total actual circulation units, 0.0155 dominance weight, 3.54 Platform Concentration value, is essentially an infrastructure where billions of devices (sensors, smart machines, vehicles, etc.) can safely transfer data and value with each other, free of charge. is to provide. The most critical feature that distinguishes IOTA from most traditional cryptocurrencies (such as Bitcoin, Ethereum) is that it uses a different data structure called Tangle instead of blockchain. Tangle is a data structure based on Directed Acyclic Graph (DAG) architecture. How It Works: When a user wants to make a transaction, they have to verify and confirm two previous transactions on the network before this new transaction is confirmed. This means that the verification burden is distributed to transacting users on the network rather than miners. Overall, IOTA offers an ambitious and different technology that aims to become the basis of machine economies, overcoming the “fee” and “scalability” problems in blockchain. From a technical perspective, I predict that a weekly trend has been formed, but the increases are limited due to the lack of sufficient volume, but gradual increases may occur in the coming days. I wish you pleasant spending.

bebush
آیوتای آماده انفجار: نقطه ورود طلایی و پیشبینی صعود بزرگ در بولران بعدی!
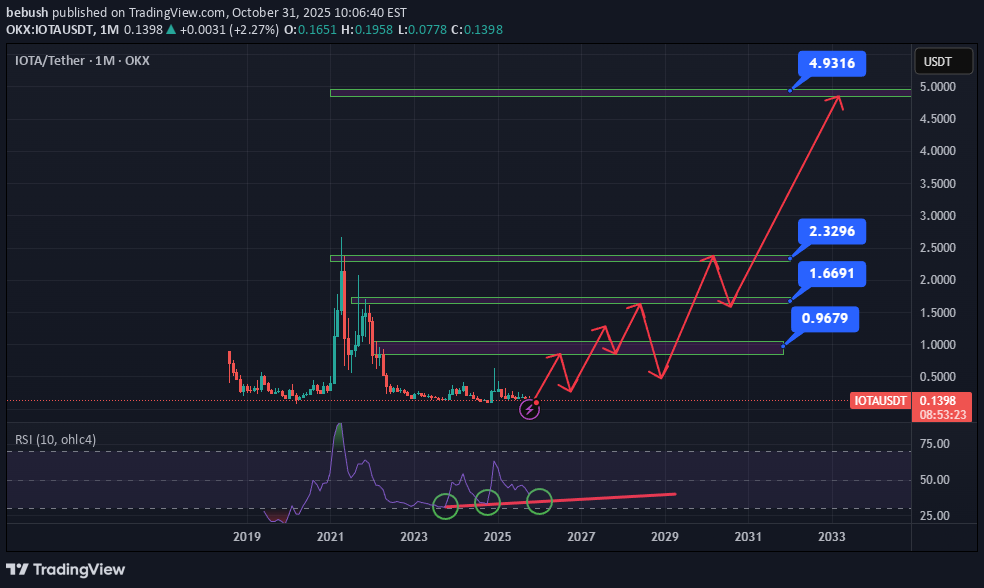
This is a long-term analysis of the IOTA cryptocurrency. All key levels have been identified, and considering the divergence formed in the RSI along with the marked collision points, the safe entry point is at the third collision with the RSI trend line and the reaction to it. I predict it will reach that area in January or February and start reacting. IOTAUSDT

CryptoNuclear
آیوتا (IOTA): آیا کف حمایتی تاریخی میشکند یا رالی بزرگ آغاز میشود؟

The IOTA/USDT (1W) chart is now entering a critical phase, potentially defining the major market direction heading into 2026. Price is currently hovering right above the key demand zone between $0.15 and $0.12 — a level that has acted as a multi-year support floor since 2022. Interestingly, the chart shows a long wick below the yellow box, followed by a strong recovery back inside the zone — a classic sign of liquidity absorption or a liquidity grab. This pattern often signals smart money accumulation and can mark the beginning of a macro reversal if confirmed by strong bullish weekly candles and increasing volume. However, on the broader structure, the market still maintains a series of lower highs since its 2021 peak — meaning that sellers continue to dominate the long-term structure. Therefore, a confirmed breakout remains essential before assuming any sustainable trend reversal. --- Technical Structure & Key Levels Major Support (Demand Zone): $0.15 – $0.12 → A historically strong area that has been tested multiple times over the past three years. How price reacts here will decide whether this is another accumulation phase or a breakdown setup. Immediate Resistance: $0.245 Mid-Term Resistances: $0.349 → $0.475 → $0.629 High-Value Targets: $0.898 → $1.491 → $2.39 Historical Low: $0.0534 (extreme capitulation level if breakdown occurs). --- Bullish Scenario — Potential Rebound from the Accumulation Zone If the weekly candle closes above $0.15 and shows a continuation pattern with increasing volume, a major rebound phase could begin. Step-by-step targets: 1. $0.245 → initial confirmation of reversal 2. $0.35 – $0.47 → mid-term swing targets 3. $0.63 – $0.89 → broader recovery range A decisive breakout above $0.245 would mark a shift from bearish to neutral-bullish structure, opening the door for a sustained recovery phase into 2026. --- Bearish Scenario — Breakdown Toward Historical Lows If the price closes below $0.12 on a weekly timeframe, the bearish scenario becomes dominant. Next potential downside targets: $0.08 → psychological support $0.0534 → historical capitulation zone Failure to defend this range would indicate that buyers have lost control, likely triggering a new macro downtrend that revisits multi-year lows. --- Conclusion The $0.15–$0.12 zone remains the key battlefield between long-term buyers and sellers. A successful rebound could mark the start of a new accumulation phase, while a clear breakdown would confirm another leg of the bearish cycle. The upcoming weekly close will be crucial to determine which side gains dominance. --- #IOTA #IOTAUSDT #CryptoAnalysis #TechnicalAnalysis #Altcoin #CryptoTrading #SupportResistance #CryptoBullish #CryptoBearish #MarketStructure #PriceAction #SwingTrade
Bithereum_io
آیا آیوتا (IOTA) به زودی منفجر میشود؟ سطوح خرید و اهداف قیمتی شگفتانگیز!

#IOTA is testing the descending resistance and the SMA200 on the daily chart. Consider buying here and near the support levels of $0.1663 and $0.1471. In case of a breakout above both, the potential targets are: 🎯 $0.2037 🎯 $0.2409 🎯 $0.2711 🎯 $0.3012 🎯 $0.3441 🎯 $0.3987 ⚠️ Always remember to use a tight stop-loss and maintain proper risk management.

آیوتا و اینترنت اشیا: غول خفتهای که به زودی بازار را فتح میکند!

MyCryptoParadise
IOTAUSDT: Will Bulls Break Free or Bears Take Full Control?
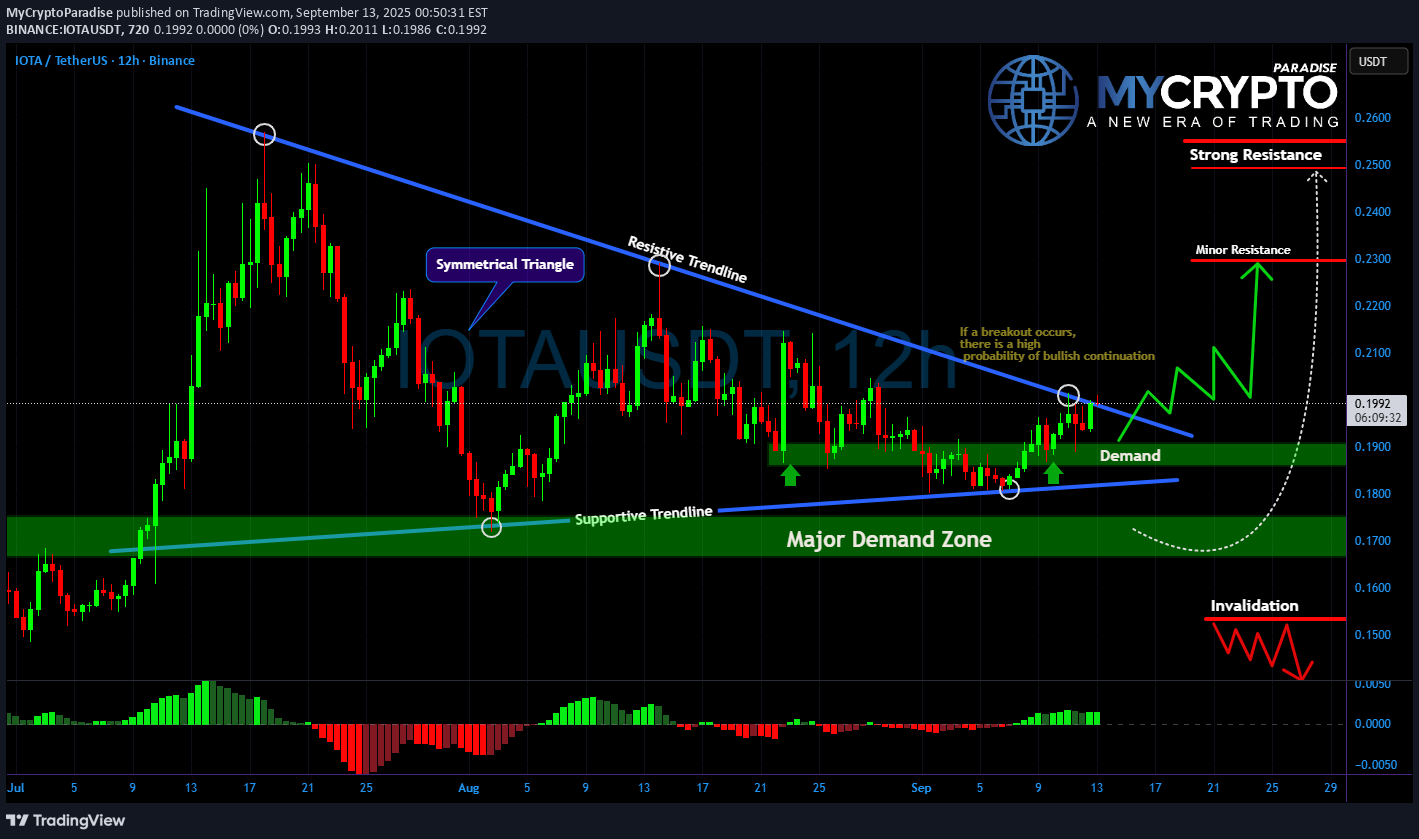
Yello, Paradisers are you prepared for what could be the most decisive moment for #IOTAUSDT this quarter? Price action is tightening and the pressure is building, but only one side will win this battle. The question is: will it be the bulls or the bears? 💎For weeks, #IOTA has been respecting a broad symmetrical structure while staying firmly above the demand zone between $0.1700–$0.1800. Every dip into this area has attracted aggressive buyers, confirming it as a strong accumulation base. From here, price has been coiling tighter beneath the descending resistance trendline that has capped rallies since July. 💎Right now, #IOTA trades near $0.2000. A clean breakout above the trendline could unlock sharp momentum, with $0.2300 as the first resistance target and $0.2500 as the critical level that would confirm renewed bullish strength. Breaking these levels would shift sentiment decisively back into bullish territory. 💎But the warning signs are clear: if buyers fail to defend the current demand zone, sellers could drag the price back toward $0.1700–$0.1800. A breakdown below $0.1500 would give bears complete control, flipping the structure bearish and erasing months of accumulation. 💎From a fundamental perspective, #IOTAUSD continues to face a mixed outlook. While its technology is promising with use cases in IoT and feeless transactions, market adoption remains slow and competition in the smart contract and data-sharing space is intense. Current macroeconomic uncertainty and risk-off behavior in crypto also limit speculative inflows into smaller-cap projects like #IOTA. This means even technically bullish setups remain vulnerable to shifts in overall market sentiment. The market is compressing, and the breakout is imminent. Timing and discipline will decide whether this move becomes a big win or a costly trap. MyCryptoParadise iFeel the success🌴
Disclaimer
Any content and materials included in Sahmeto's website and official communication channels are a compilation of personal opinions and analyses and are not binding. They do not constitute any recommendation for buying, selling, entering or exiting the stock market and cryptocurrency market. Also, all news and analyses included in the website and channels are merely republished information from official and unofficial domestic and foreign sources, and it is obvious that users of the said content are responsible for following up and ensuring the authenticity and accuracy of the materials. Therefore, while disclaiming responsibility, it is declared that the responsibility for any decision-making, action, and potential profit and loss in the capital market and cryptocurrency market lies with the trader.