
IOST
IOST
| تریدر | نوع سیگنال | حد سود/ضرر | زمان انتشار | مشاهده پیام |
|---|---|---|---|---|
 Alpha-GoldFXRank: 32441 | خرید | حد سود: تعیین نشده حد ضرر: تعیین نشده | 1/1/2026 |
Price Chart of IOST
سود 3 Months :
سیگنالهای IOST
Filter
Sort messages by
Trader Type
Time Frame
Alpha-GoldFX
IOSTUSDT Forming Falling Wedge

IOSTUSDT is forming a clear falling wedge pattern, a classic bullish reversal signal that often indicates an upcoming breakout. The price has been consolidating within a narrowing range, suggesting that selling pressure is weakening while buyers are beginning to regain control. With consistent volume confirming accumulation at lower levels, the setup hints at a potential bullish breakout soon. The projected move could lead to an impressive gain of around 90% to 100% once the price breaks above the wedge resistance. This falling wedge pattern is typically seen at the end of downtrends or corrective phases, and it represents a potential shift in market sentiment from bearish to bullish. Traders closely watching IOSTUSDT are noting the strengthening momentum as it nears a breakout zone. The good trading volume adds confidence to this pattern, showing that market participants are positioning early in anticipation of a reversal. Investors’ growing interest in IOSTUSDT reflects rising confidence in the project’s long-term fundamentals and current technical strength. If the breakout confirms with sustained volume, this could mark the start of a fresh bullish leg. Traders might find this a valuable setup for medium-term gains, especially as the wedge pattern completes and buying momentum accelerates. ✅ Show your support by hitting the like button and ✅ Leaving a comment below! (What is your opinion about this Coin?) Your feedback and engagement keep me inspired to share more insightful market analysis with you!

iMoneyTeam
IOTXUSDT Sell/Short Signal (15M)
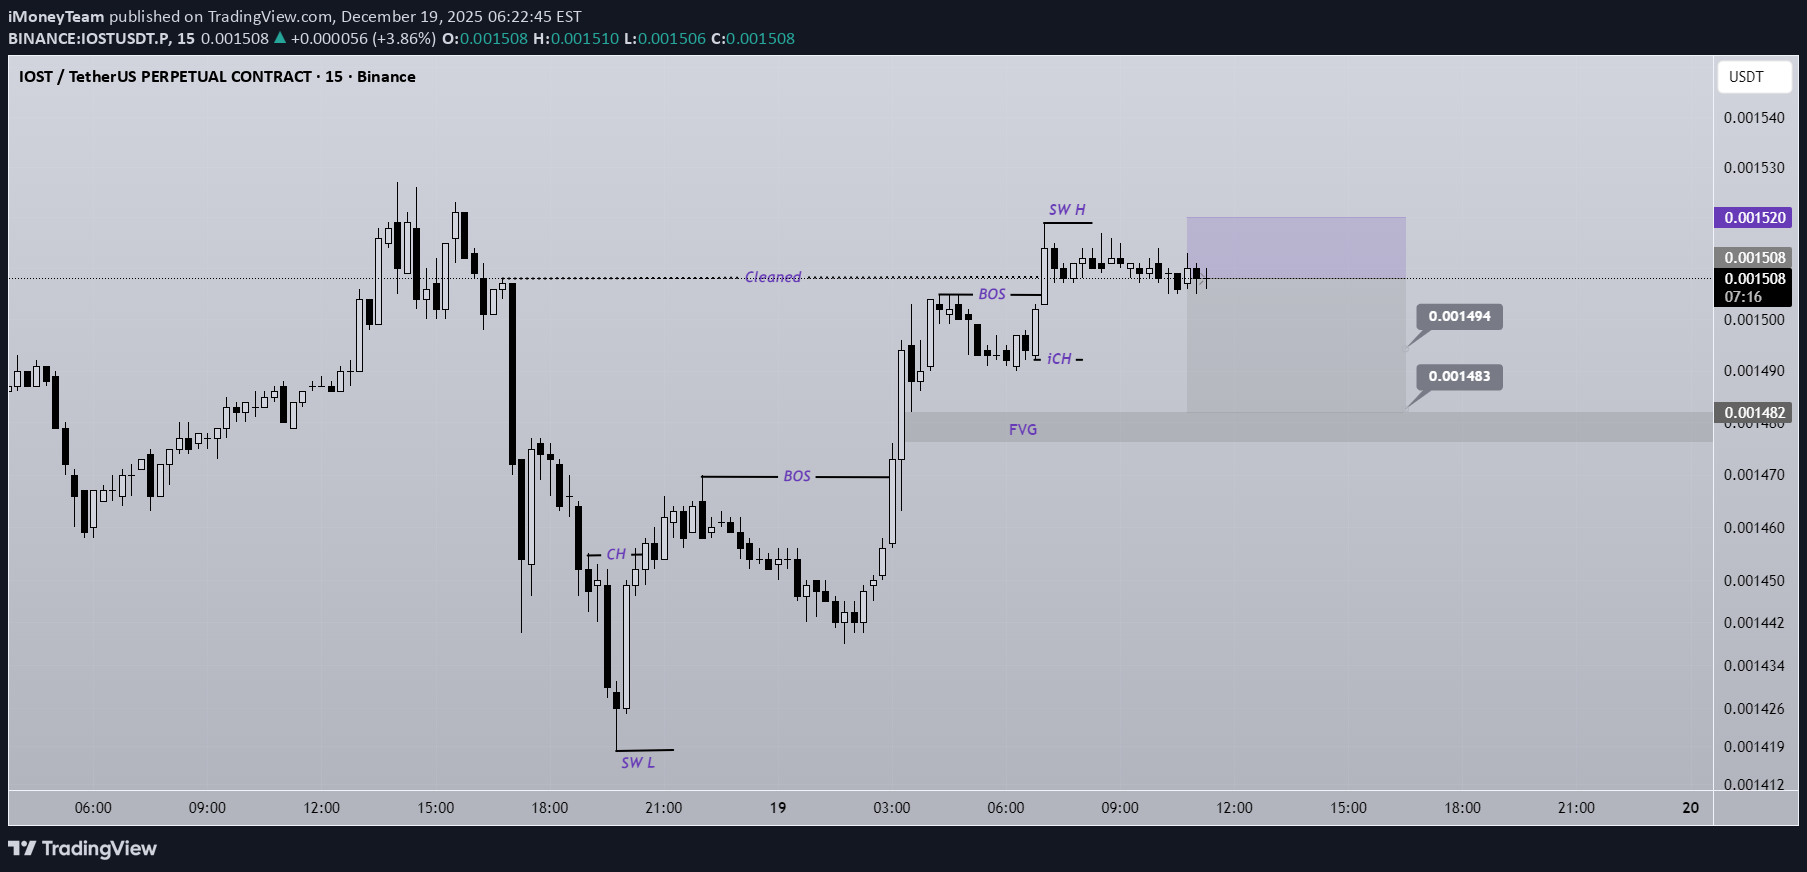
Considering that the sell orders of the 4-hour order block have been absorbed, we can expect an internal pullback on lower timeframes. The entry zone and targets are marked on the chart. After the first target is reached, secure partial profits and then move the stop loss to breakeven Do not enter the position without capital management and stop setting Comment if you have any questions thank you

asilturk
آپدیت IOST: پایان اصلاحات و آغاز حرکت انفجاری (تله خرس تمام شد؟)
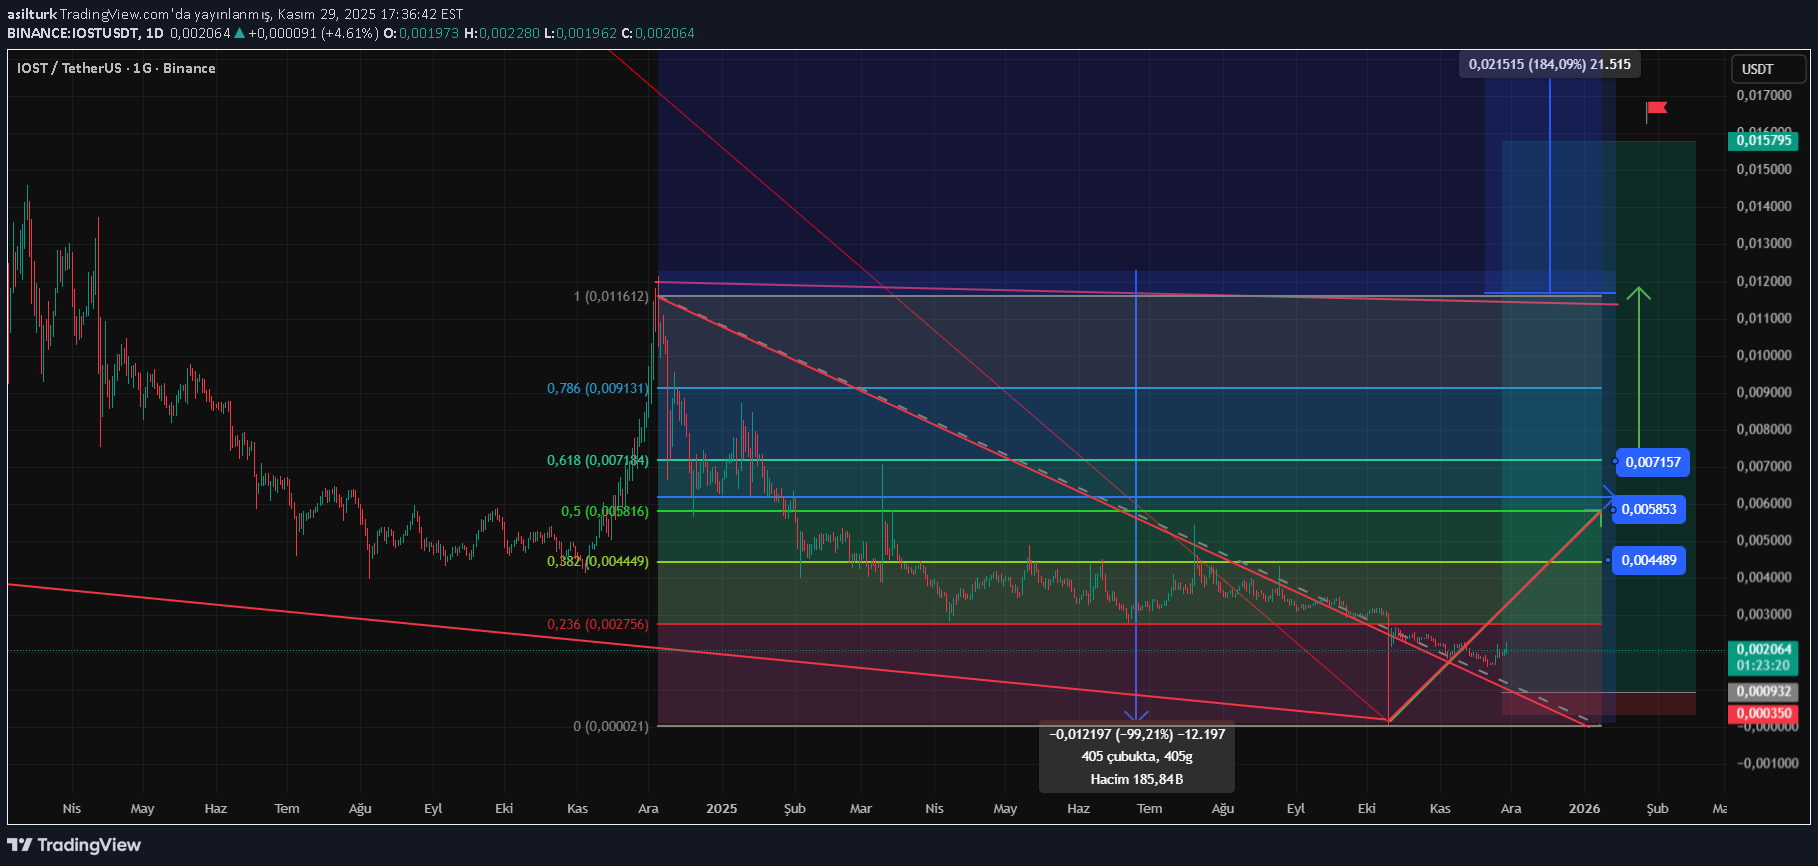
IOST is a decentralized service network designed for high transaction speeds and scalability. Key Difference: It uses an innovative consensus mechanism called Proof of Believability (PoB). This mechanism aims to balance both speed (up to 100,000 TPS claimed) and decentralization. When we examine it from a technical perspective, we can say that the momentum decline has stopped and a potential recovery process has started. The MACD histogram turning positive may occur in the short term, without expecting harsh and sudden price movements. Corrections and hard sales may occur at the FIBO levels that I have specified as sequential targets. However, I predict that positive movements will occur as a result. I wish you good investments.

CryptoWithJames
تحلیل تکنیکال IOST: آماده پرش ۸۰ درصدی با شکست الگوی گُوِه نزولی؟
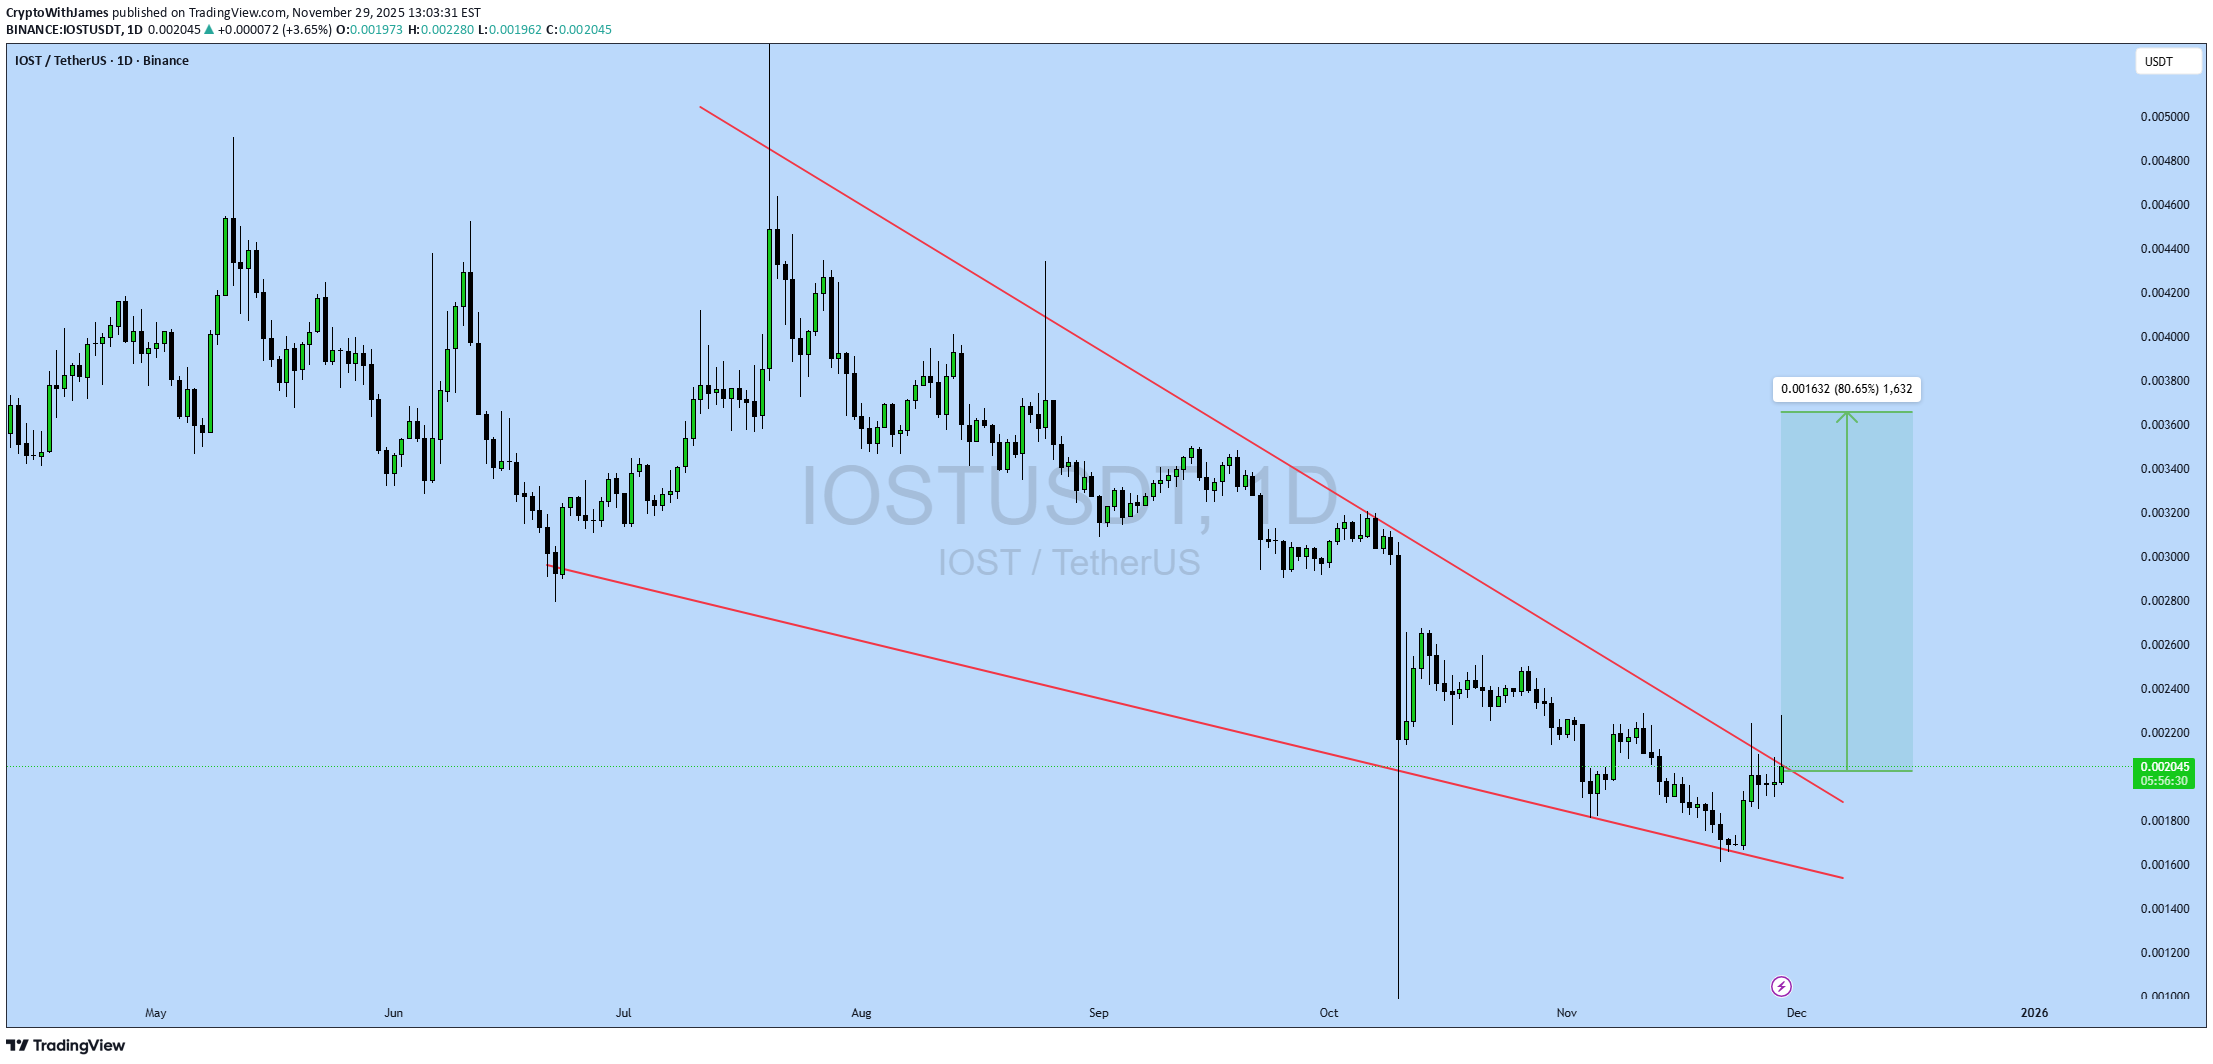
#IOST UPDATE IOST Technical Setup Pattern: Falling Wedge Pattern Current Price: $0.00205 Target Price: $0.00368 Target % Gain: 80.65% Technical Analysis: IOST is breaking out of a falling wedge pattern on the 1D chart, indicating strong bullish reversal potential. Price has pushed above the descending resistance trendline after prolonged compression, confirming the breakout structure. The measured move from the wedge projects toward the highlighted upside target zone, aligning with previous resistance levels. Holding above the breakout region keeps the bullish scenario intact and supports continuation higher. Time Frame: 1D Risk Management Tip: Always use proper risk management.
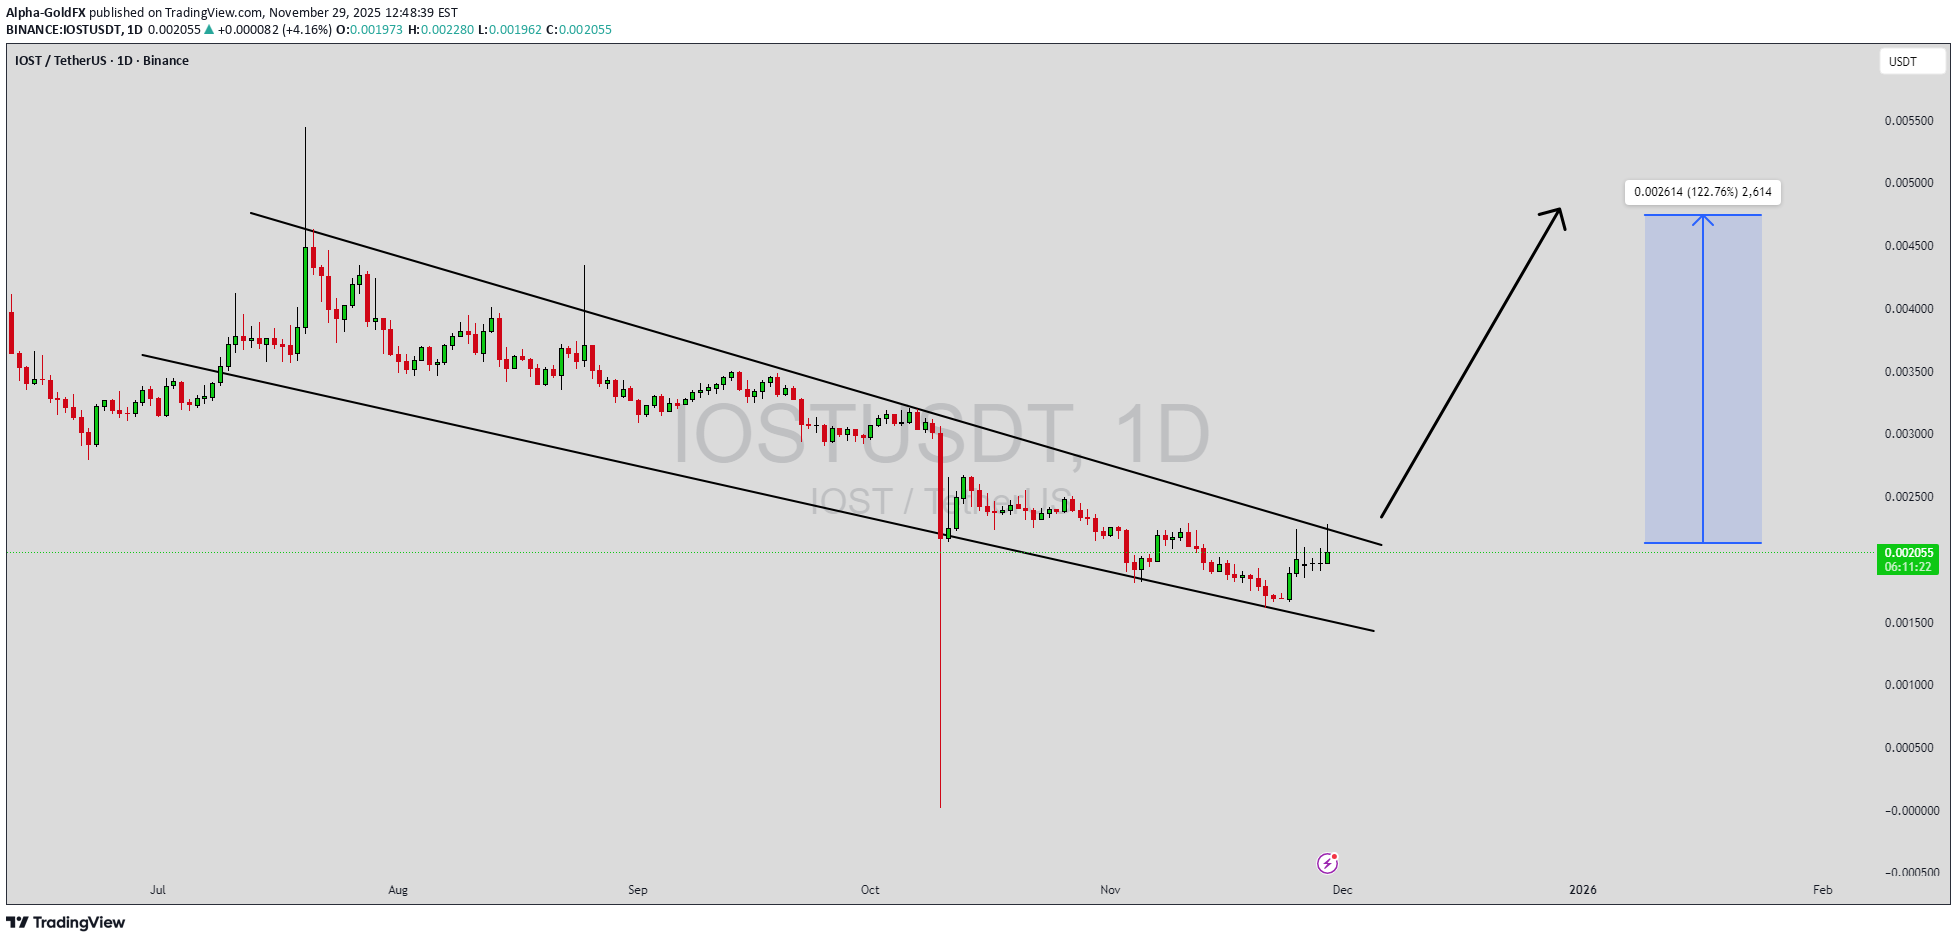
Alpha-GoldFX
الگوی گُوِه نزولی ORCAUSDT: آماده انفجار 100 درصدی؟

ORCAUSDT is forming a clear falling wedge pattern, a classic bullish reversal signal that often indicates an upcoming breakout. The price has been consolidating within a narrowing range, suggesting that selling pressure is weakening while buyers are beginning to regain control. With consistent volume confirming accumulation at lower levels, the setup hints at a potential bullish breakout soon. The projected move could lead to an impressive gain of around 90% to 100% once the price breaks above the wedge resistance. This falling wedge pattern is typically seen at the end of downtrends or corrective phases, and it represents a potential shift in market sentiment from bearish to bullish. Traders closely watching ORCAUSDT are noting the strengthening momentum as it nears a breakout zone. The good trading volume adds confidence to this pattern, showing that market participants are positioning early in anticipation of a reversal. Investors’ growing interest in ORCAUSDT reflects rising confidence in the project’s long-term fundamentals and current technical strength. If the breakout confirms with sustained volume, this could mark the start of a fresh bullish leg. Traders might find this a valuable setup for medium-term gains, especially as the wedge pattern completes and buying momentum accelerates. ✅ Show your support by hitting the like button and ✅ Leaving a comment below! (What is your opinion about this Coin?) Your feedback and engagement keep me inspired to share more insightful market analysis with you!
Alpha-GoldFX
سیگنال انفجاری IOST: الگوی گوه نزولی نویدبخش رشد 100 درصدی!
IOSTUSDT is forming a clear falling wedge pattern, a classic bullish reversal signal that often indicates an upcoming breakout. The price has been consolidating within a narrowing range, suggesting that selling pressure is weakening while buyers are beginning to regain control. With consistent volume confirming accumulation at lower levels, the setup hints at a potential bullish breakout soon. The projected move could lead to an impressive gain of around 90% to 100% once the price breaks above the wedge resistance. This falling wedge pattern is typically seen at the end of downtrends or corrective phases, and it represents a potential shift in market sentiment from bearish to bullish. Traders closely watching IOSTUSDT are noting the strengthening momentum as it nears a breakout zone. The good trading volume adds confidence to this pattern, showing that market participants are positioning early in anticipation of a reversal. Investors’ growing interest in IOSTUSDT reflects rising confidence in the project’s long-term fundamentals and current technical strength. If the breakout confirms with sustained volume, this could mark the start of a fresh bullish leg. Traders might find this a valuable setup for medium-term gains, especially as the wedge pattern completes and buying momentum accelerates. ✅ Show your support by hitting the like button and ✅ Leaving a comment below! (What is your opinion about this Coin?) Your feedback and engagement keep me inspired to share more insightful market analysis with you!

Bithereum_io
تحلیل روزانه IOST: آیا زمان خیزش بزرگ فرا رسیده است؟ (اهداف صعودی جذاب)
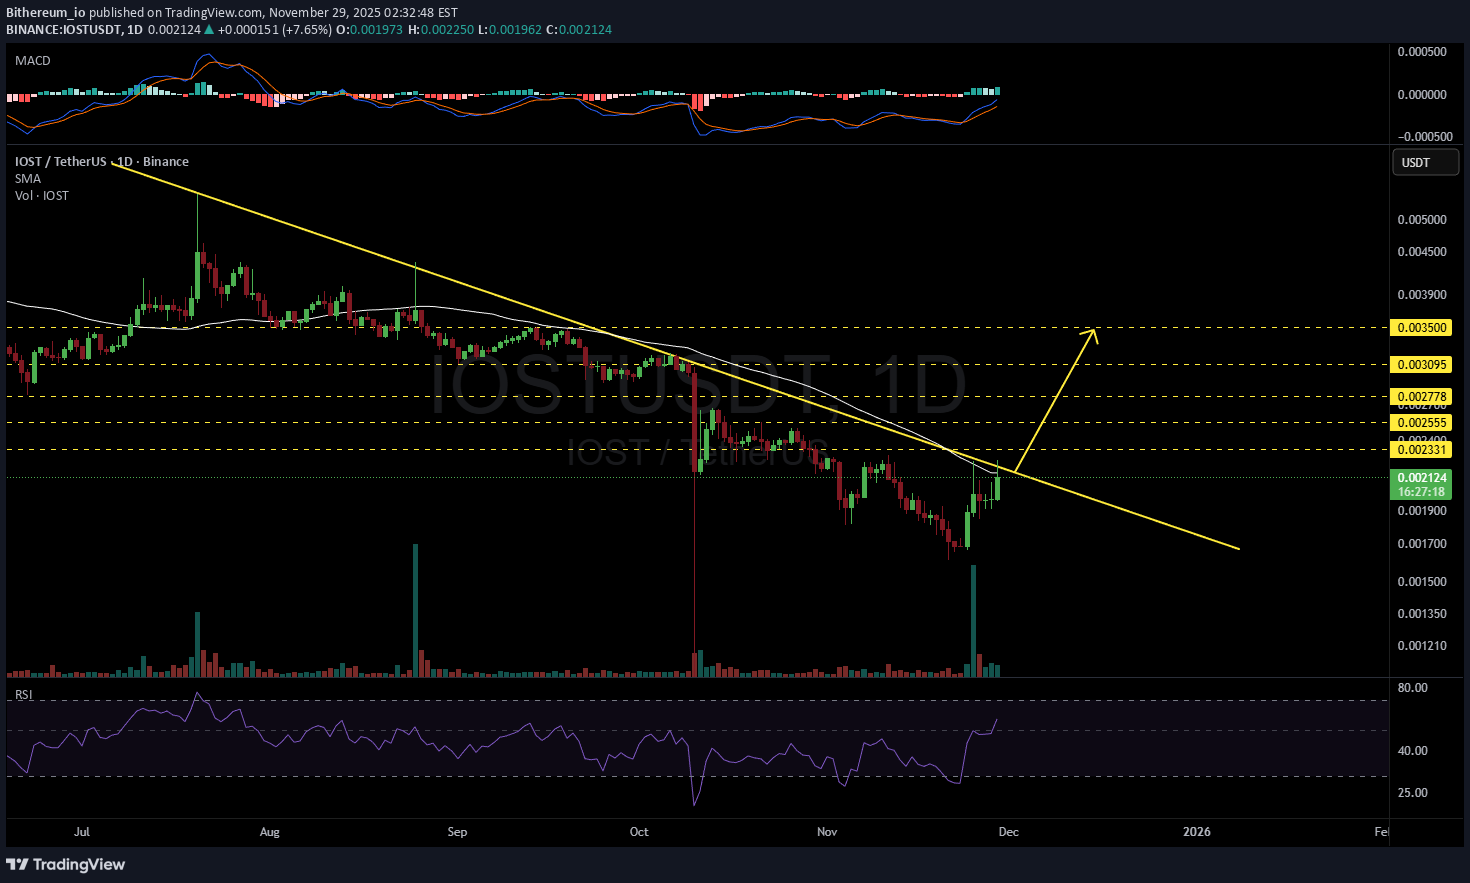
#IOST is on the verge of breaking above the descending resistance and the SMA50 on the daily chart. RSI and MACD indicate the possibility of further bullish momentum. Keep an eye on it. If a breakout confirms, the potential upside targets are: 🎯 $0.002331 🎯 $0.002555 🎯 $0.002778 🎯 $0.003095 🎯 $0.003500 ⚠️ Always remember to use a tight stop-loss and maintain proper risk management.
Alpha-GoldFX
سیگنال انفجاری IOST: آیا رشد 50 درصدی در راه است؟ (الگوی گُوِه نزولی شگفتانگیز)
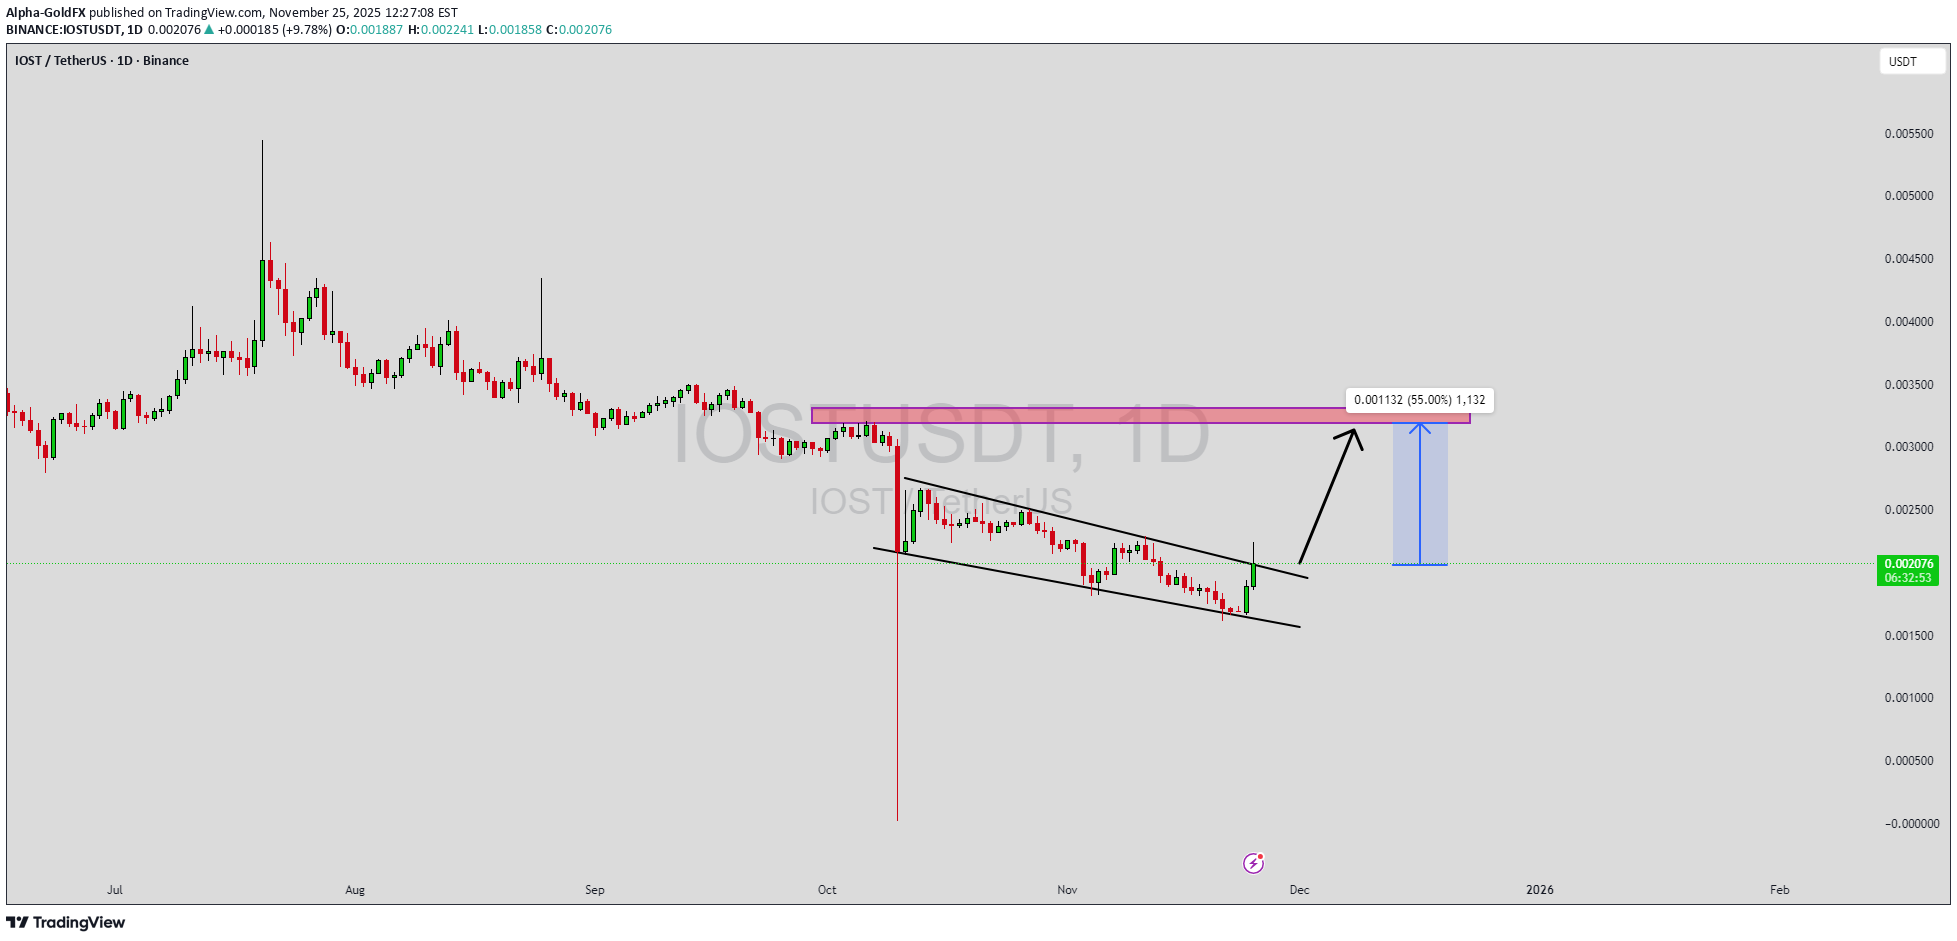
IOSTUSDT is forming a clear falling wedge pattern, a classic bullish reversal signal that often indicates an upcoming breakout. The price has been consolidating within a narrowing range, suggesting that selling pressure is weakening while buyers are beginning to regain control. With consistent volume confirming accumulation at lower levels, the setup hints at a potential bullish breakout soon. The projected move could lead to an impressive gain of around 40% to 50% once the price breaks above the wedge resistance. This falling wedge pattern is typically seen at the end of downtrends or corrective phases, and it represents a potential shift in market sentiment from bearish to bullish. Traders closely watching IOSTUSDT are noting the strengthening momentum as it nears a breakout zone. The good trading volume adds confidence to this pattern, showing that market participants are positioning early in anticipation of a reversal. Investors’ growing interest in IOSTUSDT reflects rising confidence in the project’s long-term fundamentals and current technical strength. If the breakout confirms with sustained volume, this could mark the start of a fresh bullish leg. Traders might find this a valuable setup for medium-term gains, especially as the wedge pattern completes and buying momentum accelerates. ✅ Show your support by hitting the like button and ✅ Leaving a comment below! (What is your opinion about this Coin?) Your feedback and engagement keep me inspired to share more insightful market analysis with you!

JBDigital_Network
IOST From 10 Jul to 08 Oct 2025 $3MM Buyback

IOST has initiated a $3M USD buyback program as part of their ongoing commitment to ecosystem strength and growth. Thats pure Bullish signal

CryptoNuclear
IOSTUSDT — At a Major Crossroad: Accumulation or Breakdown?
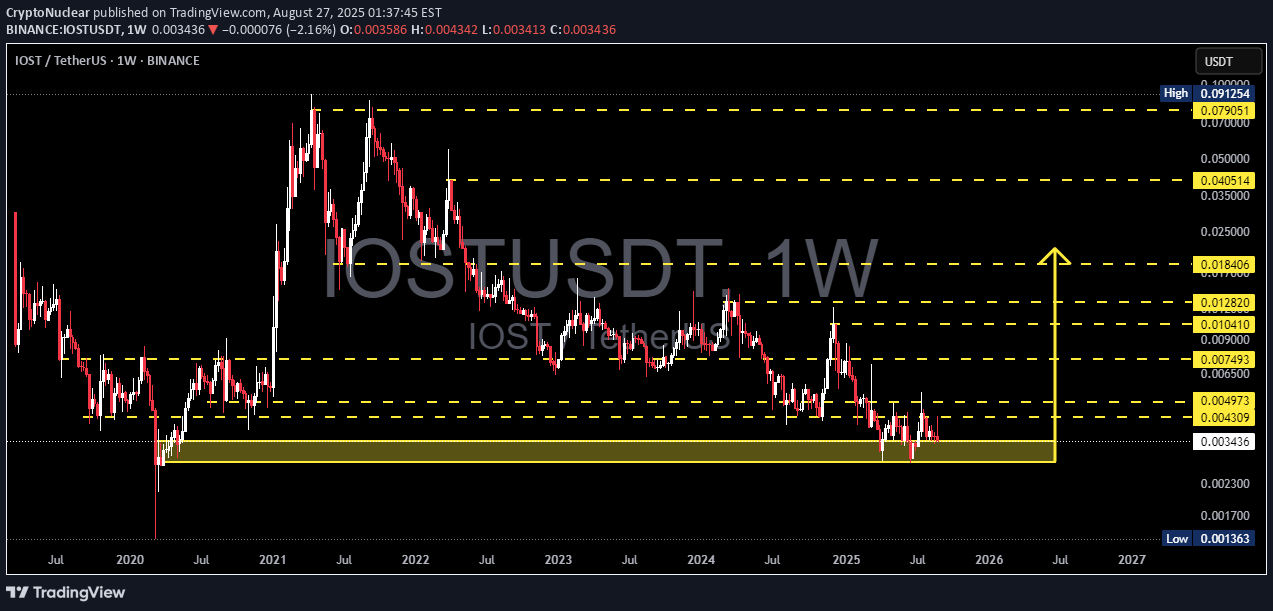
🔎 Overview IOST is currently trading inside a multi-year demand zone (0.0024–0.0037) which has repeatedly acted as a strong support since 2019. Each touch of this area has been met with buying interest, leaving long rejection wicks and suggesting hidden accumulation. However, the broader market structure remains bearish, with a clear series of lower highs since 2021. This puts the market at a critical juncture: ➡️ Will this demand zone once again serve as a base for accumulation and trigger a major reversal? ➡️ Or will selling pressure finally push price below the floor, opening the path to historical lows at 0.00136? --- 📌 Key Technical Levels Critical Demand Zone: 0.0024 – 0.0037 Nearest Resistance: 0.004309 → 0.004973 Mid-Term Targets: 0.007493 → 0.00900 – 0.01041 Trend Pivot: 0.01282 (a breakout here could shift the macro trend bullish) Swing Bullish Targets: 0.018406 → 0.040514 → 0.079051 Major Invalidation: Weekly close below 0.0024 = risk of continuation down to 0.00136 --- 🟢 Bullish Scenario 1. Early Confirmation: Weekly close above 0.004309 signals the first sign of buyers stepping in. 2. Minor Range Break: Breaking 0.004973 opens the way to 0.007493. 3. Momentum Expansion: Close above 0.007493 would target the supply zone at 0.009 – 0.01041. 4. Full Reversal: Sustained weekly close above 0.01282 could mark the end of the multi-year downtrend, unlocking upside potential toward 0.018406 and possibly higher (0.040–0.079). --- 🔴 Bearish Scenario 1. Failure to break 0.004309 – 0.004973 and another rejection may pull price back into the demand zone (0.0024–0.0037). 2. A weekly close below 0.0024 would confirm a breakdown from demand. 3. Next downside target lies at 0.00136 (historical low), a possible capitulation area before any larger rebound. --- 📐 Pattern & Market Behavior Range-Bound Accumulation: Current structure is trapped in a narrow 0.0030 – 0.0049 range. Breakout in either direction will define the next major move. Potential Wyckoff Spring: The repeated wicks below demand suggest liquidation + buyer absorption, a common pattern before strong markups. But caution: Without a breakout confirmation above resistance, this may still turn into a bull trap. --- 🎯 Trading Idea (Not Financial Advice) Aggressive Play: Enter within demand 0.0024–0.0037, SL below 0.0024, take partial profits at 0.00431 & 0.00497. Conservative Play: Wait for a confirmed breakout above 0.00497 and enter on a retest, targeting 0.00749 – 0.01041. Risk Management: Keep positions small; volatility on small-cap alts can be extremely high. --- 📝 Conclusion IOST stands at a major decision point. As long as it holds above the multi-year demand, the case for accumulation and reversal remains alive. But if demand fails, the market could revisit 0.00136. Staying disciplined at the key levels is crucial to avoid being caught in false moves. #IOST #IOSTUSDT #Crypto #Altcoin #PriceAction #TechnicalAnalysis #SupportResistance #DemandZone #Breakout #SwingTrade #RiskManagement #DYOR
Disclaimer
Any content and materials included in Sahmeto's website and official communication channels are a compilation of personal opinions and analyses and are not binding. They do not constitute any recommendation for buying, selling, entering or exiting the stock market and cryptocurrency market. Also, all news and analyses included in the website and channels are merely republished information from official and unofficial domestic and foreign sources, and it is obvious that users of the said content are responsible for following up and ensuring the authenticity and accuracy of the materials. Therefore, while disclaiming responsibility, it is declared that the responsibility for any decision-making, action, and potential profit and loss in the capital market and cryptocurrency market lies with the trader.