
HOT
Holo
| تریدر | نوع سیگنال | حد سود/ضرر | زمان انتشار | مشاهده پیام |
|---|---|---|---|---|
No results found. | ||||
Price Chart of Holo
سود 3 Months :
سیگنالهای Holo
Filter
Sort messages by
Trader Type
Time Frame

CryptoAnalystSignal
#HOT/USDT — Testing Demand Zone: Major Accumulation or Breakdo
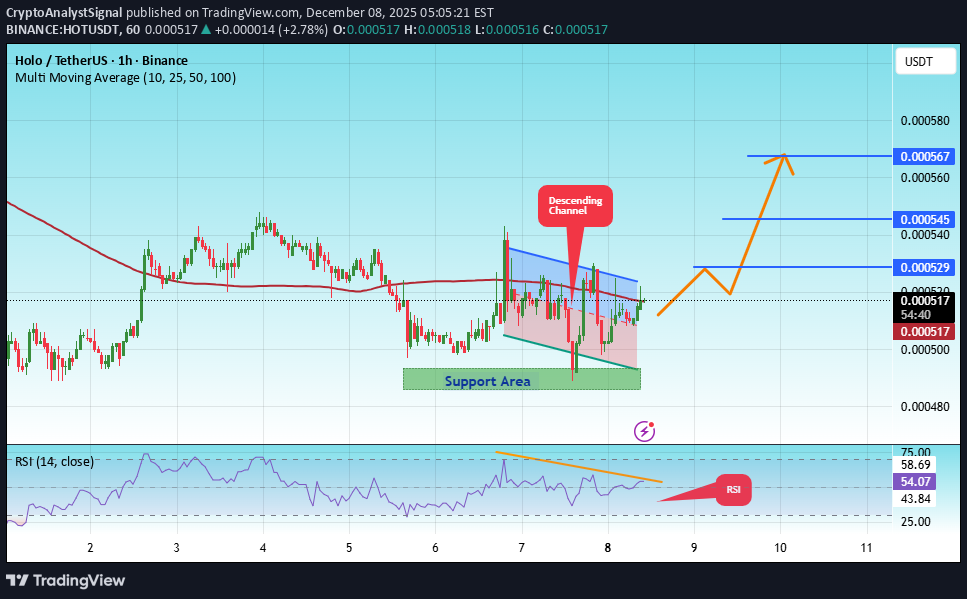
#HOT The price is moving in a descending channel on the 1-hour timeframe. It has reached the lower boundary and is heading towards breaking above it, with a retest of the upper boundary expected. We have a downtrend on the RSI indicator, which has reached near the lower boundary, and an upward rebound is expected. There is a key support zone in green at 0.000490. The price has bounced from this zone multiple times and is expected to bounce again. We have a trend towards consolidation above the 100-period moving average, as we are moving close to it, which supports the upward movement. Entry price: 0.000517 First target: 0.000529 Second target: 0.000545 Third target: 0.000567 Don't forget a simple principle: money management. Place your stop-loss below the support zone in green. For any questions, please leave a comment. Thank you.#HOT First target: 0.000529 Reached Second target: 0.000545 Reached Third target: 0.000567 Reached
CryptoAnalystSignal
احتمال انفجار قیمت HOT: آیا منطقه حمایتی کلیدی، مسیر صعود را تعیین میکند؟
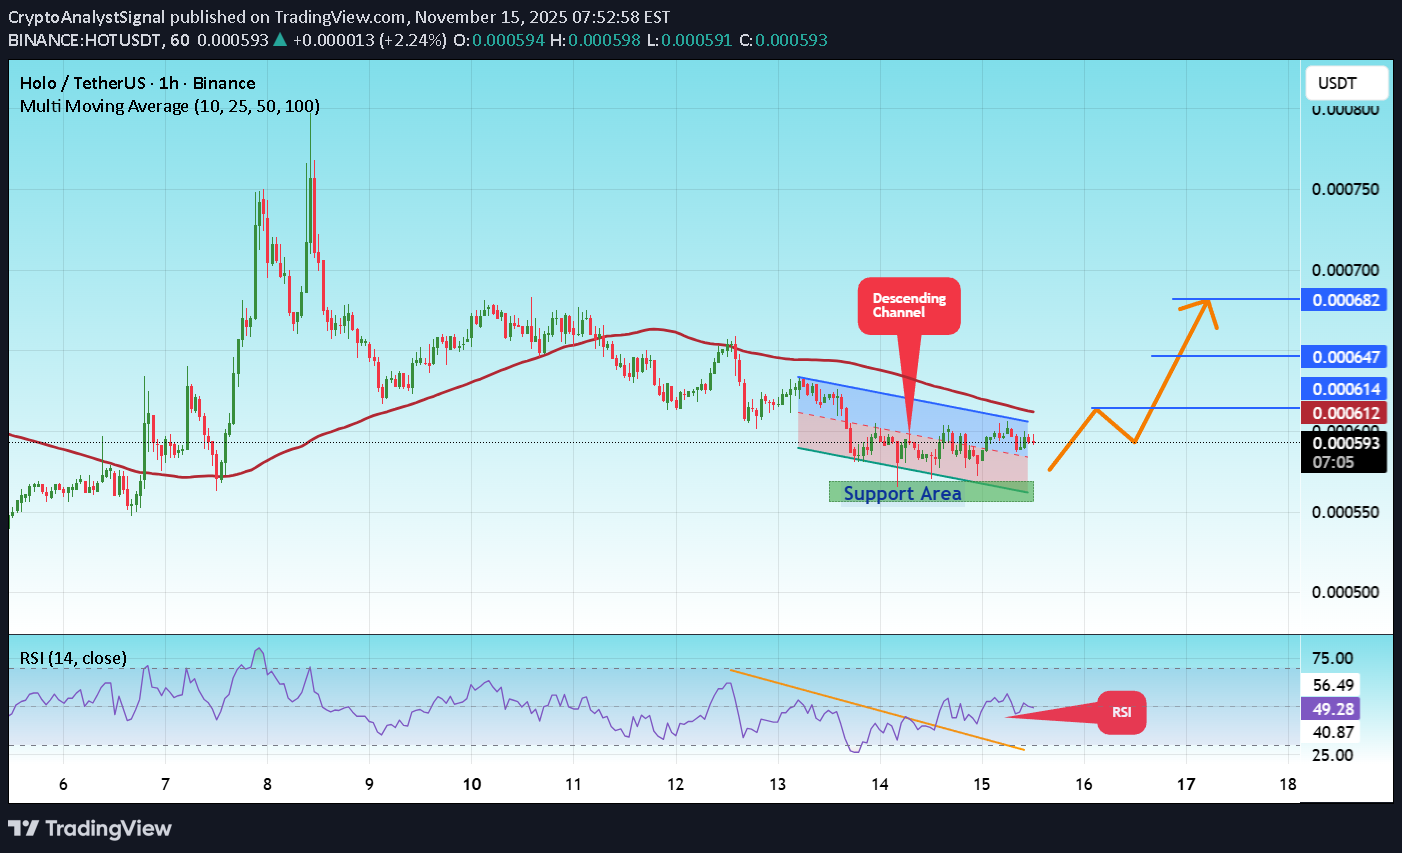
#HOT The price is moving in a descending channel on the 1-hour timeframe and is expected to break out and continue upwards. We have a trend to stabilize above the 100-period moving average again. We have a downtrend on the RSI indicator, which supports an upward move if it breaks above it. We have a key support zone in green that pushed the price higher at 0.000561. Entry price: 0.000592 First target: 0.000614 Second target: 0.000647 Third target: 0.000682 For risk management, don't forget stop-loss orders and capital management. The stop-loss is below the support zone in green. Upon reaching the first target, take some profits and then change the stop-loss order to an entry order. For any questions, please comment. Thank you.#HOT First target: 0.000614 Reached Second target: 0.000647 Reached

asilturk
هشدار جدی درباره ارز دیجیتال HOT (هولو): ریسک بالا و فرصتهای کوتاهمدت!
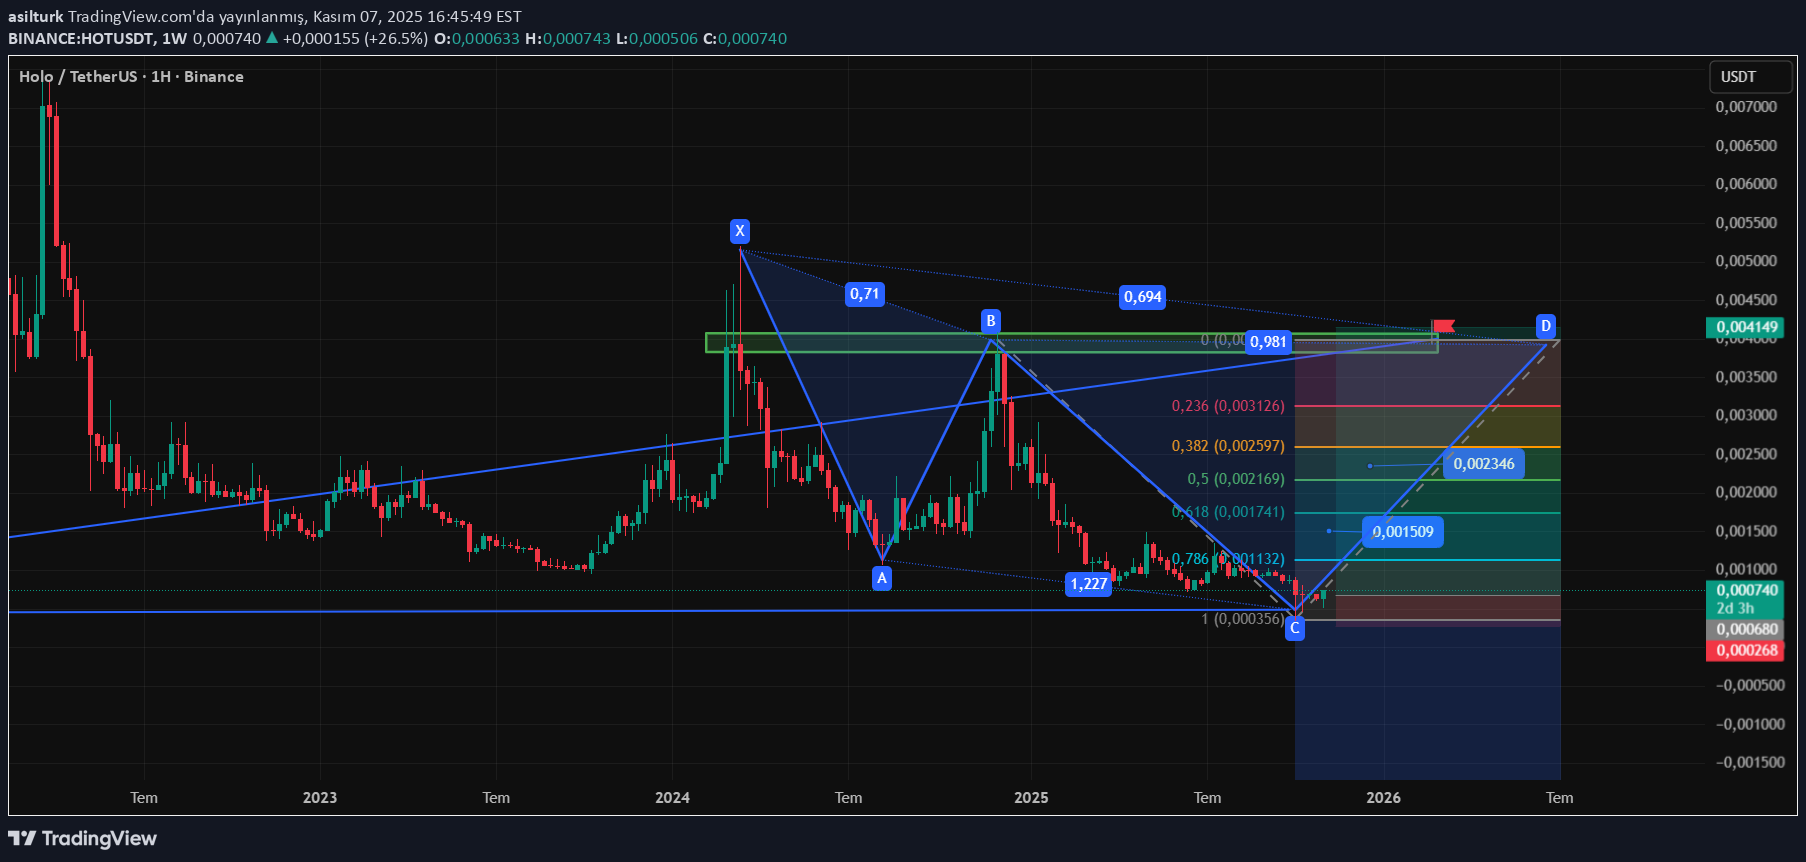
Another crypto stock we will share today is HOT, aka HOLO, currently priced at $0.000698, market value of $121 Million, ranked 294th, HOT is in the high-risk group with its unlimited supply and share in circulation of 175 Billion units, and a concentration value of 3.98. A. From a technical perspective, we cannot say that a rising trend is clearly forming, but the volumetric increase and indicators tell us that the signals are at least partially reliable. I don't want to talk about their prices, eventually Duke will be realized for all of them. While the serious pressure and sales of alt coins over the past years and the delisting of many of them caused distrust in the alt coin markets, as can be seen from the posts in the last 2 months, it is understood that they are trying to re-establish confidence in alt coins, which have revived many investors. As a result, I specifically mention this part that I have suggested in the medium and long term as much as possible and make suggestions in the medium and long term. Extremely high profitability and very high performances in a short time and obtaining very serious returns are not related to me personally, but are due to the fact that it is completely based on technique and strategy. For this reason, I recommend you to think twice when trading the cryptos I share. After all, contributing by sharing the goal. For this reason, try to grow your portfolio by realizing as much profit as possible. There is no doubt that the stocks and cryptos I share provide high returns, but it is still important for friends who open transactions to make transactions, especially by taking small risks. These are my personal notes and do not contain investment advice. I wish you pleasant spending.

brncaglar36
شکست مثلث HOTUSDT: آیا زمان انفجار قیمت فرا رسیده است؟
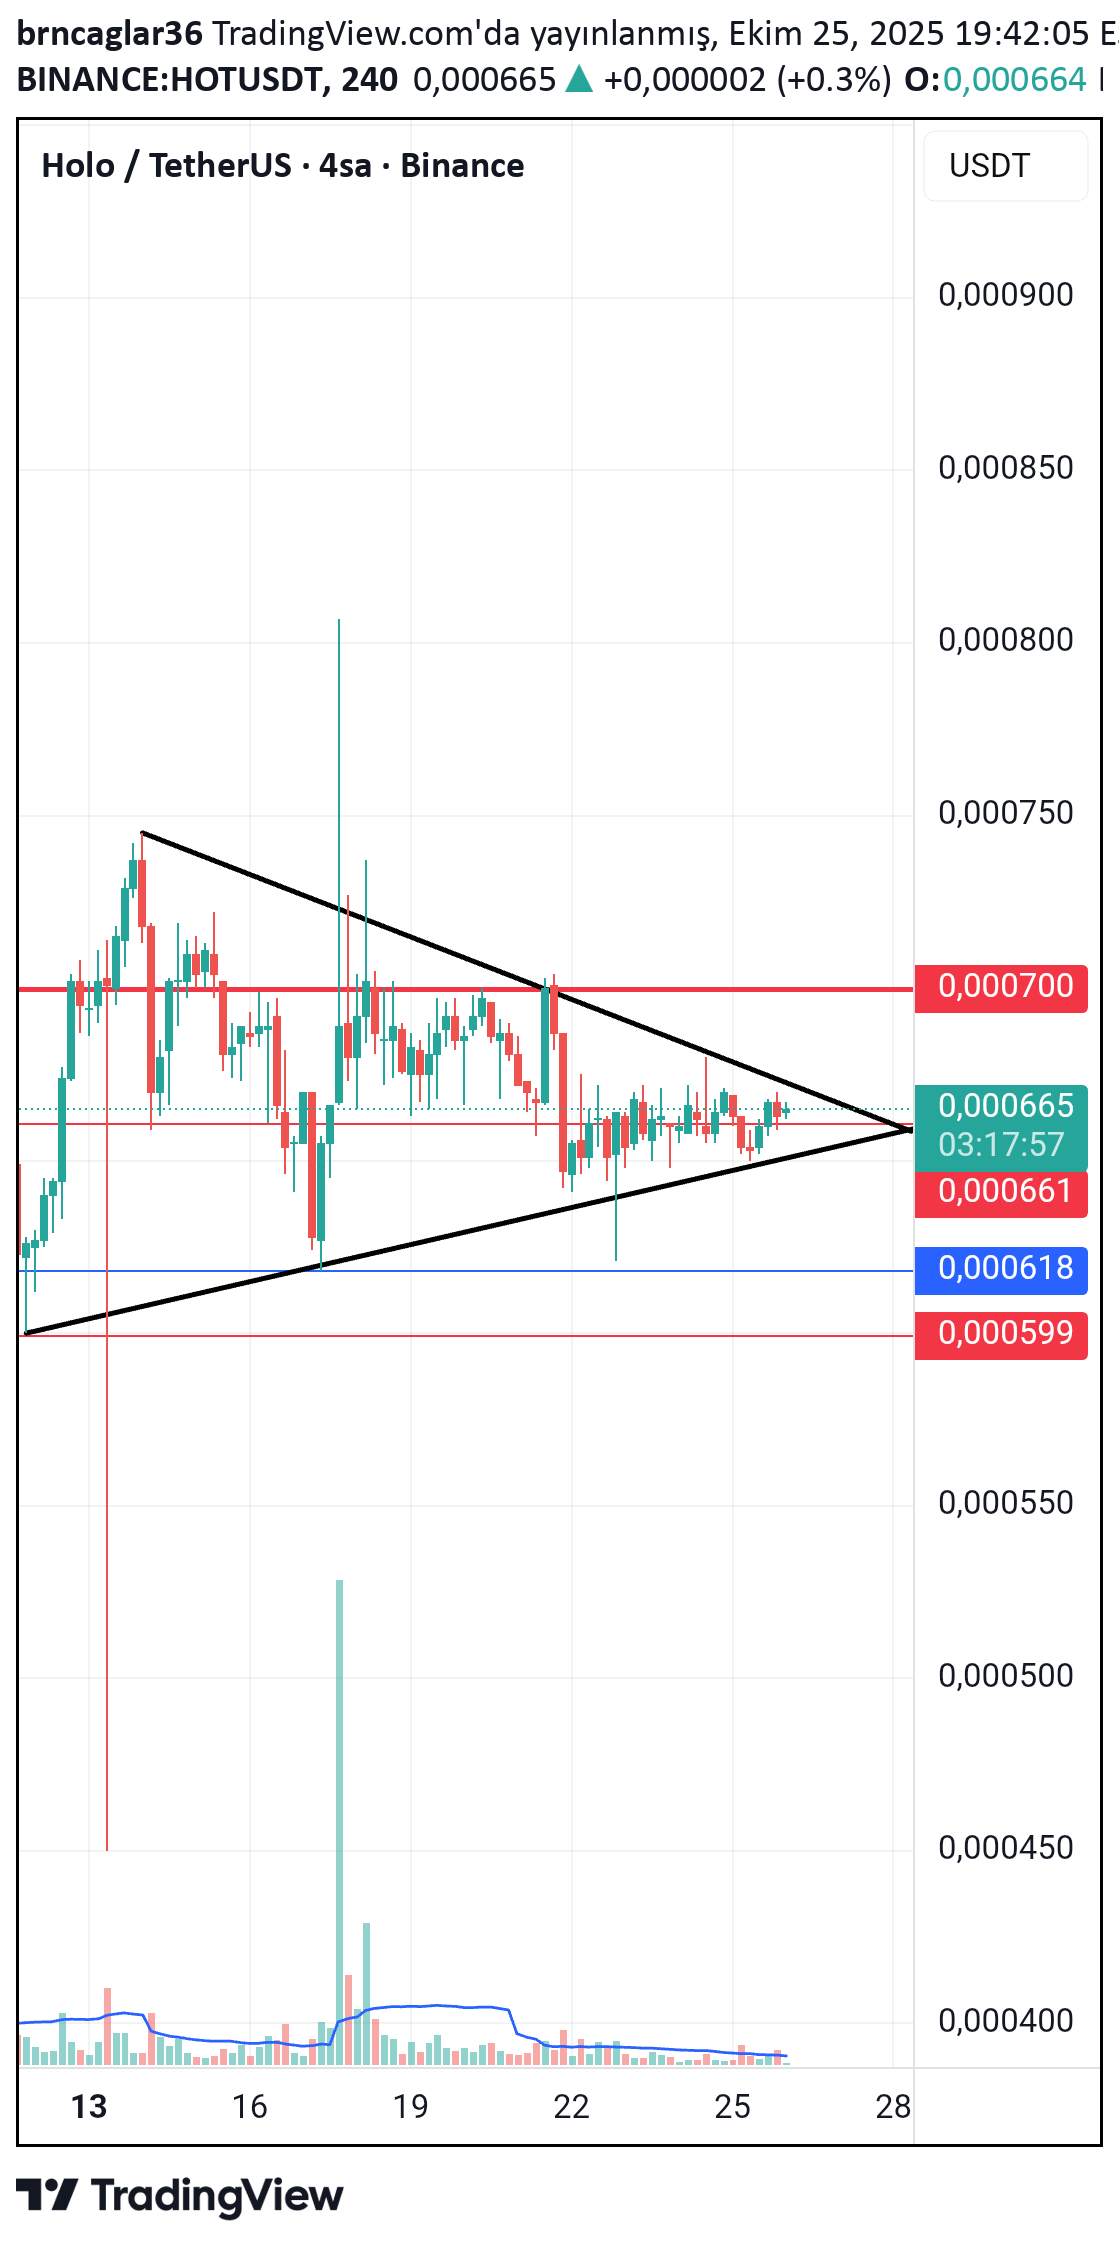
In case of a triangle formation breakout, the price can move itself to higher levels in a larger way.

Kapitalist01
نکات مهم سرمایهگذاری: آنچه باید قبل از هر تصمیمی بدانید!
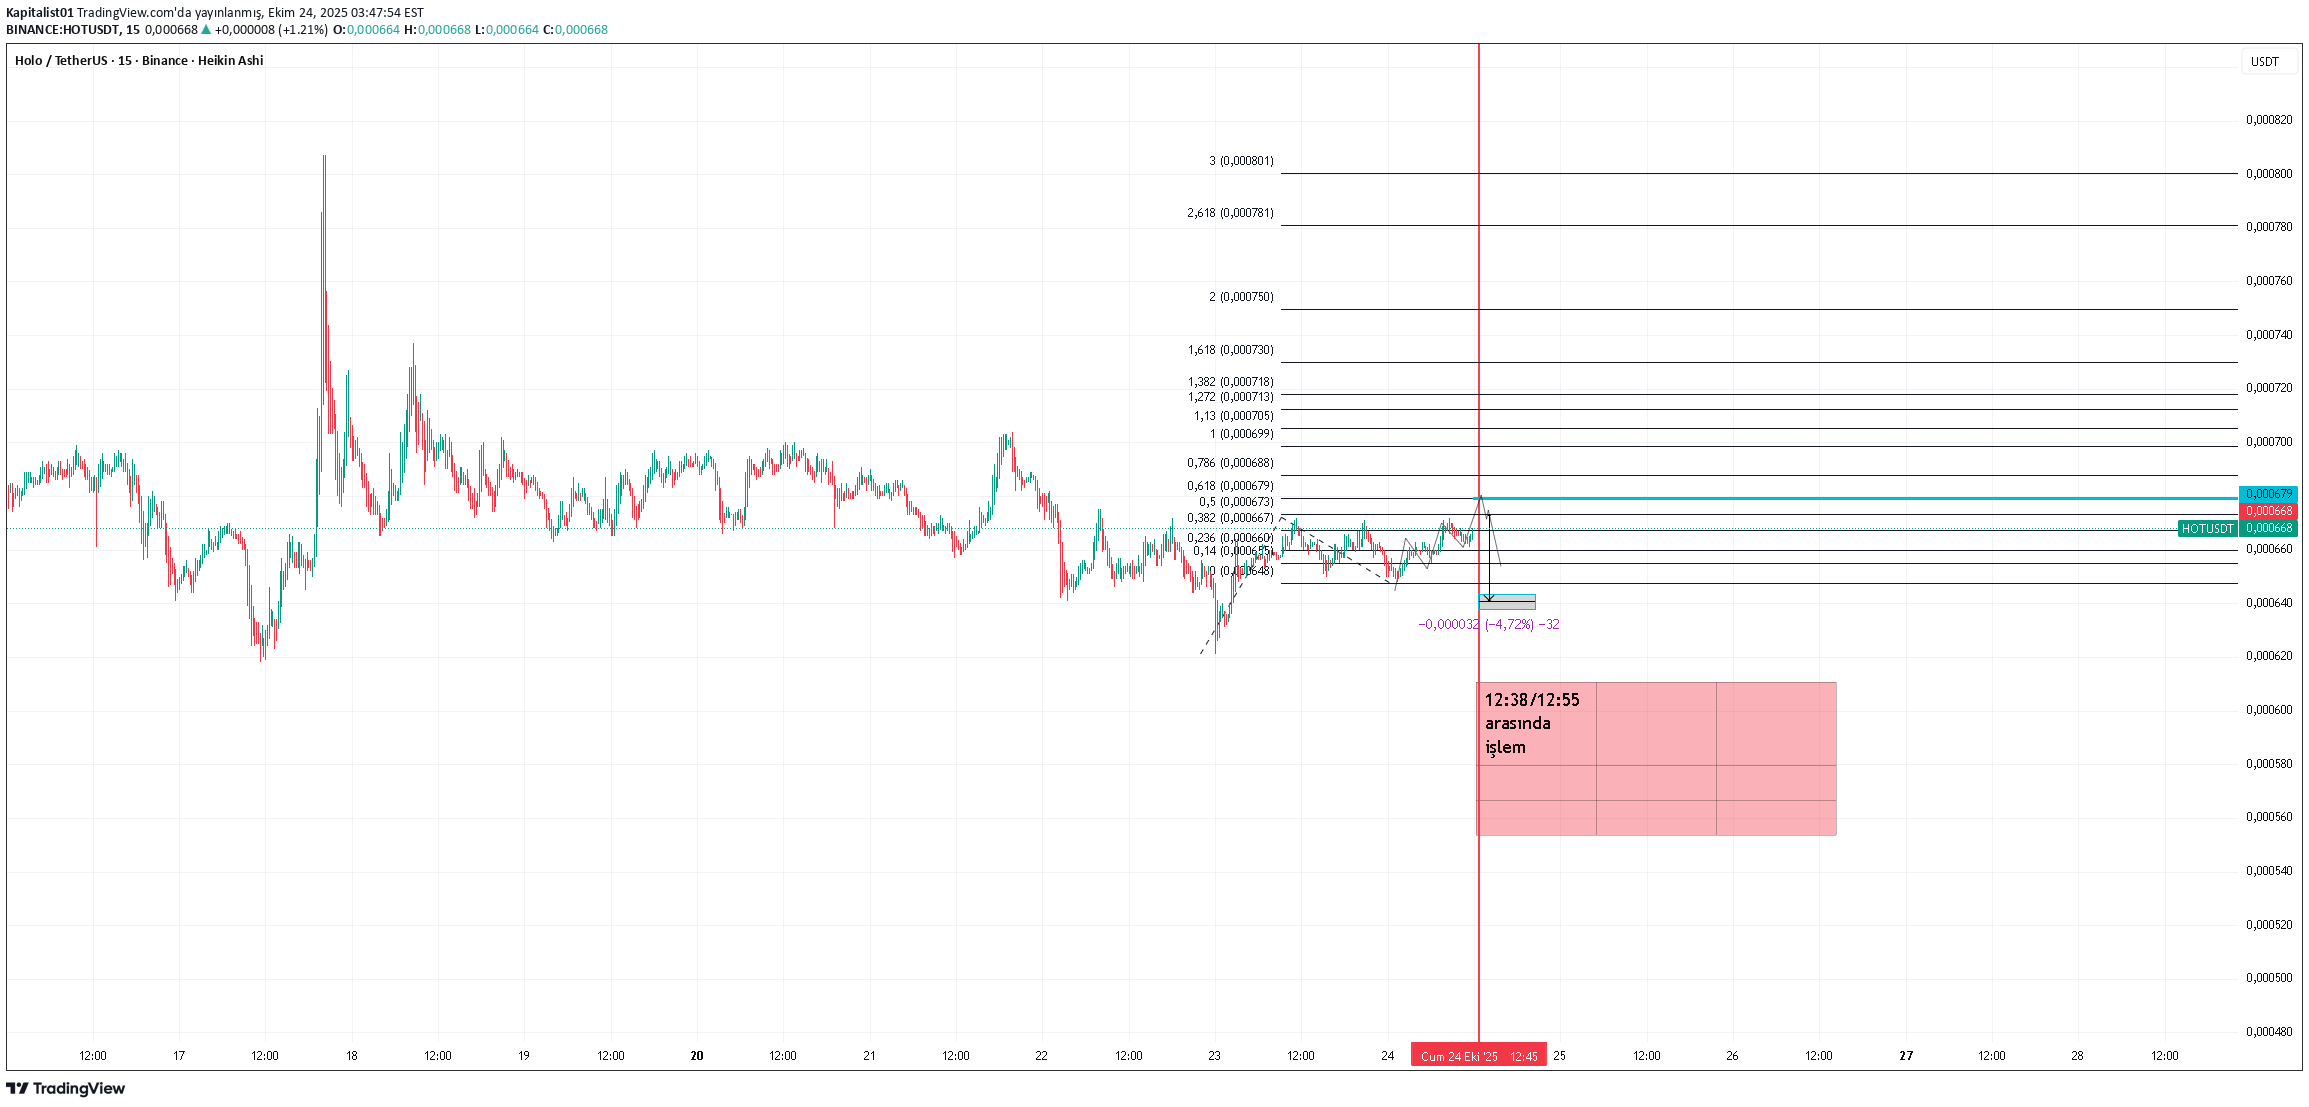
note to self short term It is not a buy or sell tut recommendation. ..................................... It is not investment advice.

HAYALOGLUU
تحلیل تکنیکال HOTUSDT: فرصت خرید پنهان یا انتظار برای ریزش؟
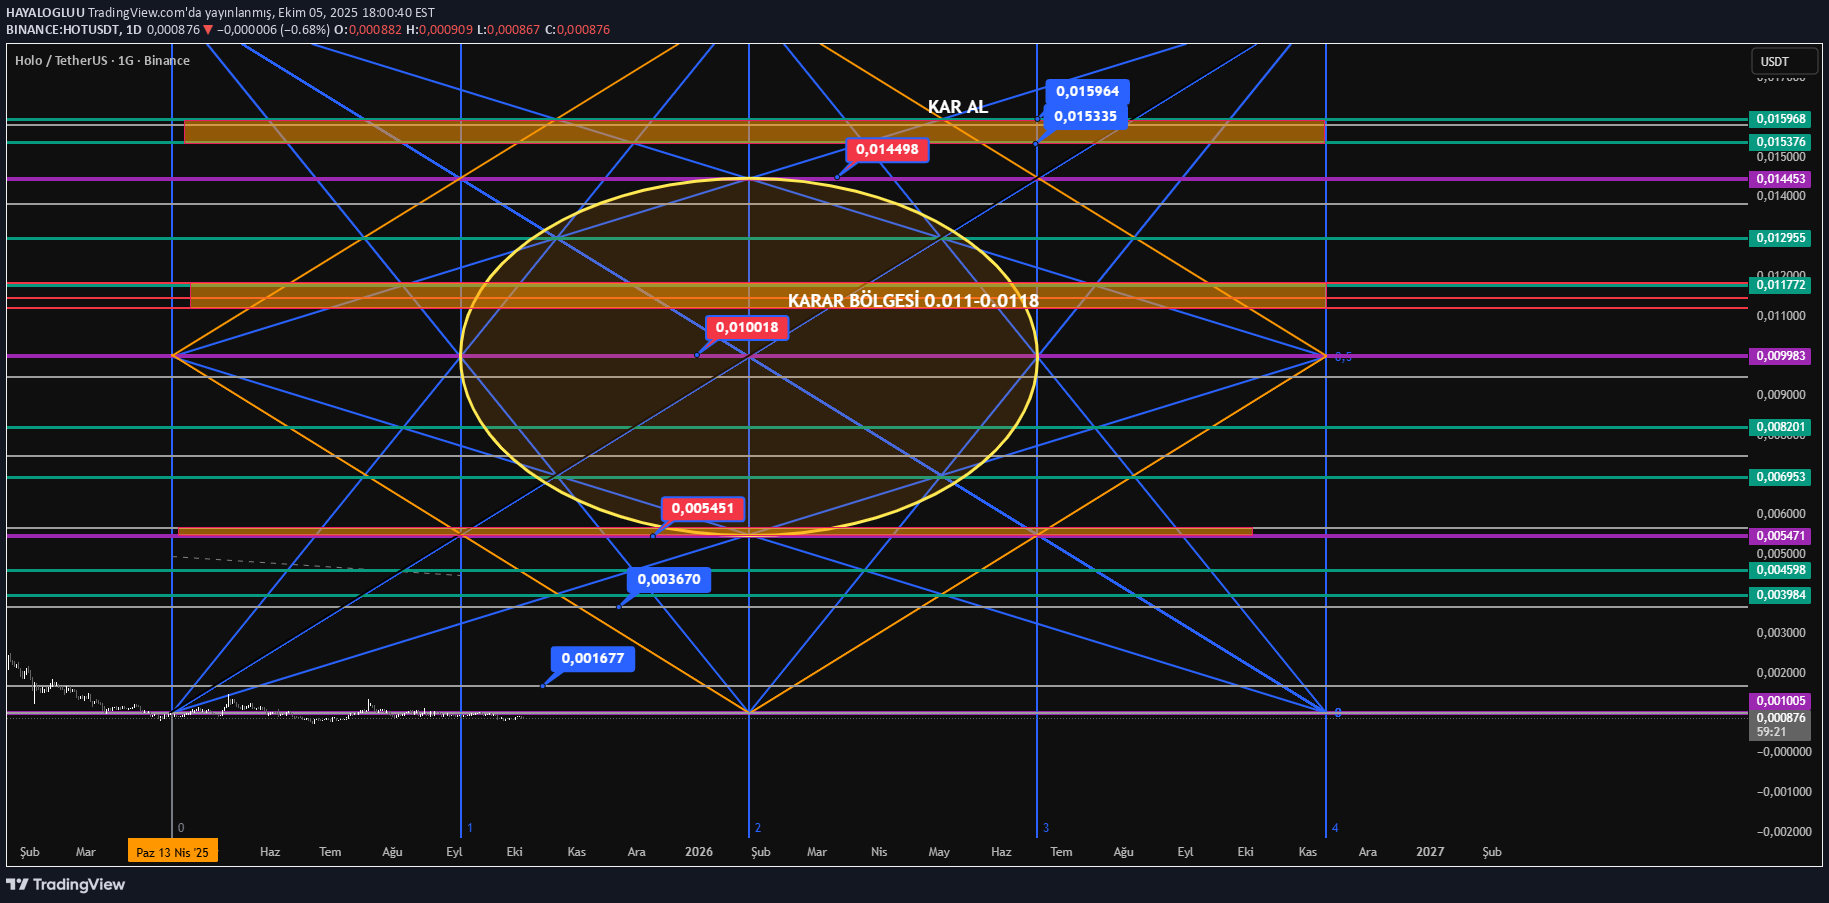
It is not an investment advice. In the 7 -month period, there is no horizontal course and no volume. The graph will be invalid at a 5 percent drop. The first contact with a weekly closing above 0.0016 can be expected to be 0.0036. . Significant resistance levels are shown with red label. The target can be waited for a half profit and take a profit. Green levels intermediate support resistance zones and yellow ellipse the price of the price is expected. plenty of earnings. YTD

TakaoKinomiya
Hot için long setup !
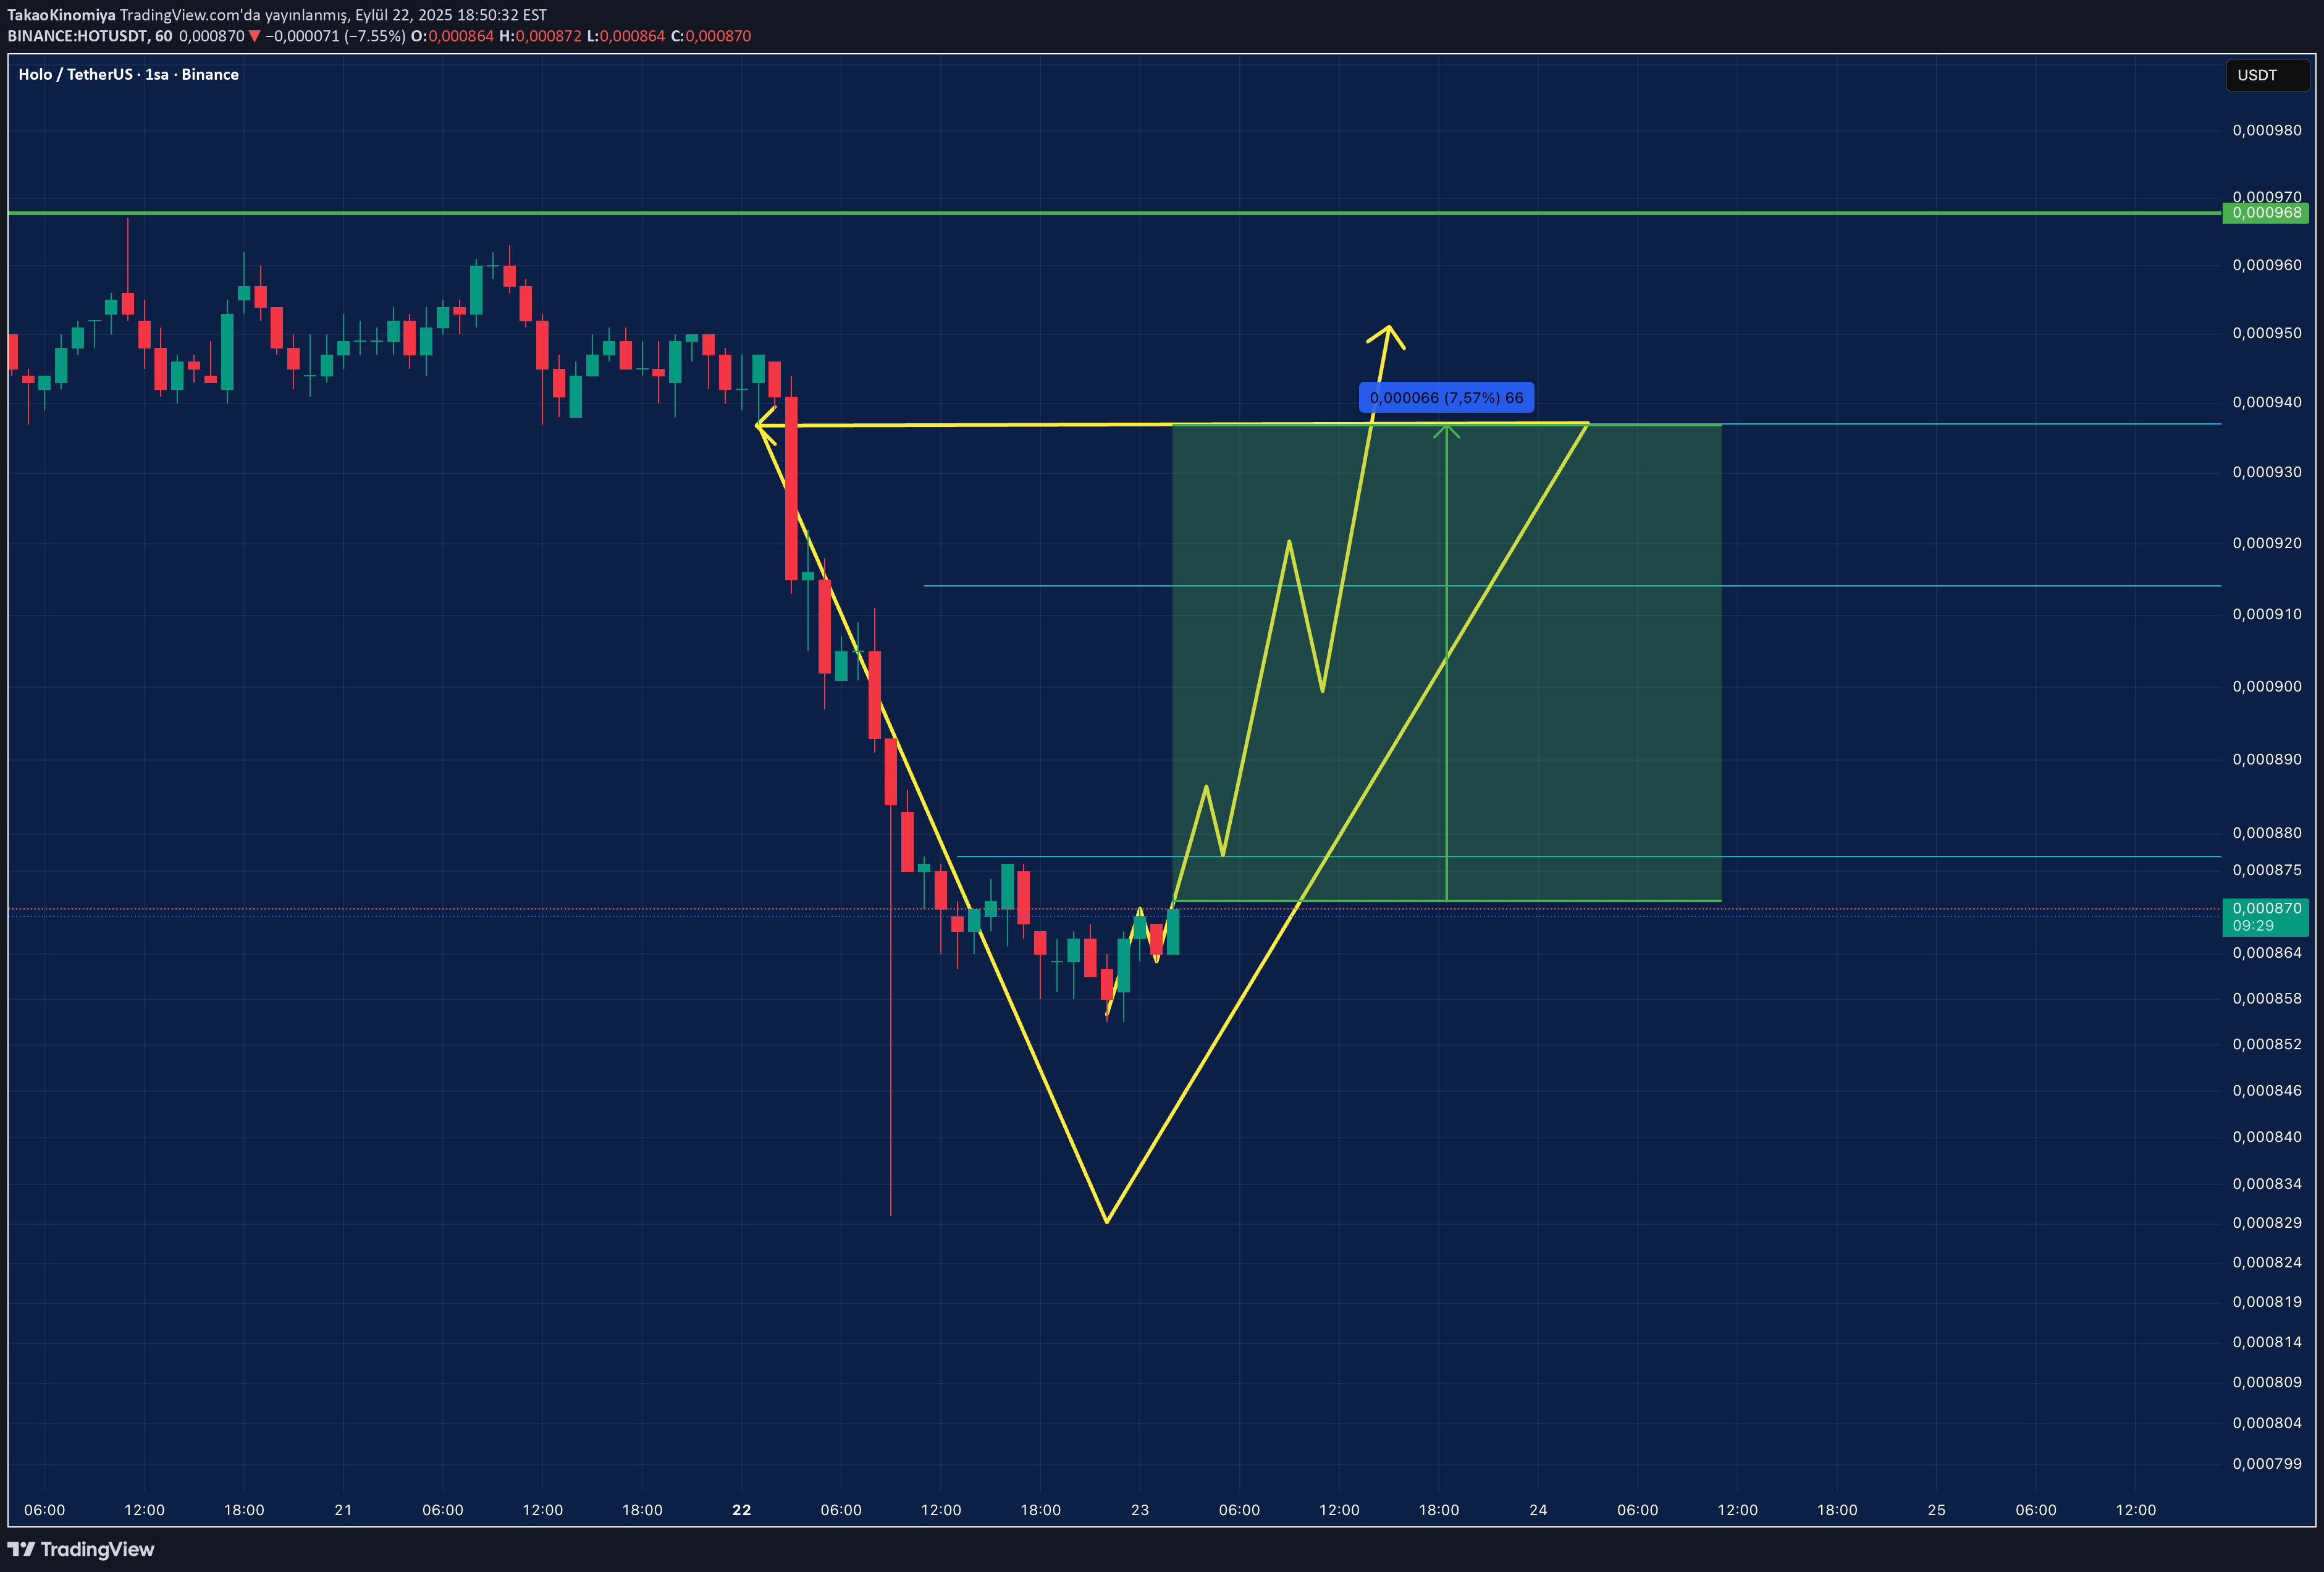
Yes, friends in our own style a strategy in the last portal in the diary, we have drawn like this and 2x caught up if the 8 %scalp Long process!

sercantutar41
ELMAS FORMASYONU ÇALIŞIRMI
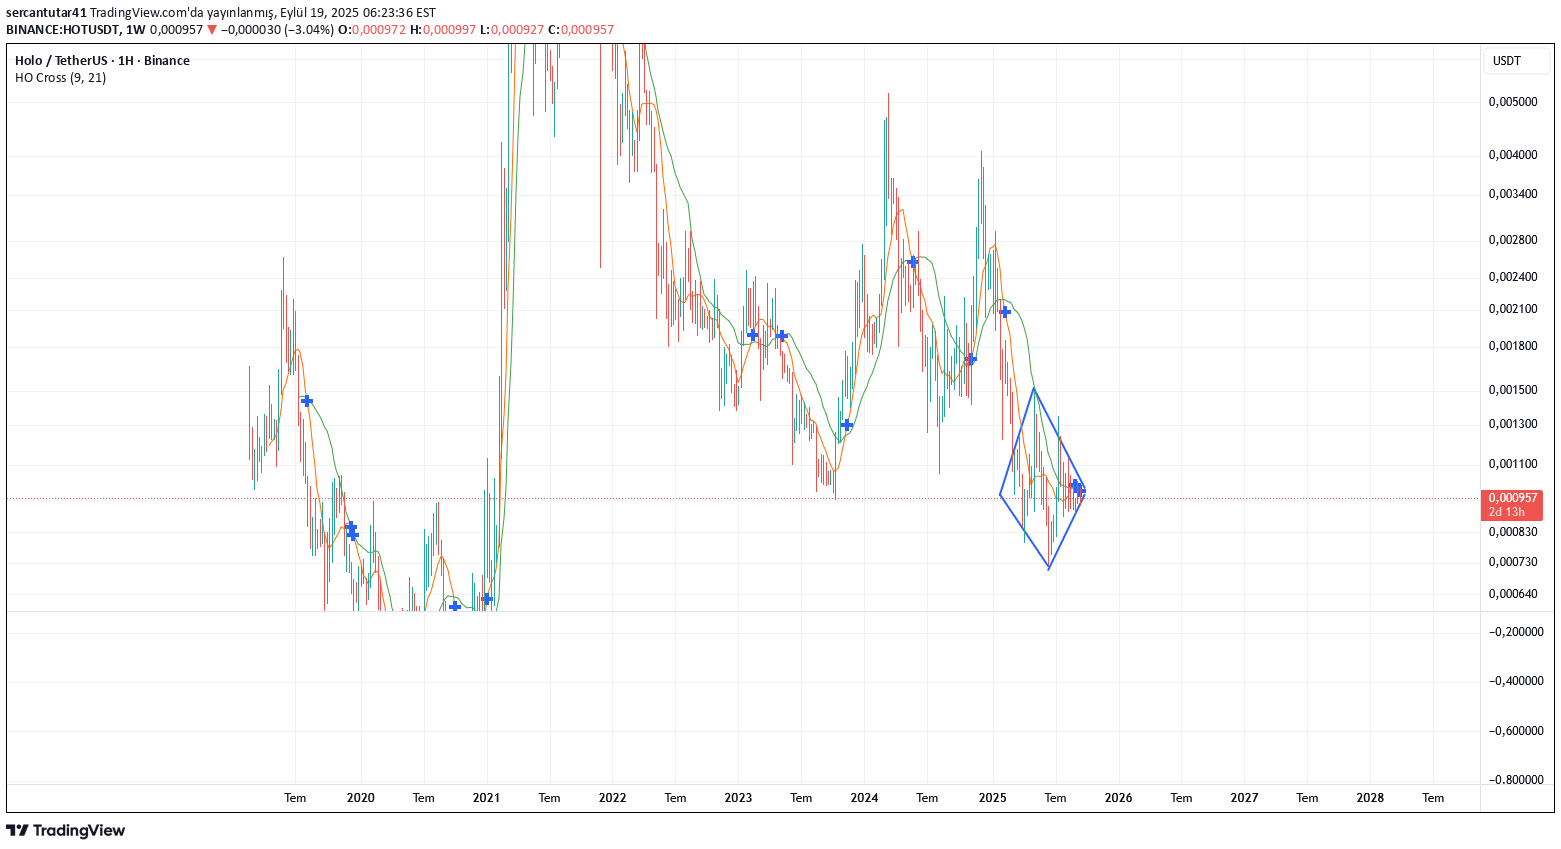
Although the volumes do not give confidence, there is a very nice diamond formation in the week.

CryptoNuclear
HOT/USDT — Testing Demand Zone: Major Accumulation or Breakdown?
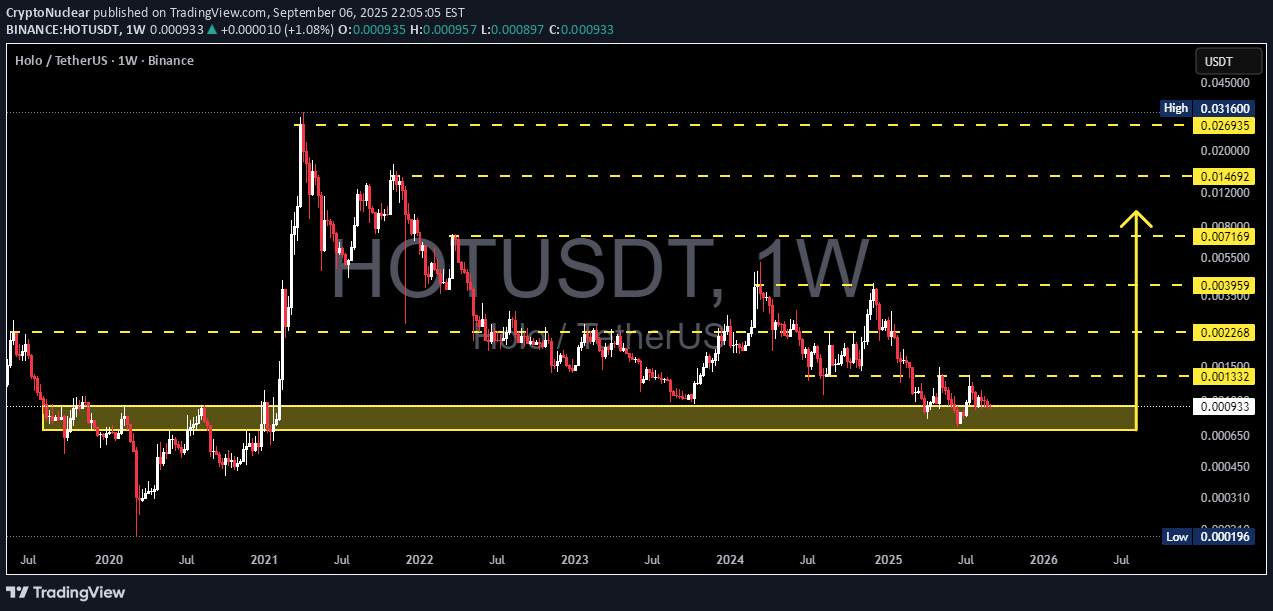
📊 Overview HOT (Holochain) is now trading at a multi-year demand zone that has been significant since 2019–2020. This zone is critical because: 1. It served as the launchpad for the massive 2021 rally. 2. It has been retested multiple times during extreme market downturns. 3. Price has returned to this area after more than 4 years — making it one of the most important levels in HOT’s price history. In other words, the market is at a crossroads: will this demand zone trigger another rally, or finally break down and lead to new lows? --- 📌 Key Technical Levels Current Price: ≈ 0.000932 USDT Demand Zone (Historical Support): 0.00065 – 0.00120 Historical Low: 0.000196 Key Resistances: R1: 0.001332 R2: 0.002268 R3: 0.003959 R4: 0.007169 R5: 0.014692 R6: 0.026935 R7 (ATH): 0.031600 --- 📈 Bullish Scenario 1. A weekly close above the demand zone signals that buyers are still defending this key area. 2. A confirmed breakout and hold above 0.001332 would mark the first step of reversal. 3. Medium-term targets: 0.002268 → 0.003959. 4. Stronger breakouts could open the path toward 0.007169 and even 0.014+ in a broader bull cycle. ➡️ In this case, the current zone may represent a long-term accumulation opportunity with significant upside potential. --- 📉 Bearish Scenario 1. If HOT closes weekly below 0.00065, the demand zone collapses. 2. This breakdown could trigger capitulation with the next target around the historical low of 0.000196. 3. Such a move would confirm long-term distribution, with sellers fully in control. ➡️ Traders must be cautious, as the downside risk remains large if this critical support fails. --- 🌀 Structure & Patterns Macro Trend: Bearish since the 2021 peak with consistent lower highs. Current Setup: Range accumulation within the demand zone; potential triple bottom or re-accumulation if strong rejection occurs. Confirmation Needed: Weekly close and volume reaction will determine whether this is accumulation or a breakdown. --- 📌 Conclusion HOT is at one of its most crucial levels in 5 years. Bullish case: demand zone holds → possible rebound with upside targets up to 0.003959 and beyond. Bearish case: breakdown below 0.00065 → risk of capitulation toward 0.000196. Key focus for traders/investors right now: Watch the weekly close + volume confirmation to validate the next move. --- #HOT #HOTUSDT #Holo #Crypto #Altcoin #CryptoTrading #Accumulation #SupportResistance #TechnicalAnalysis
CryptoAnalystSignal
#HOT/USDT
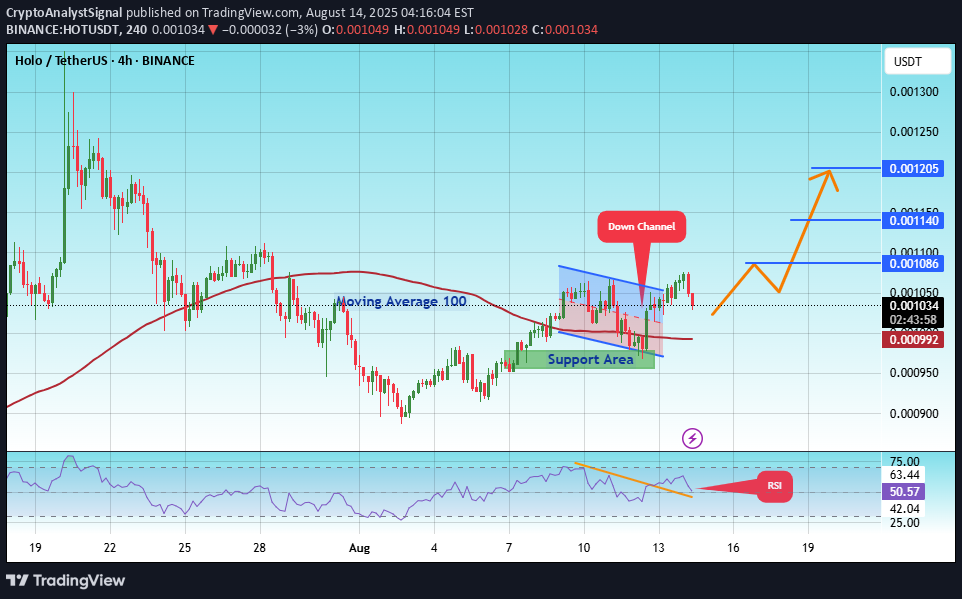
#HOT The price is moving within an ascending channel on the 1-hour frame, adhering well to it, and is poised to break it strongly upwards and retest it. We have support from the lower boundary of the ascending channel, at 0.00975. We have a downtrend on the RSI indicator that is about to break and retest, supporting the upward move. There is a key support area in green at 0.000965, which represents a strong basis for the upward move. Don't forget one simple thing: ease and capital. When you reach the first target, save some money and then change your stop-loss order to an entry order. For inquiries, please leave a comment. We have a trend of stability above the Moving Average 100. Entry price: 0.001032 First target: 0.001086 Second target: 0.001140 Third target: 0.001205 Don't forget one simple thing: ease and capital. When you reach the first target, save some money and then change your stop-loss order to an entry order. For inquiries, please leave a comment. Thank you.
Disclaimer
Any content and materials included in Sahmeto's website and official communication channels are a compilation of personal opinions and analyses and are not binding. They do not constitute any recommendation for buying, selling, entering or exiting the stock market and cryptocurrency market. Also, all news and analyses included in the website and channels are merely republished information from official and unofficial domestic and foreign sources, and it is obvious that users of the said content are responsible for following up and ensuring the authenticity and accuracy of the materials. Therefore, while disclaiming responsibility, it is declared that the responsibility for any decision-making, action, and potential profit and loss in the capital market and cryptocurrency market lies with the trader.