
GRT
The Graph
| تریدر | نوع سیگنال | حد سود/ضرر | زمان انتشار | مشاهده پیام |
|---|---|---|---|---|
 BandForBandsRank: 31957 | خرید | حد سود: تعیین نشده حد ضرر: تعیین نشده | 12/2/2025 |
Price Chart of The Graph
سود 3 Months :
سیگنالهای The Graph
Filter
Sort messages by
Trader Type
Time Frame

tradecitypro
TradeCityPro | GRT Testing Key Support in Wide Range Structure
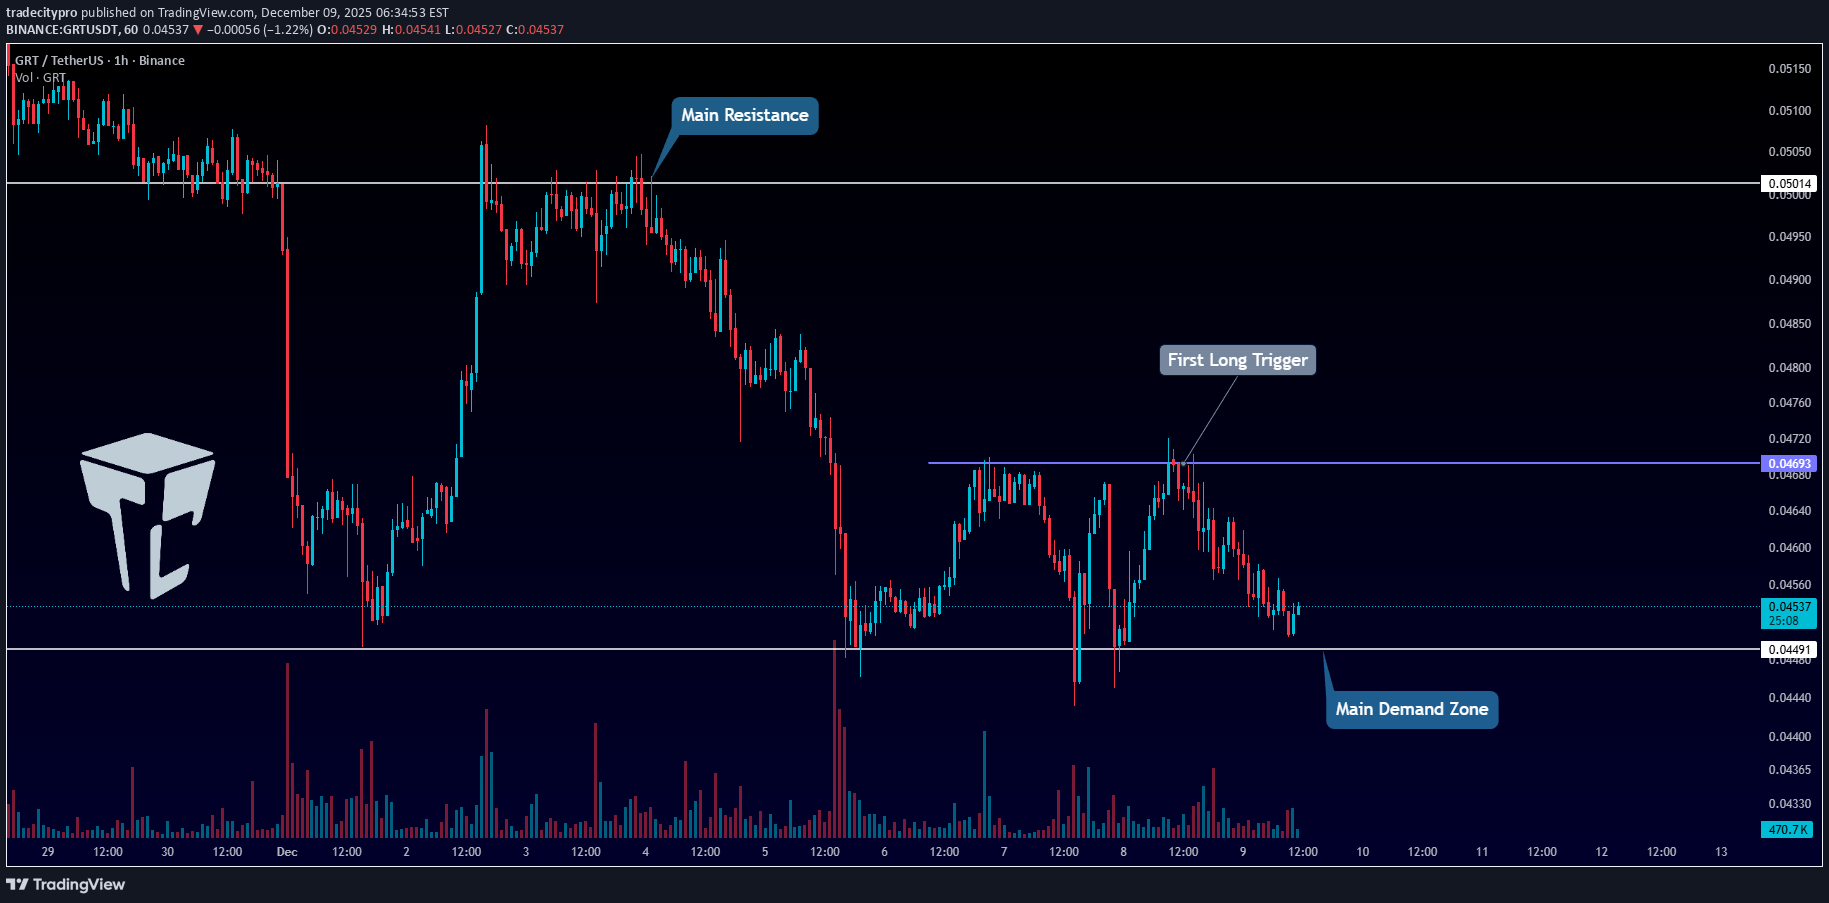
👋 Welcome to TradeCity Pro! In this analysis I want to review the GRT coin for you. One of the DeFi and Solana ecosystem projects that with a market cap of 481 million dollars is ranked 95 on CoinMarketCap. ⏳ 1-hour timeframe In the 1-hour timeframe, a range box has formed between the zones 0.04491 and 0.4693, and the price has been fluctuating between these two zones for several days. 💥 The zone 0.04491 is a very important support for this coin, and breaking it or being supported from it can start the next movement wave on GRT. 🎯 Since in the higher timeframes like daily and weekly its trend is bearish, then with the break of 0.04491 this trend can continue and we can open a short position with it. ⚡️ If the price is supported from this zone and moves toward the 0.4693 top, we can open a long position by breaking 0.4693. ⚖️ This trigger is the first trigger for a long and is considered a risky trigger. I prefer to wait to get more confirmations for this coin turning bullish. 📊 For now, the main trigger for GRT to turn bullish will be the break of its main resistance at 0.05014. ❌ Disclaimer ❌ Trading futures is highly risky and dangerous. If you're not an expert, these triggers may not be suitable for you. You should first learn risk and capital management. You can also use the educational content from this channel. Finally, these triggers reflect my personal opinions on price action, and the market may move completely against this analysis. So, do your own research before opening any position.
BandForBands

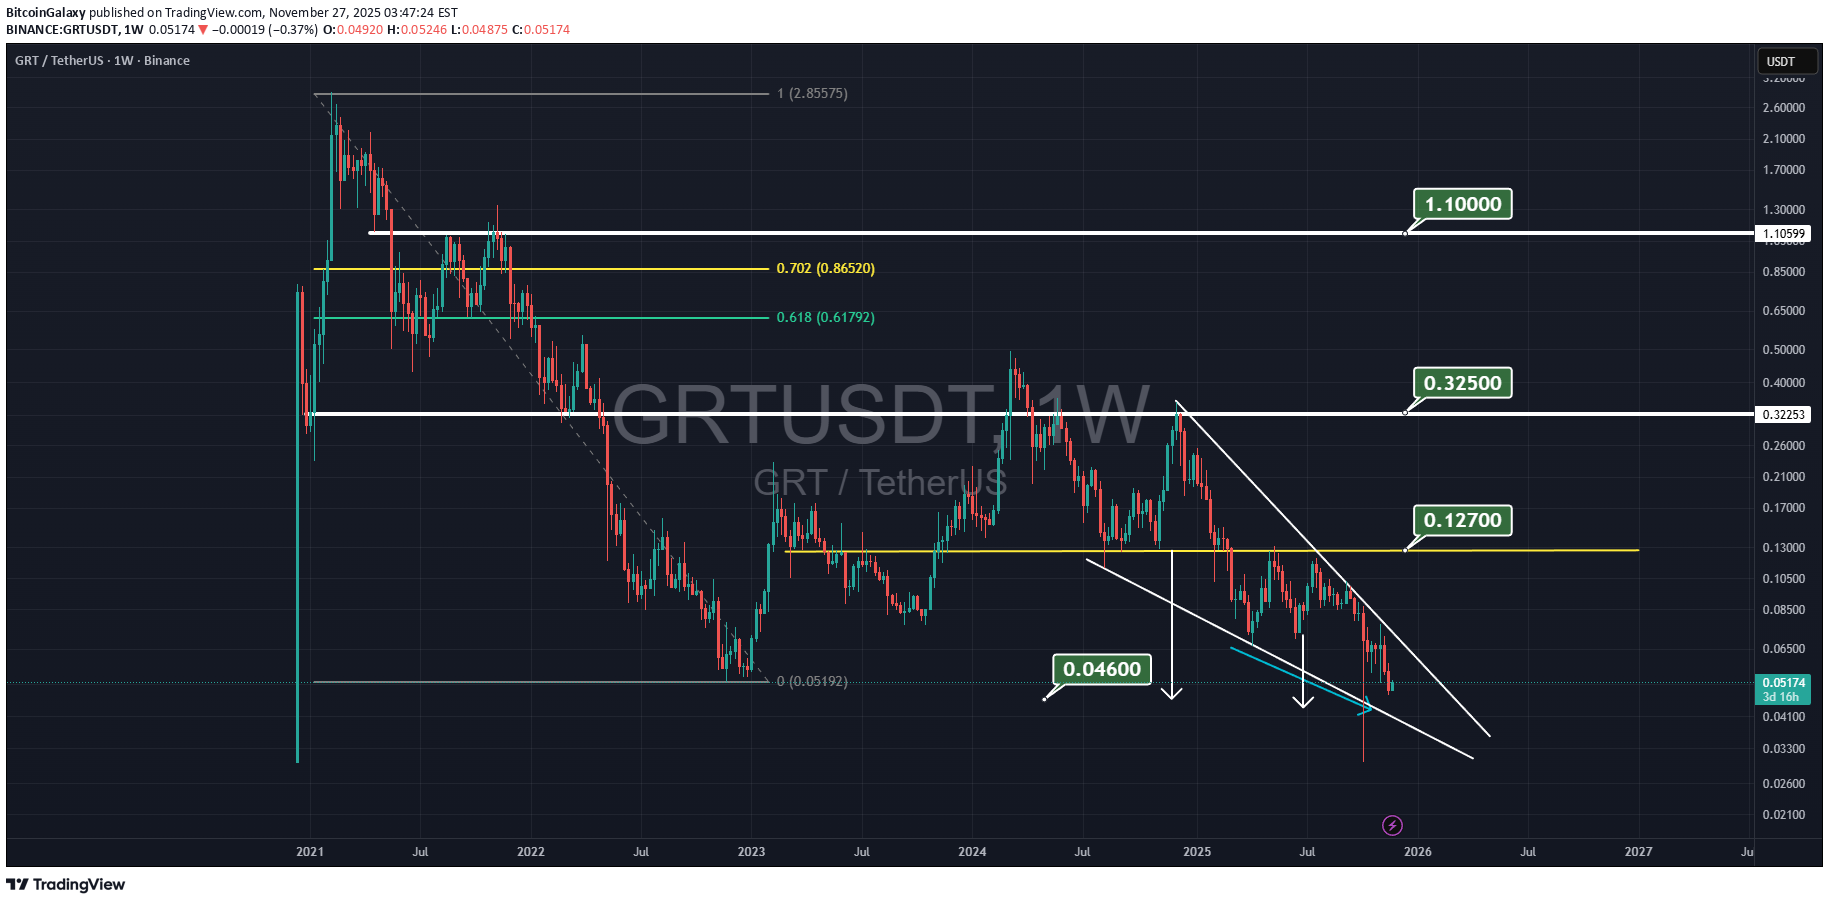
احتمال شکلگیری اژدها در GRT/USDT؛ مراقب خط ۰.۰۴۴ باشید!
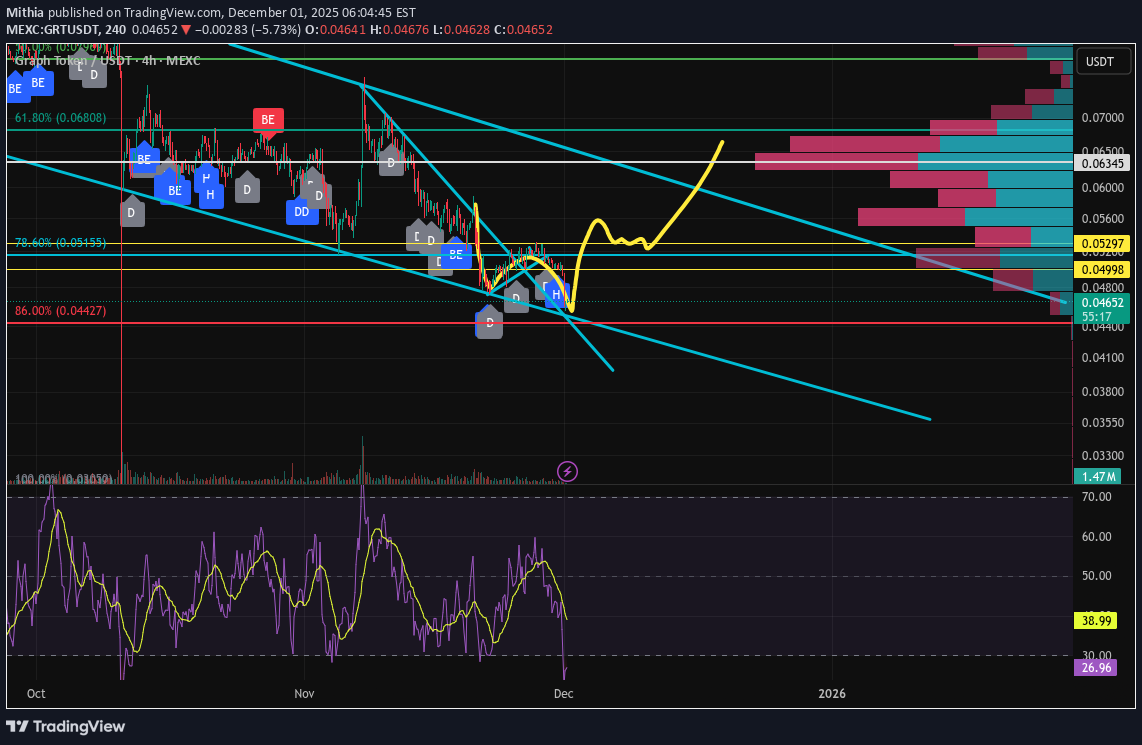
not fully true , but might do a dragon here. Lets just patiently watch.but if we loose 0.044 line , there will be a huge sell out to lvl 0.030 as you can see in my chart indicator.we are doing it, need to close right now with green candle to push the price after higher .for some reason it says trade closed , but no, i keep watching

BitcoinGalaxy
BandForBands
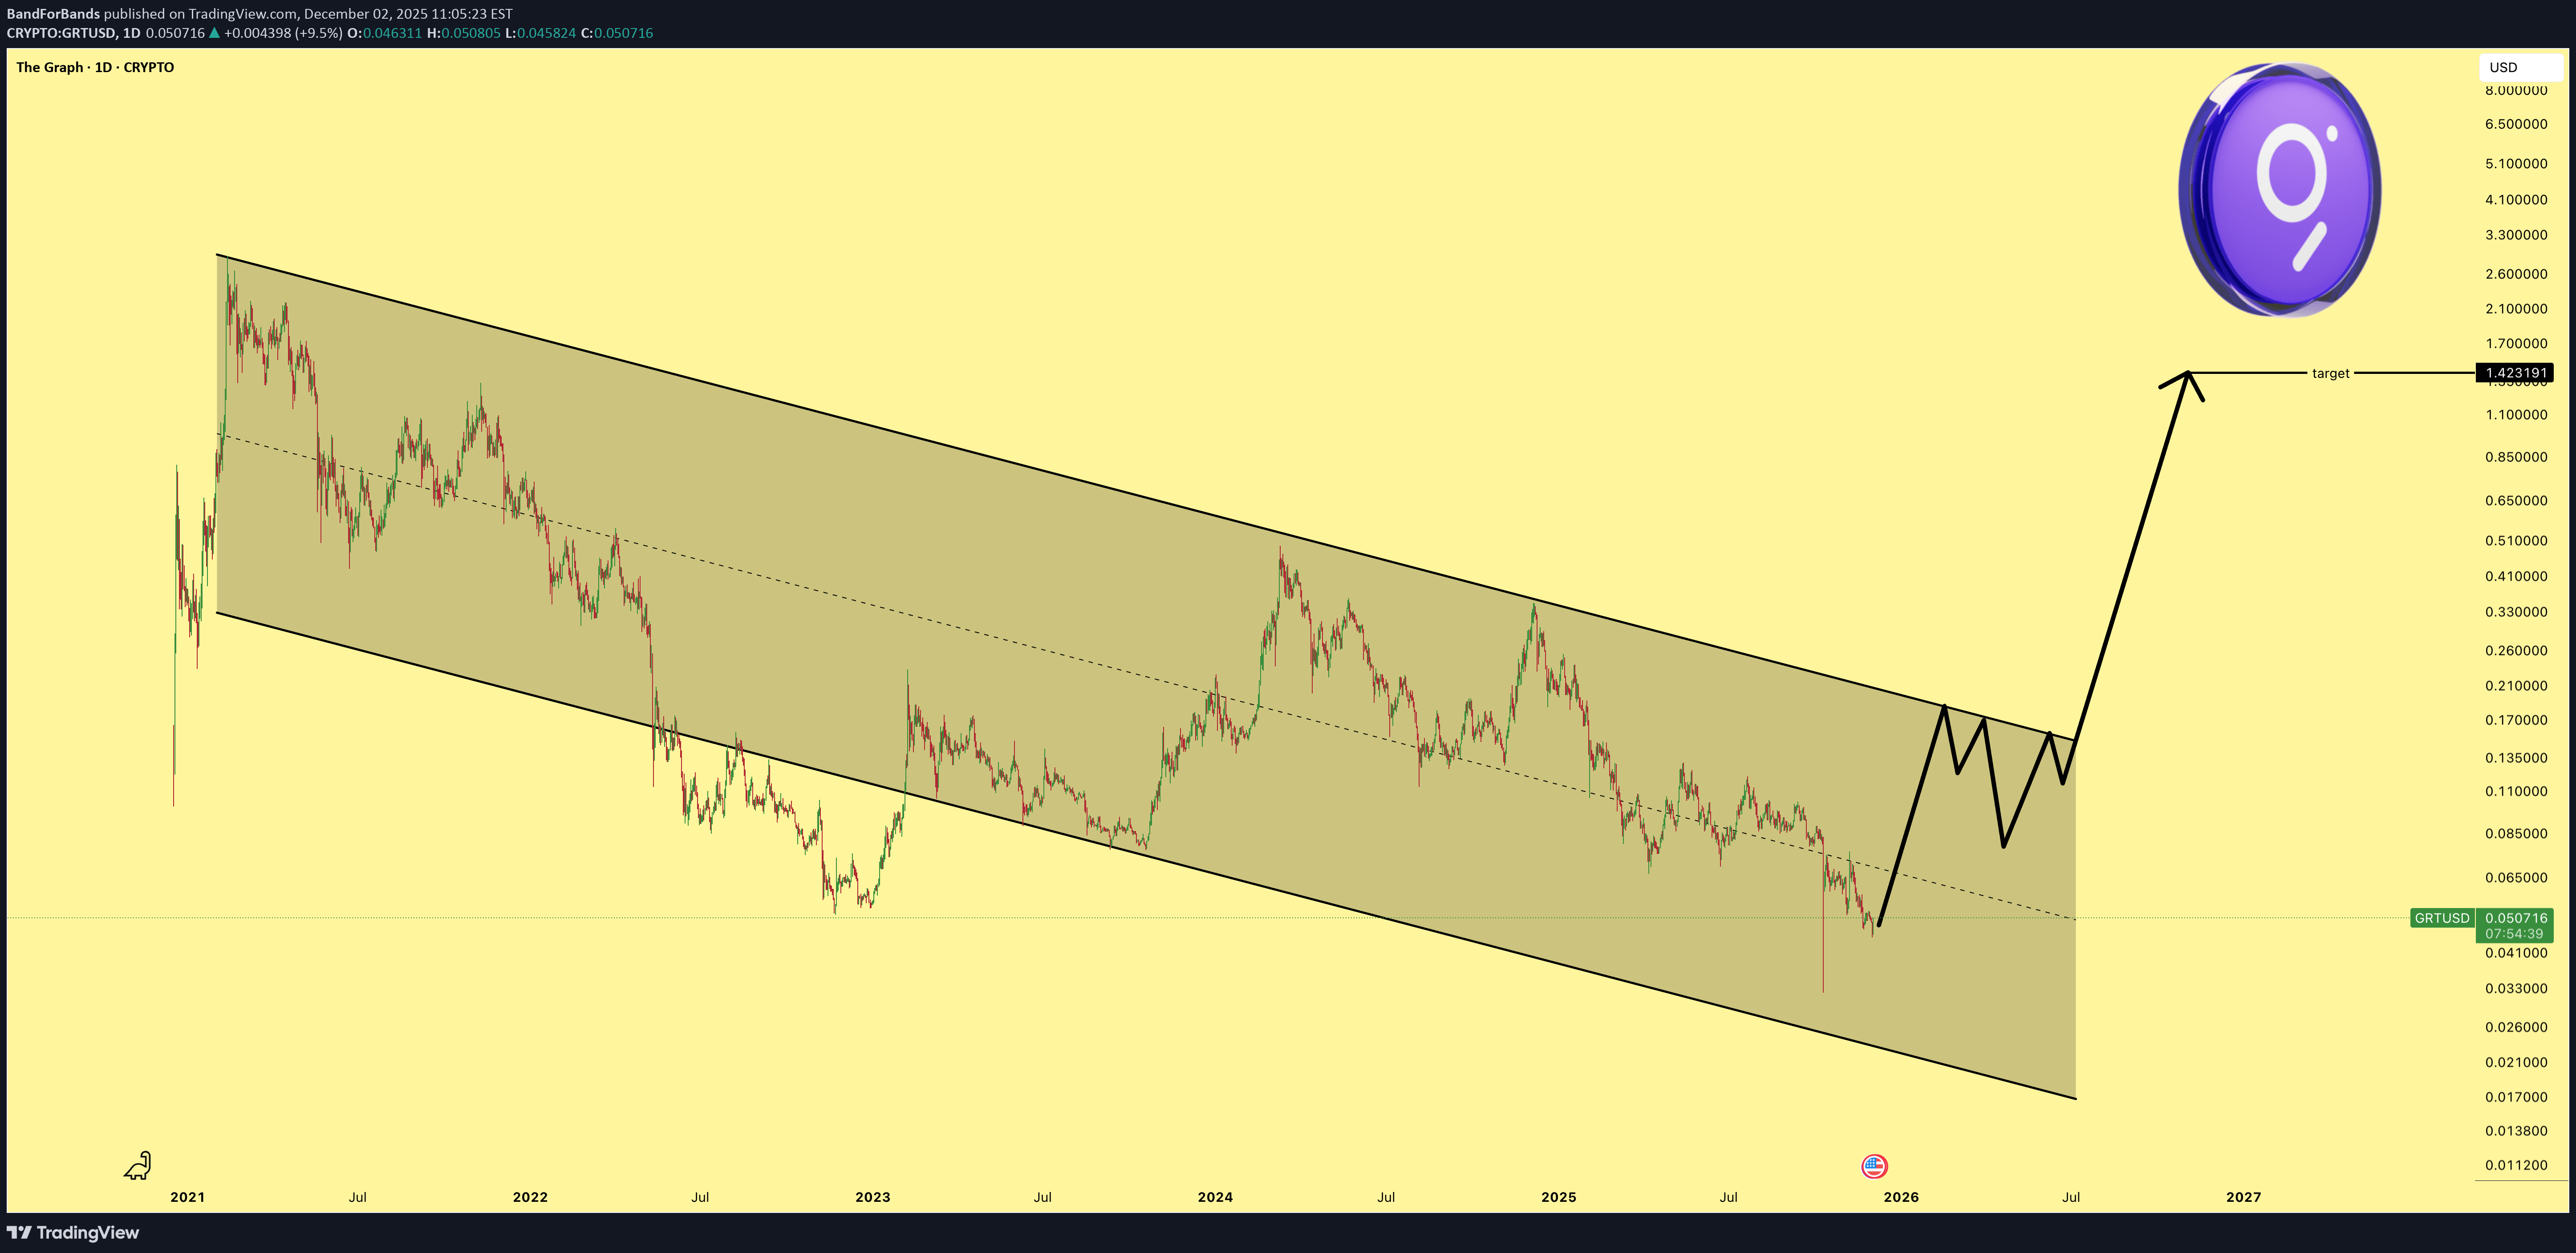
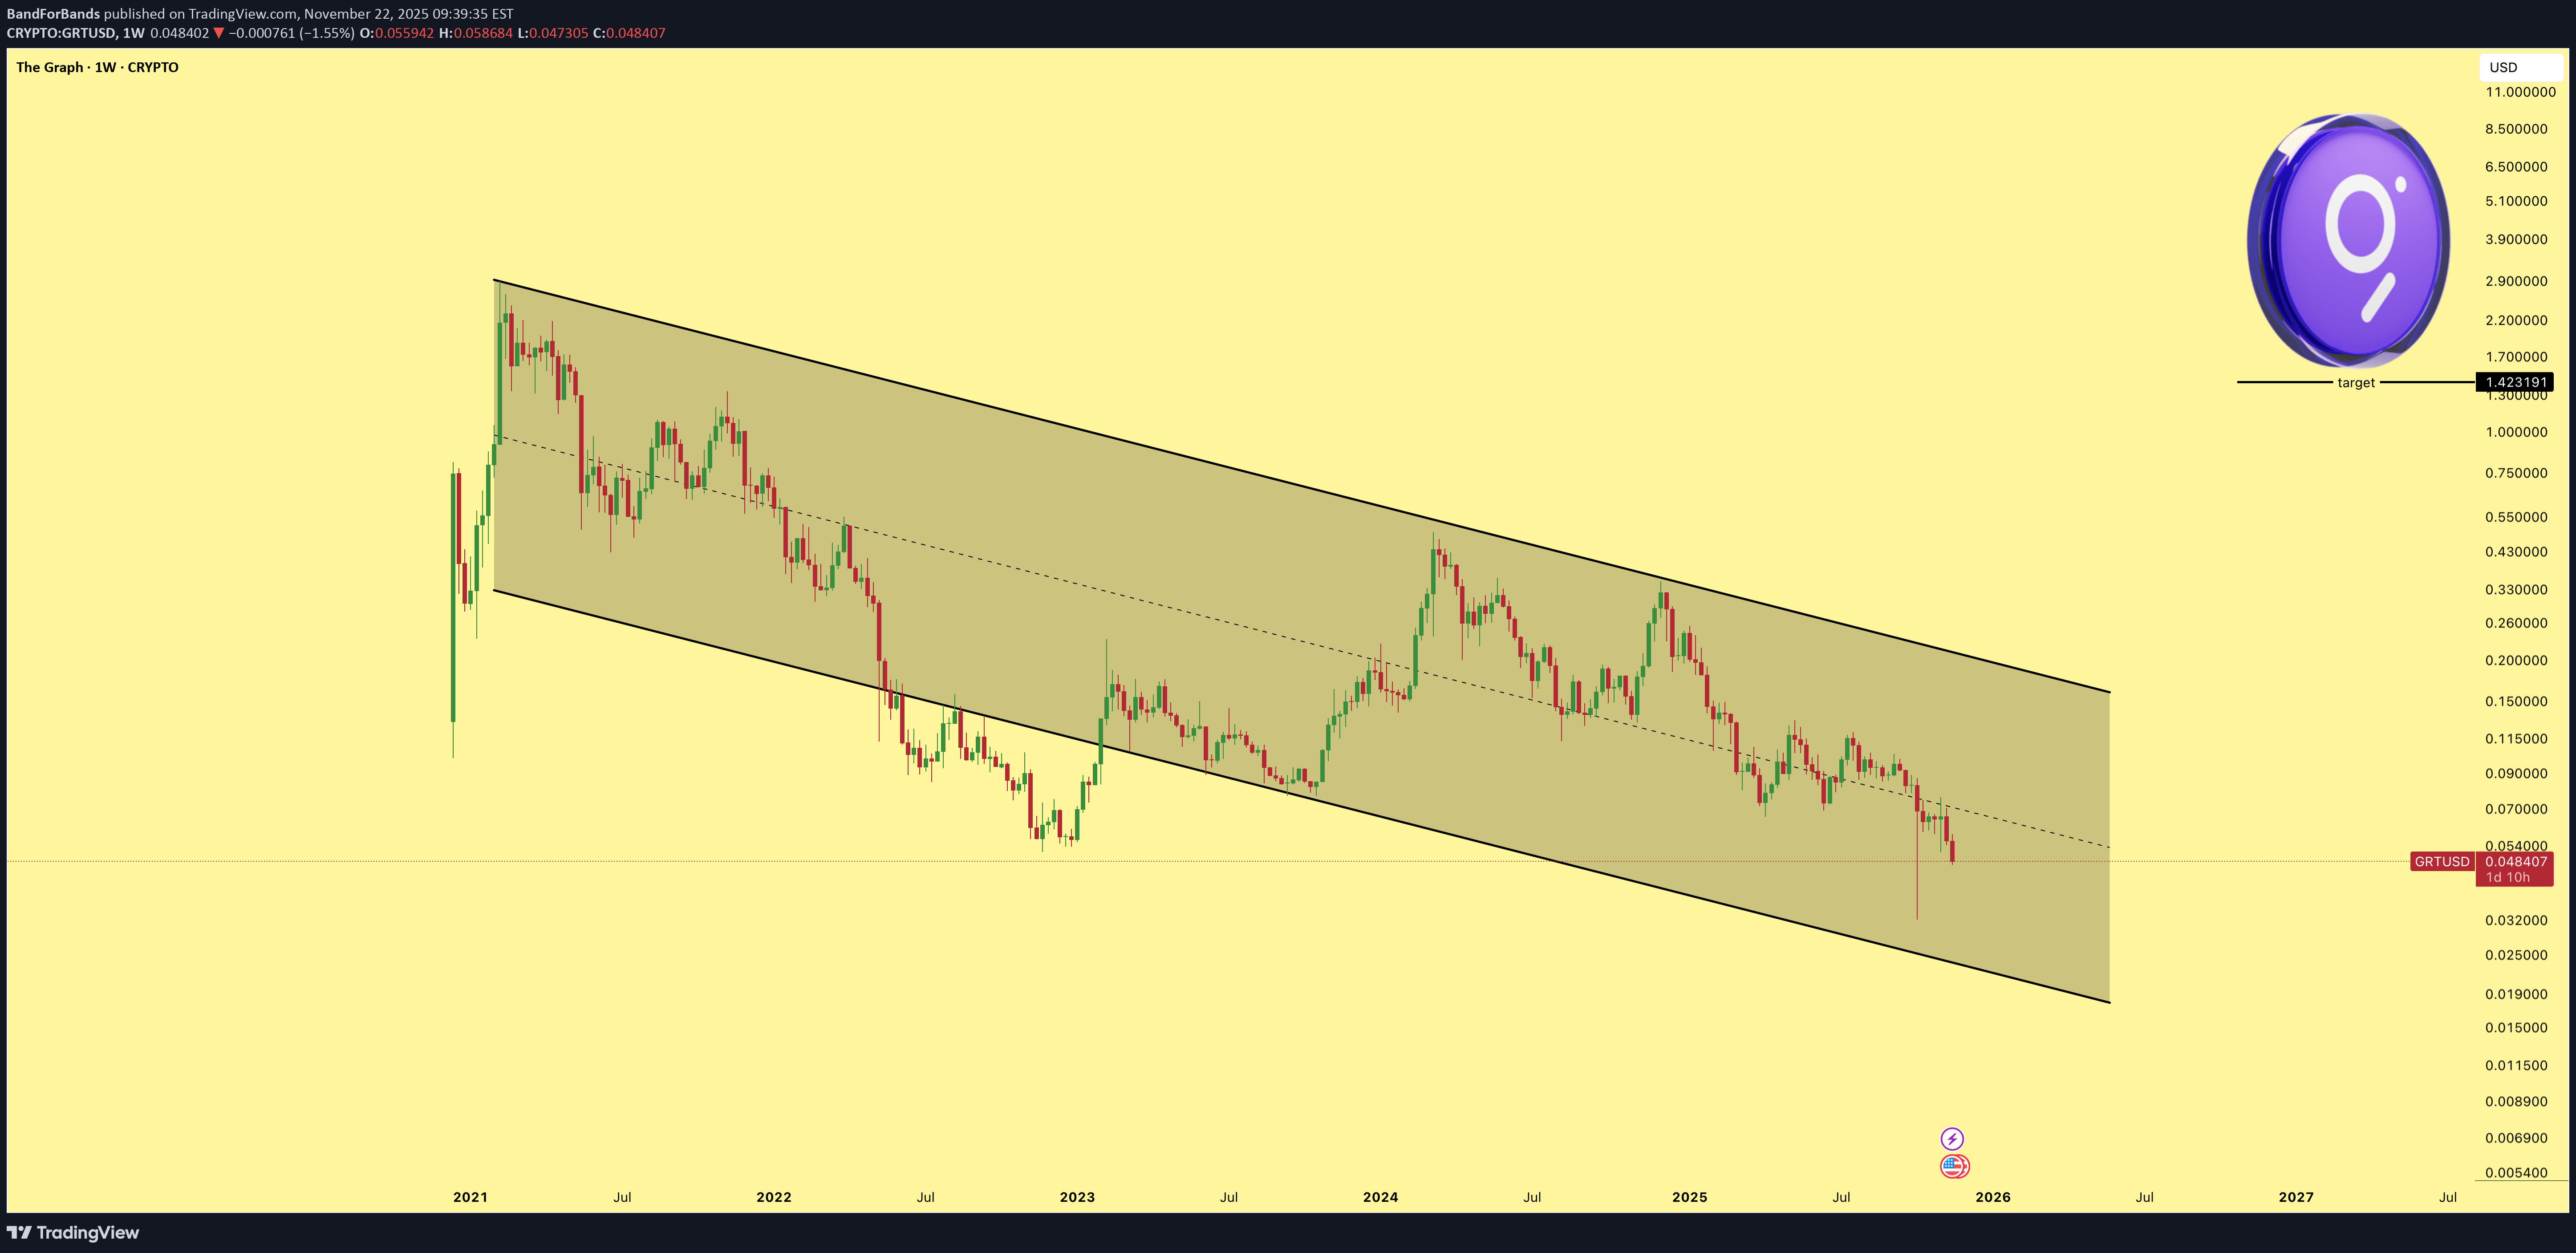
**آیا GRT آماده انفجار است؟ پیشبینی جسورانه برای سال آینده و هدف قیمت ۱.۴۰ دلار**

shamanica
تحلیل تکنیکال GRT: آیا نمودار گراف (The Graph) برای سرمایهگذاری آماده است؟
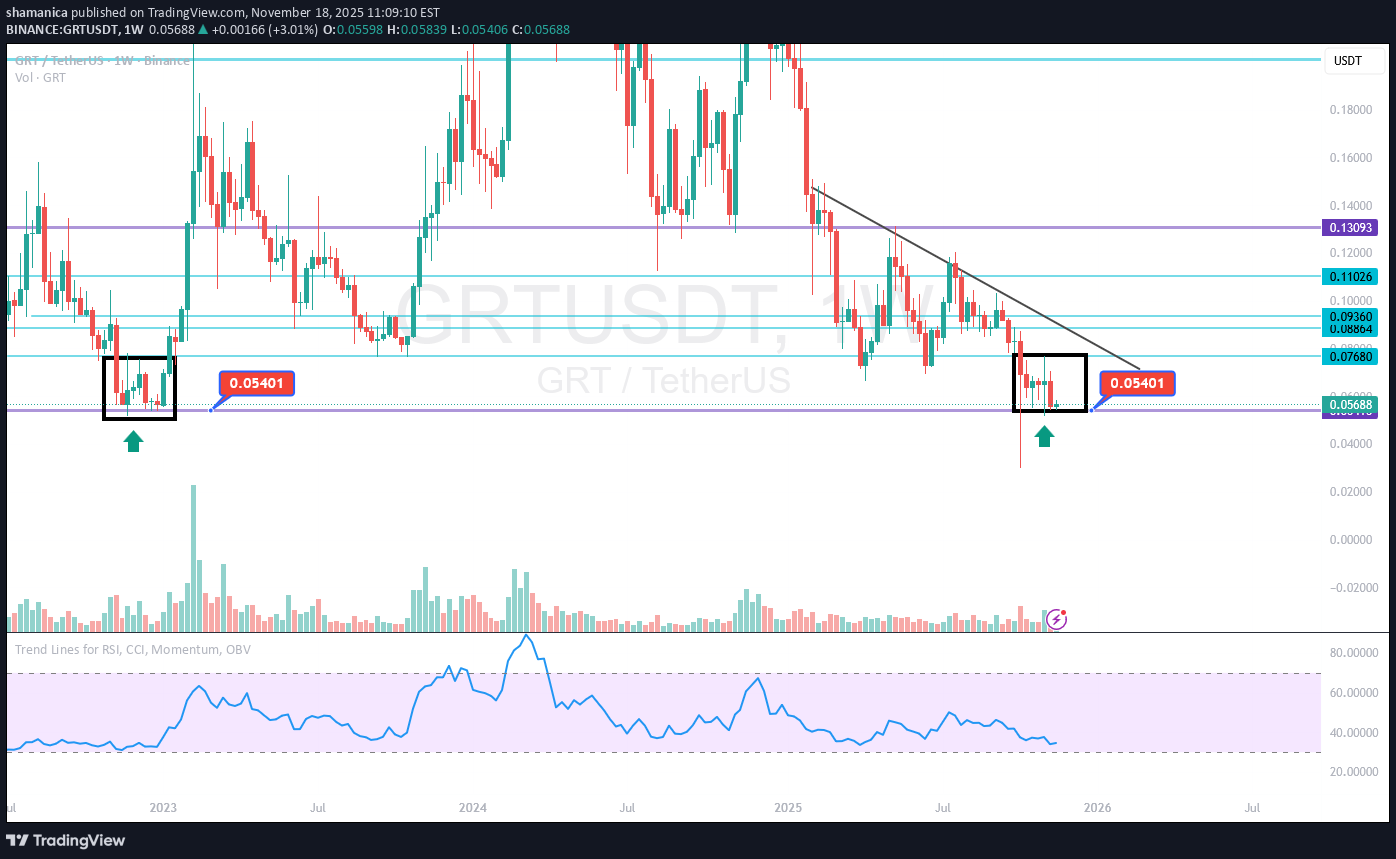
Hello everyone, After many years, I’m back with a fresh analysis of The Graph (GRT). This setup caught my attention, so I wanted to share my thoughts with you. On the weekly timeframe, I see a strong support level around 0.054. As long as the weekly candle does not close below this level, I expect a bullish move from GRT. The Graph is a highly important project for the Ethereum ecosystem, and in my opinion, Ethereum relies heavily on The Graph. At these price levels, the chart looks attractive, and with a calculated risk-to-reward ratio, it could offer a solid opportunity. This is not financial advice; everyone is responsible for their own risk.
BandForBands
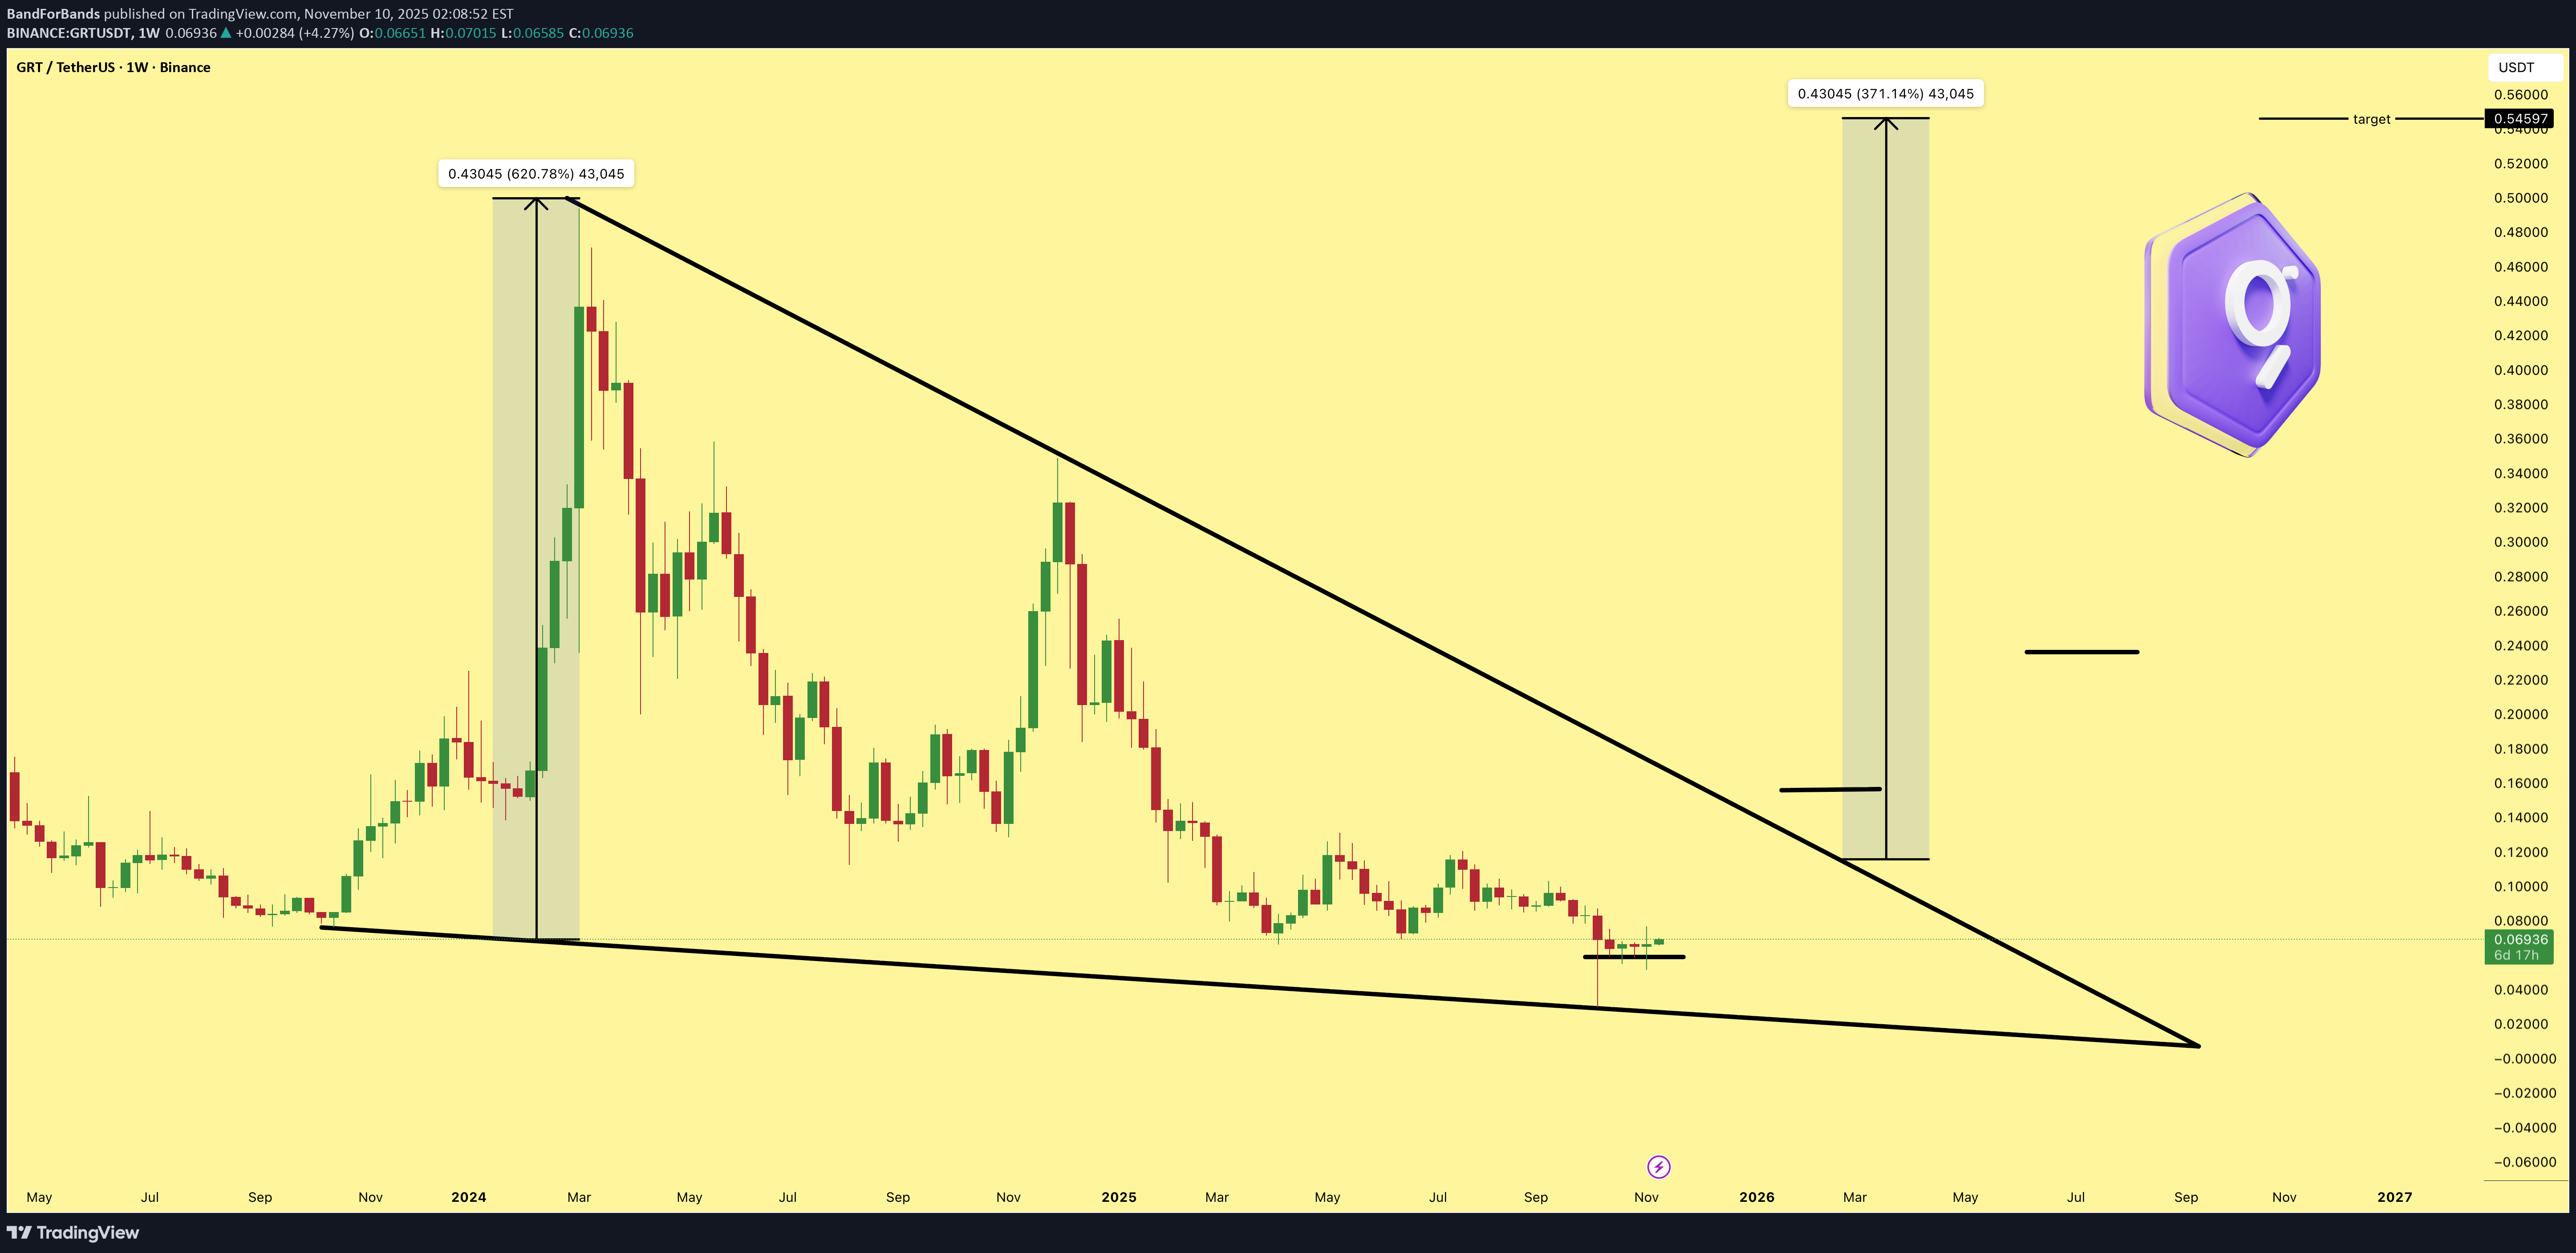
صعود انفجاری GRT: اهداف شگفتانگیز تا ۵ دلار!
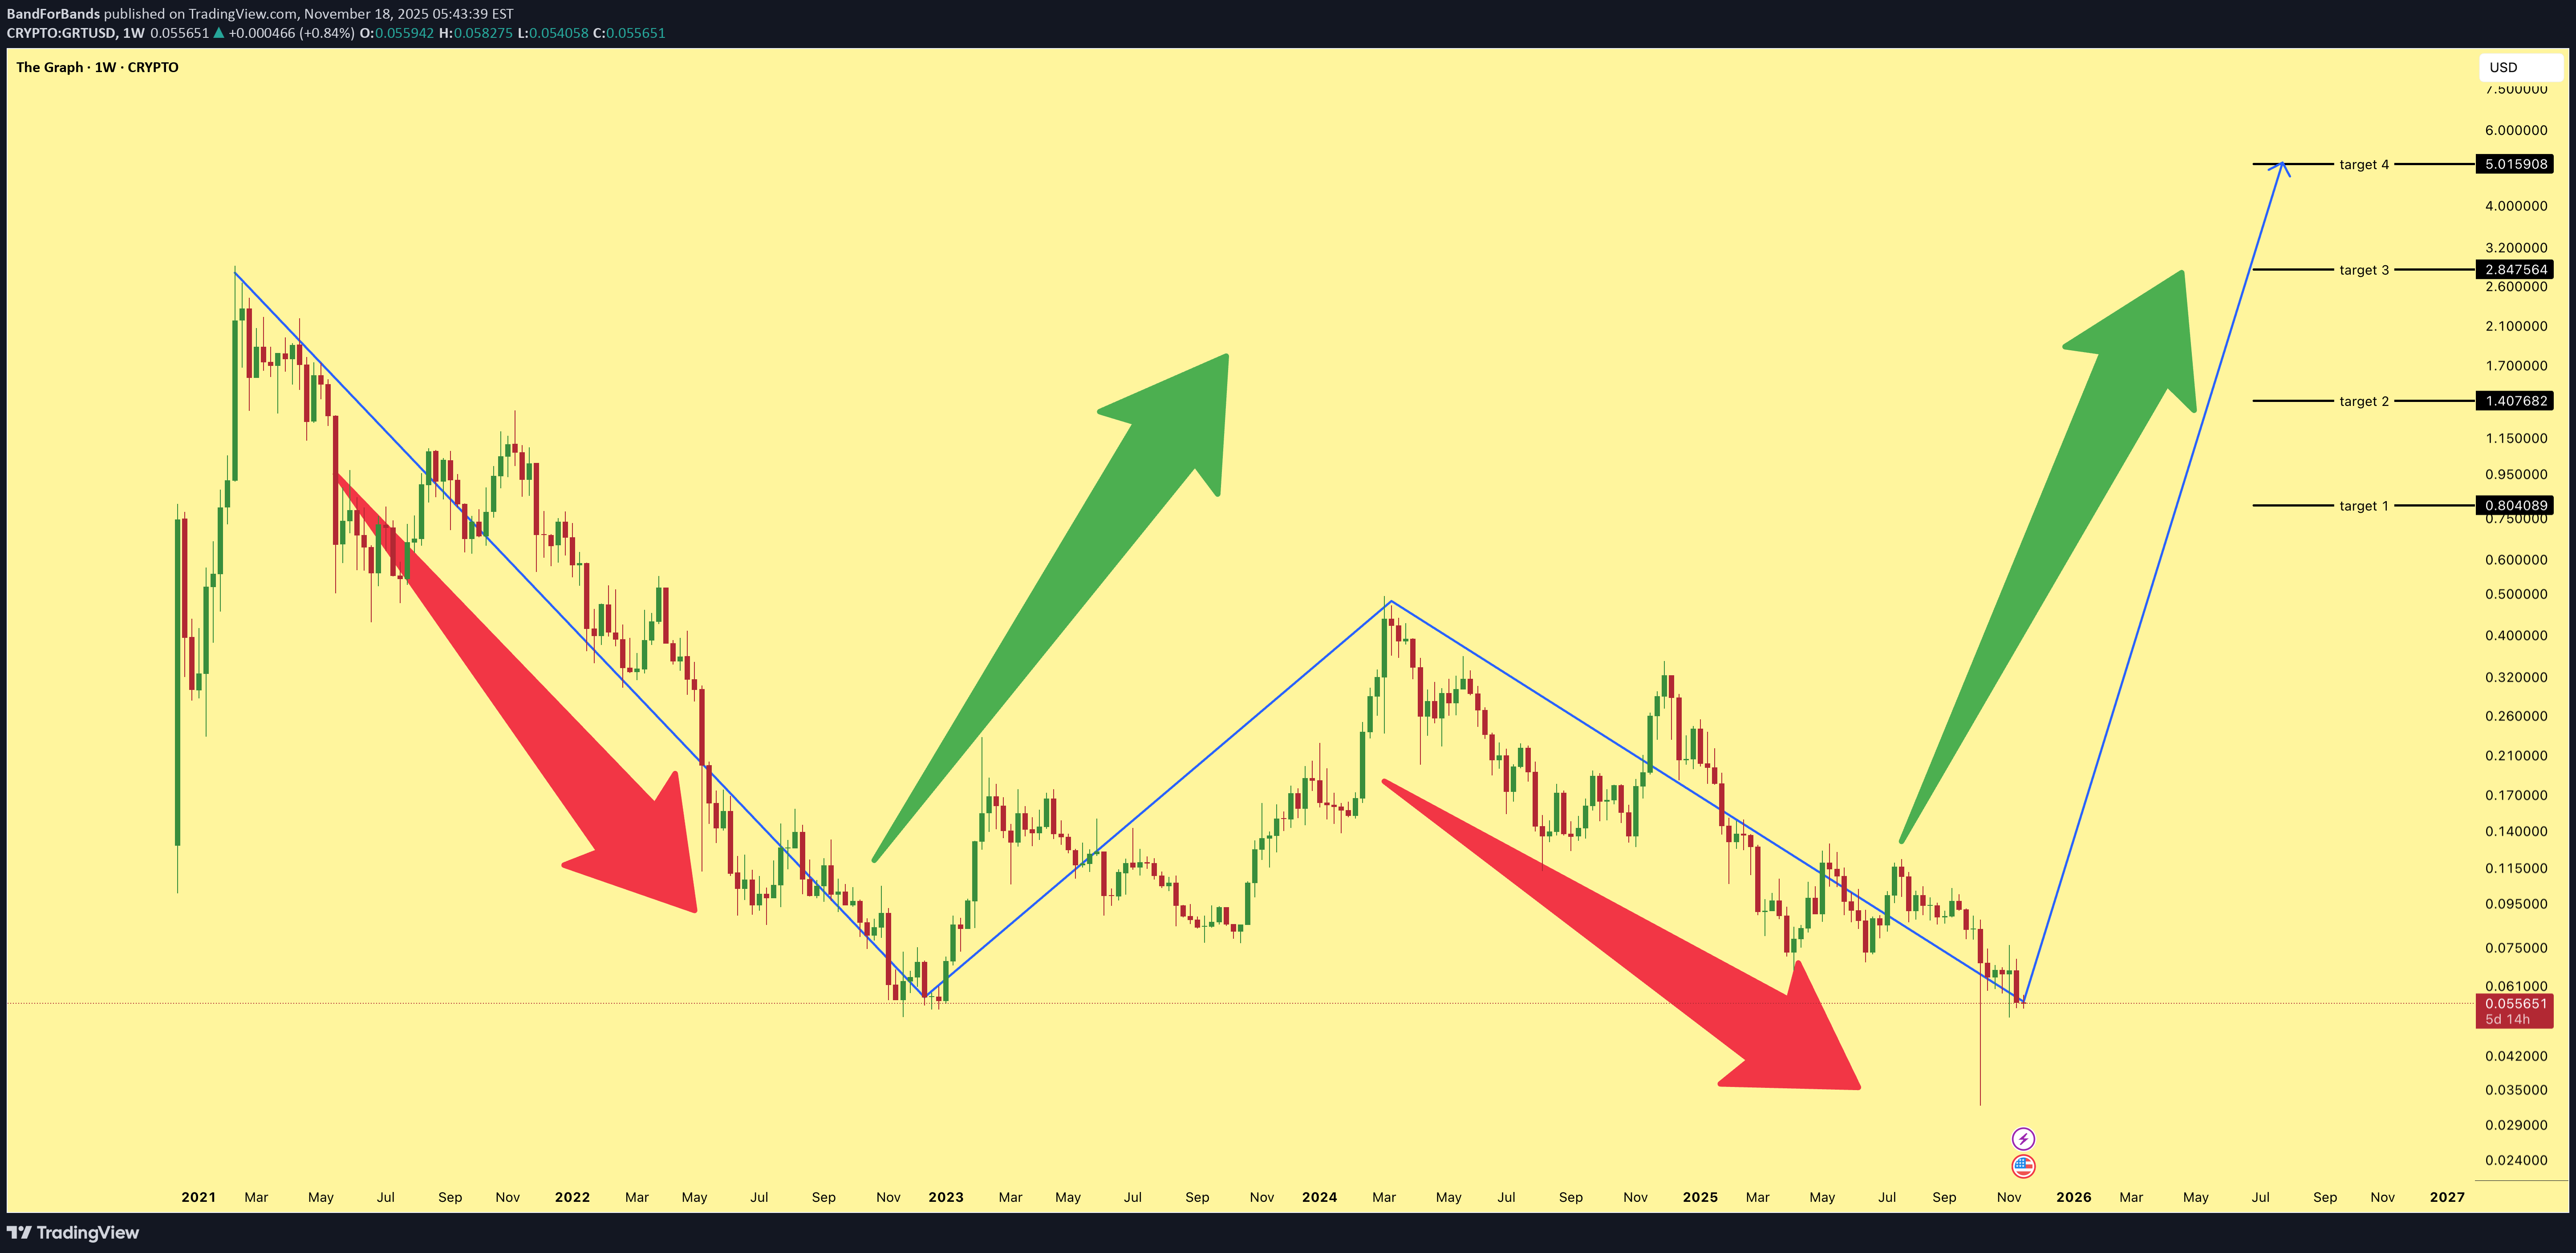
GRT is lining up for a multi stage expansion. Target 1 at $0.80 Target 2 at $1.40 Target 3 at $2.80 Target 4 at $5 The structure supports sustained upside as long as support holds and momentum continues to build.
BandForBands
BandForBands

leilizamanipour
تحلیل تکنیکال GRT: آیا قیمت گراف به ۰.۵۰ دلار و حتی ۱ دلار میرسد؟
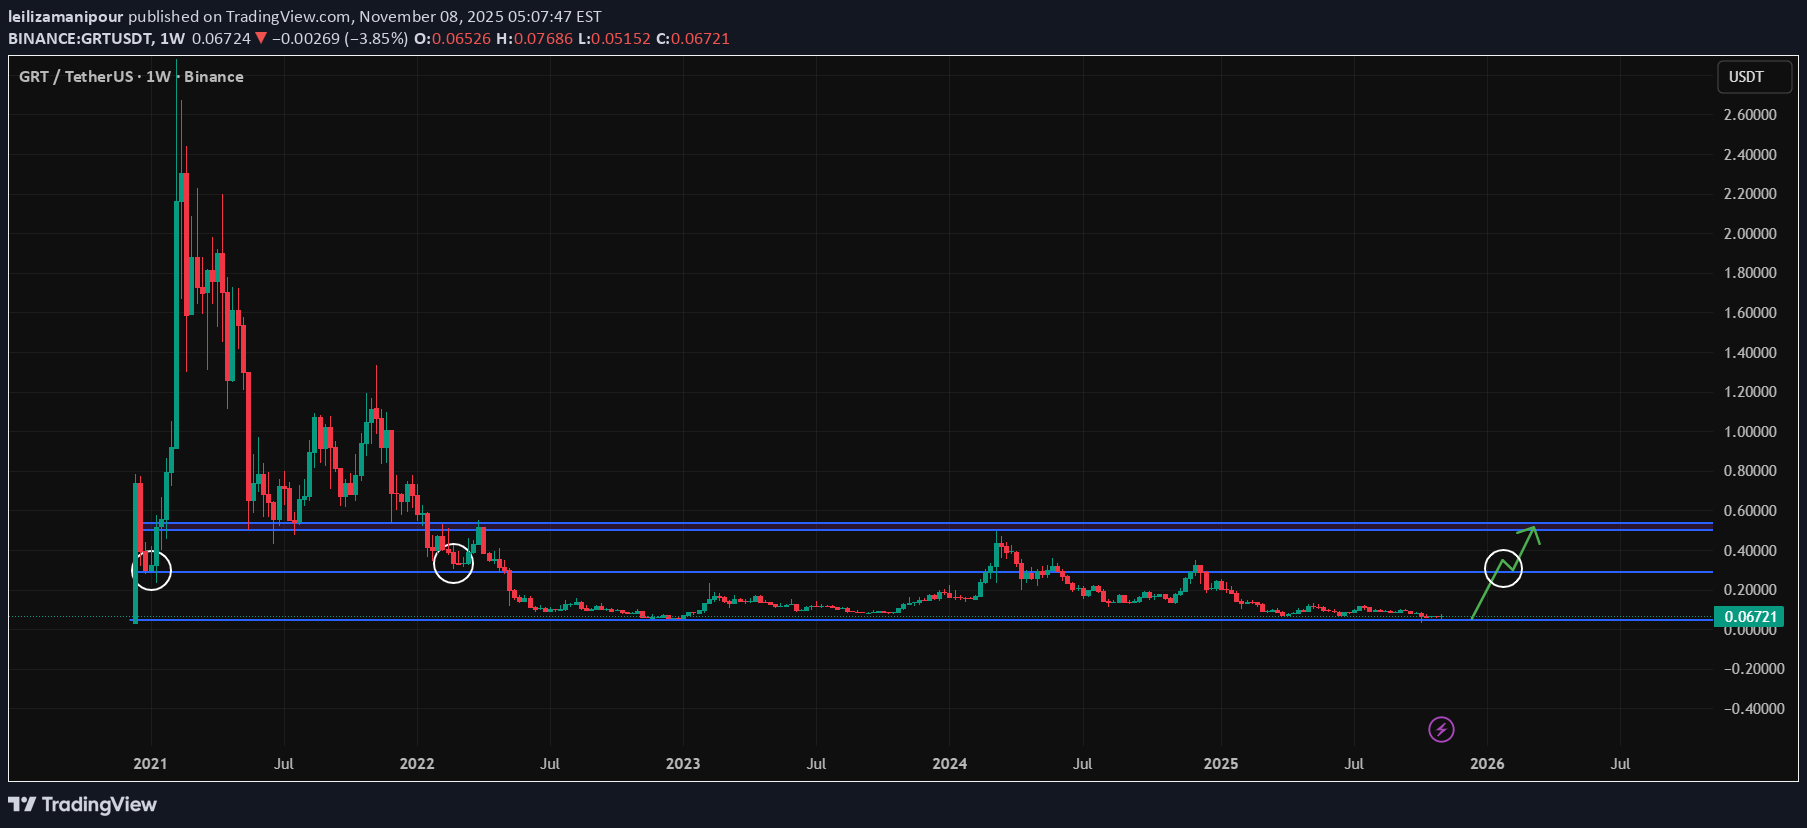
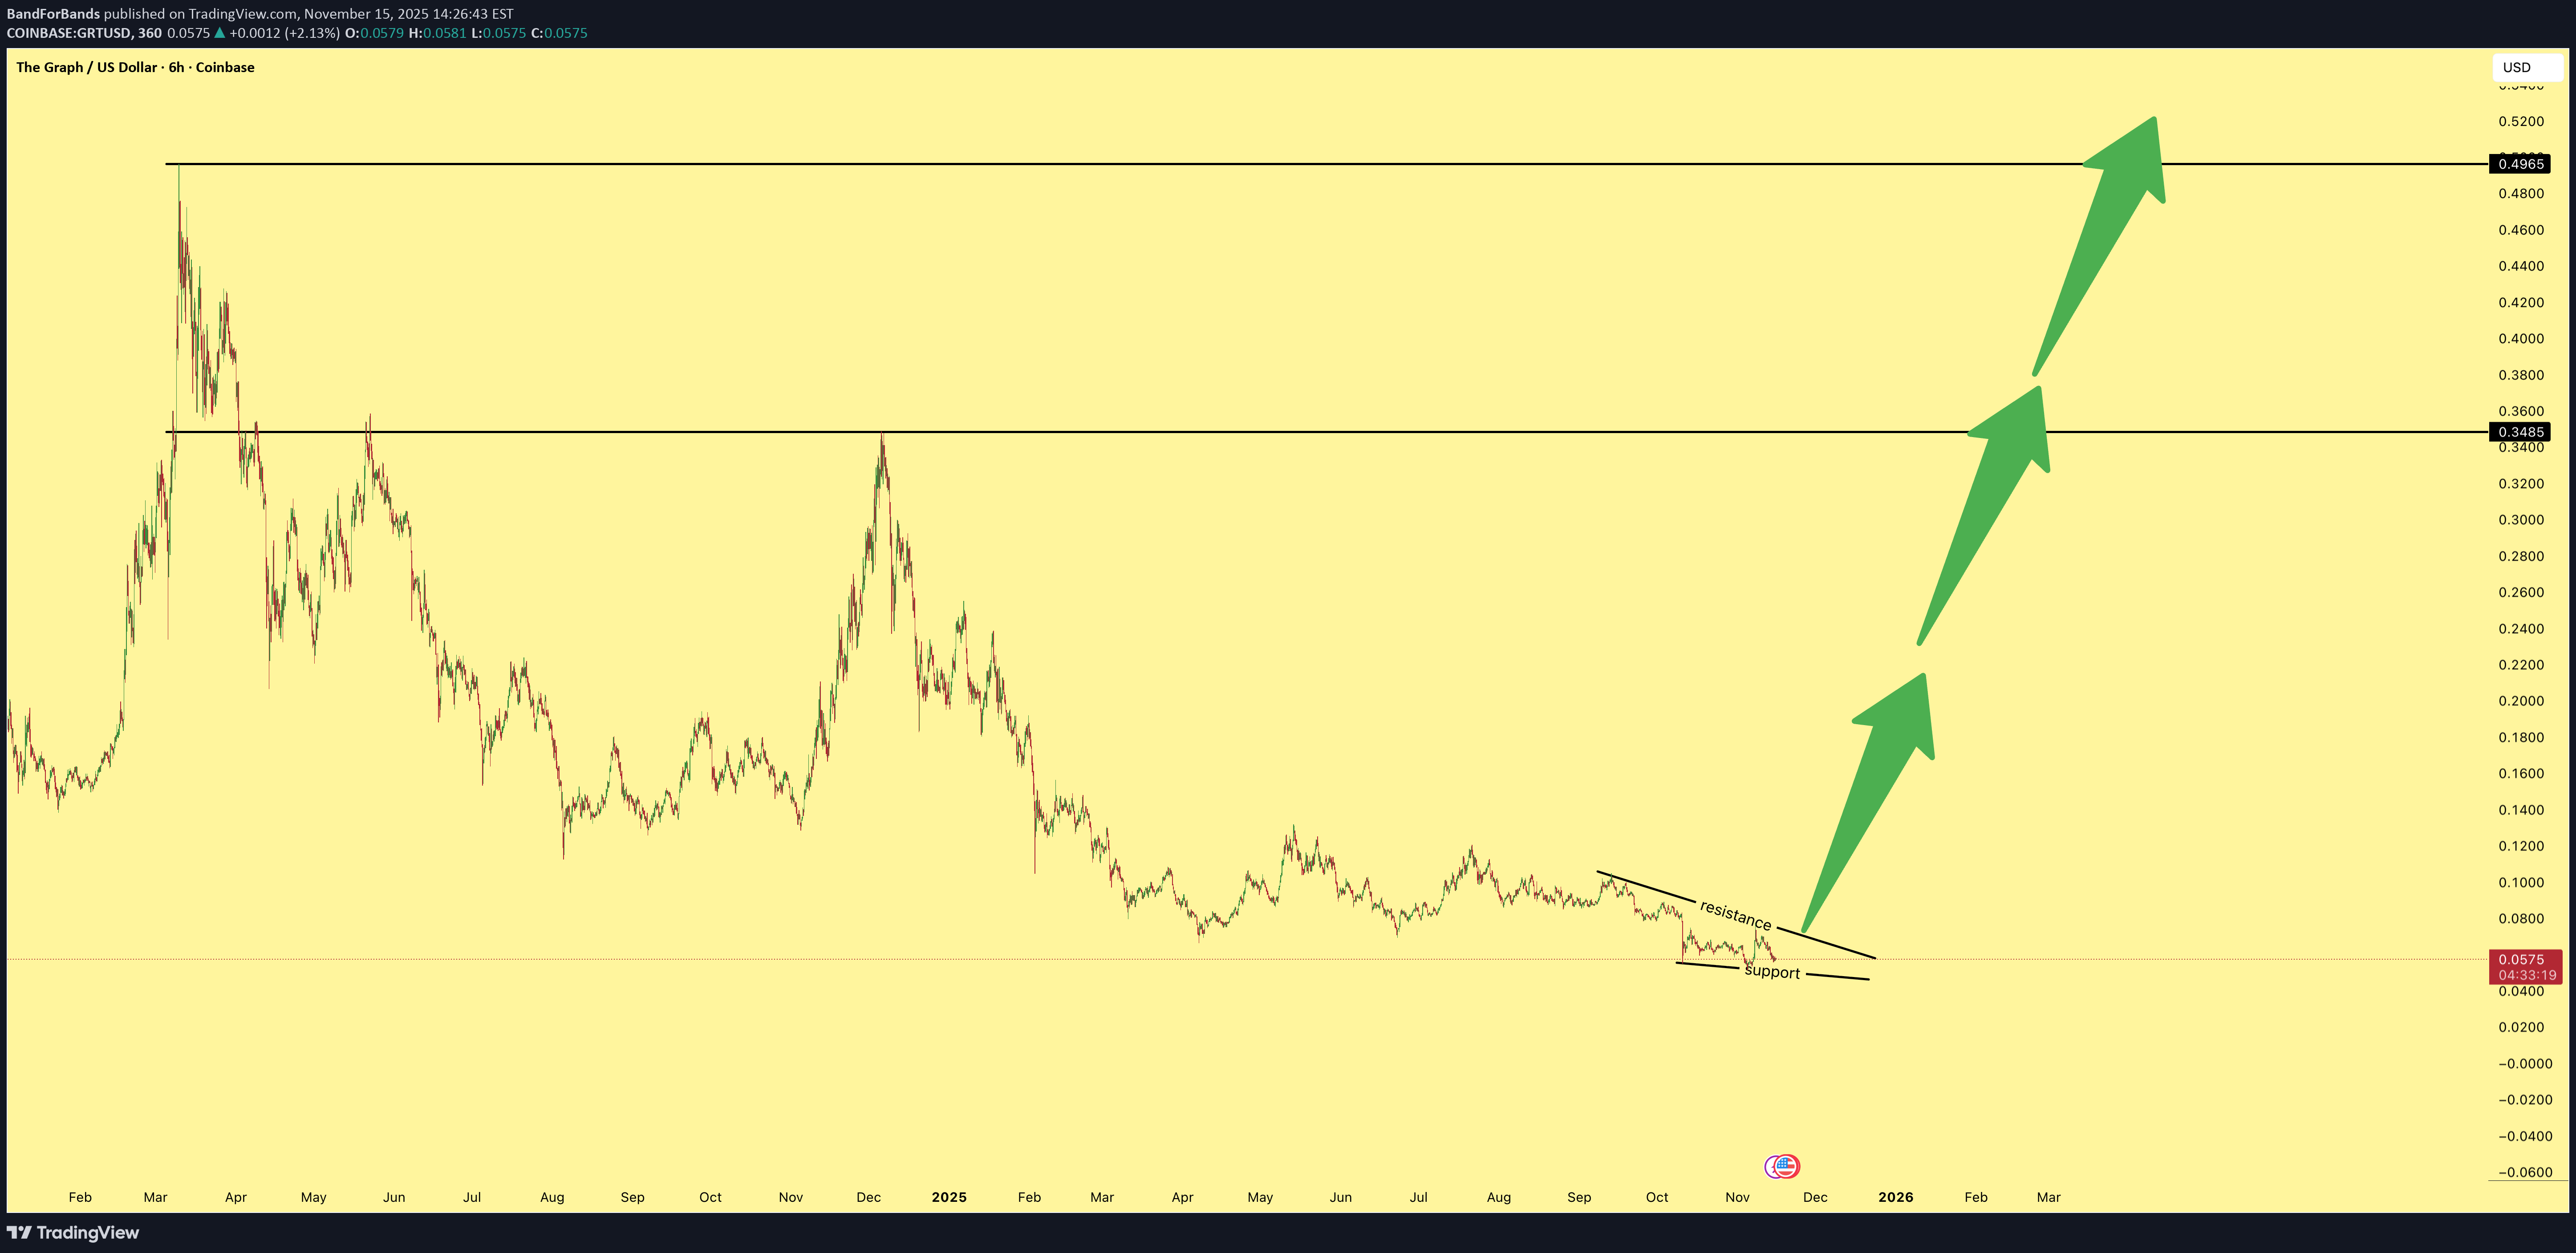
The Graph on the weekly time frame shows points that multiply the attractiveness of this currency. Considering the holding of 229 million Graph tokens, and the total supply of tokens of this currency, and most importantly, the price that is even trading below the initial offering price. We can be optimistic that the price of this currency will reach $ 0.15 in the short term. But its medium-term goals are $ 0.30 and the long-term goal is $ 0.50. However, with the entry of smart money, the price growth to $ 1 is possible.
Disclaimer
Any content and materials included in Sahmeto's website and official communication channels are a compilation of personal opinions and analyses and are not binding. They do not constitute any recommendation for buying, selling, entering or exiting the stock market and cryptocurrency market. Also, all news and analyses included in the website and channels are merely republished information from official and unofficial domestic and foreign sources, and it is obvious that users of the said content are responsible for following up and ensuring the authenticity and accuracy of the materials. Therefore, while disclaiming responsibility, it is declared that the responsibility for any decision-making, action, and potential profit and loss in the capital market and cryptocurrency market lies with the trader.