
GNO
Gnosis
| تریدر | نوع سیگنال | حد سود/ضرر | زمان انتشار | مشاهده پیام |
|---|---|---|---|---|
No results found. | ||||
Price Chart of Gnosis
سود 3 Months :
سیگنالهای Gnosis
Filter
Sort messages by
Trader Type
Time Frame

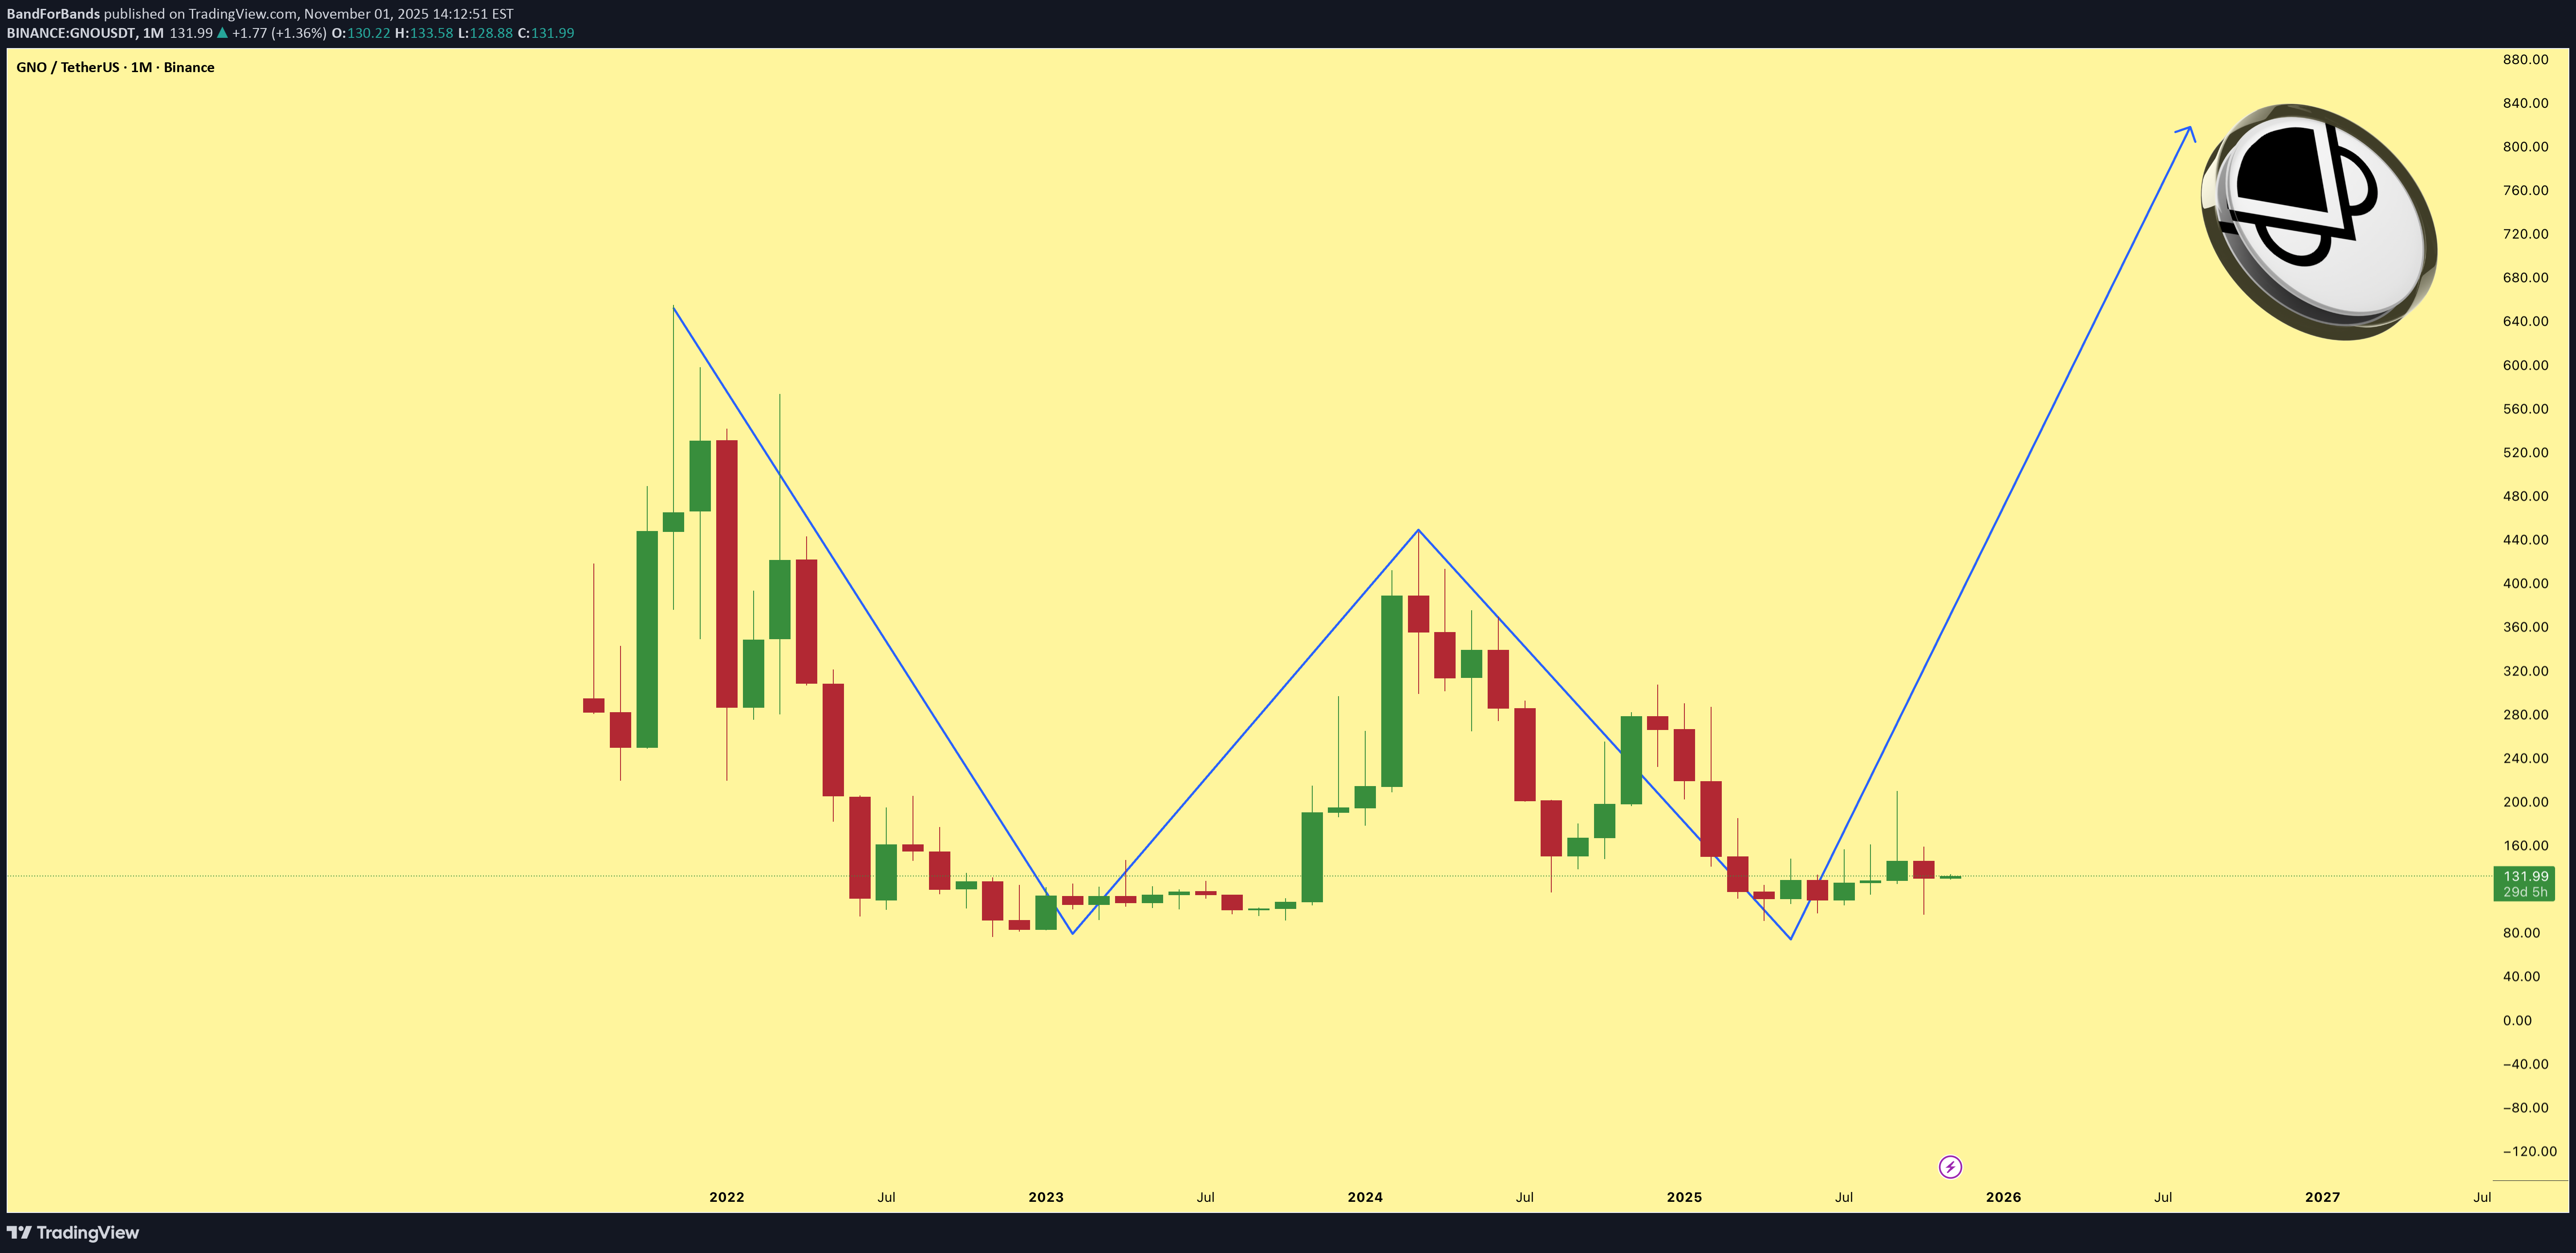
BandForBands

Bithereum_io
GNOUSDT 1D

#GNO is moving inside an ascending triangle on the daily chart. It has bounced off the triangle support line and the daily SMA200 and is now on the verge of breaking out above the resistance zone. If that happens, the potential targets are: 🎯 $172.35 🎯 $191.60 🎯 $219.00 🎯 $253.90 ⚠️ Always remember to use a tight stop-loss and follow proper risk management.

Alpha-GoldFX
GNOUSDT Forming Bullish Momentum

GNOUSDT has recently shown a strong breakout from its consolidation zone, signaling renewed bullish momentum in the market. The chart structure indicates a breakout above a key resistance level that has now turned into support, providing strength to the ongoing upward move. With volume supporting this breakout, traders are eyeing a potential rally that could deliver gains of 30% to 40%+ in the coming sessions. This bullish setup reflects the confidence of investors who are actively accumulating at these levels. The steady increase in volume is a strong confirmation of growing market participation, which often fuels sustained rallies. If the price continues to hold above the breakout zone, GNOUSDT may enter into a new bullish wave, attracting both short-term traders and long-term investors. Investors are closely monitoring this crypto pair as it shows resilience and momentum after a prolonged accumulation phase. With clear breakout signals and improving sentiment, the upside potential remains strong, and the path towards higher levels seems more achievable. This makes GNOUSDT a pair worth watching for potential opportunities in the days ahead. ✅ Show your support by hitting the like button and ✅ Leaving a comment below! (What is You opinion about this Coin) Your feedback and engagement keep me inspired to share more insightful market analysis with you!

GNO/USD Fiyat Hareketi Son Dalga 5'e Hazırlanıyor
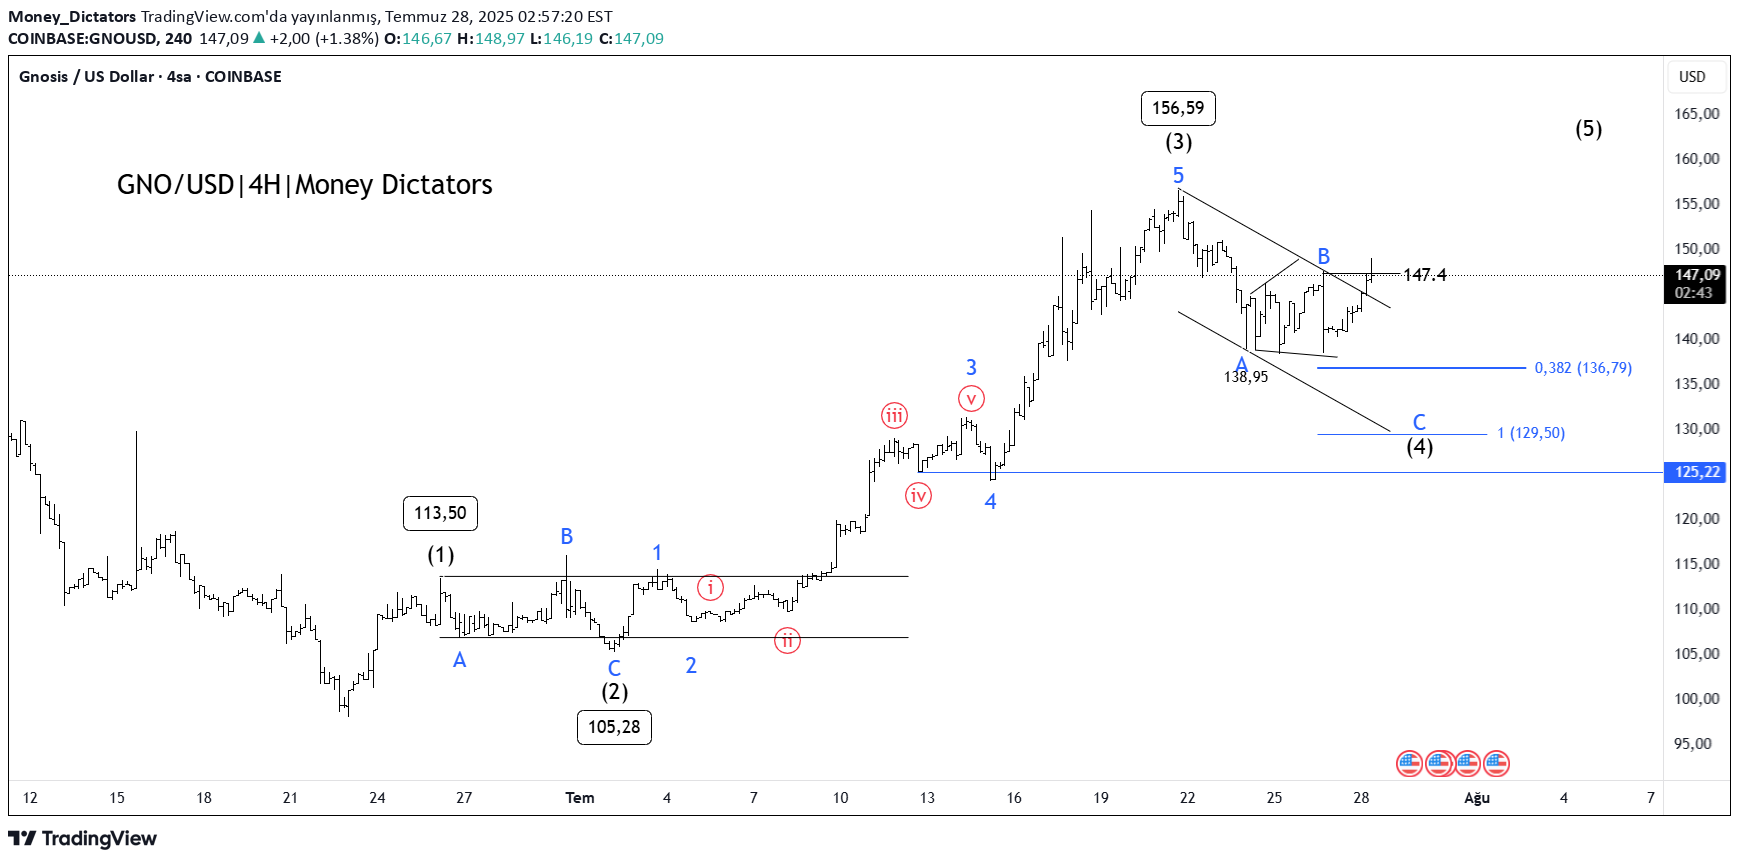
GNO/USD pair is unfolding a clean Elliott Wave impulse pattern on the 4-hour chart. The rally began with Wave (1) reaching 113.50, followed by a corrective Wave (2) that bottomed near 105.28. This set the stage for a powerful Wave (3) that surged to 156.59, aligning well with Elliott Wave theory, where Wave 3 is typically the strongest and steepest leg in the sequence. Wave (4) is now in progress, taking the form of an A-B-C correction inside a descending channel. Interim support was found at 138.95 during Wave A, and Wave C could extend toward the 0.382 Fibonacci retracement level at 136.79 or the deeper support zone near 129.5. These levels are crucial, as they often mark the end of a corrective phase and the beginning of the next impulse. A confirmed breakout above 147.4 would signal the start of Wave (5) and the return of bullish momentum. Short-term targets have the potential to reach 135 – 128 , while 125.22 remains the invalidation level for this bullish setup. After the completion of Wave (4), traders can look for long opportunities targeting 147 – 154 – 172 . As long as the structure holds and price respects key supports, the outlook remains favorable for a fresh push higher in Wave (5).
GNO/USD Price Action Aligns for Final Wave 5 Push
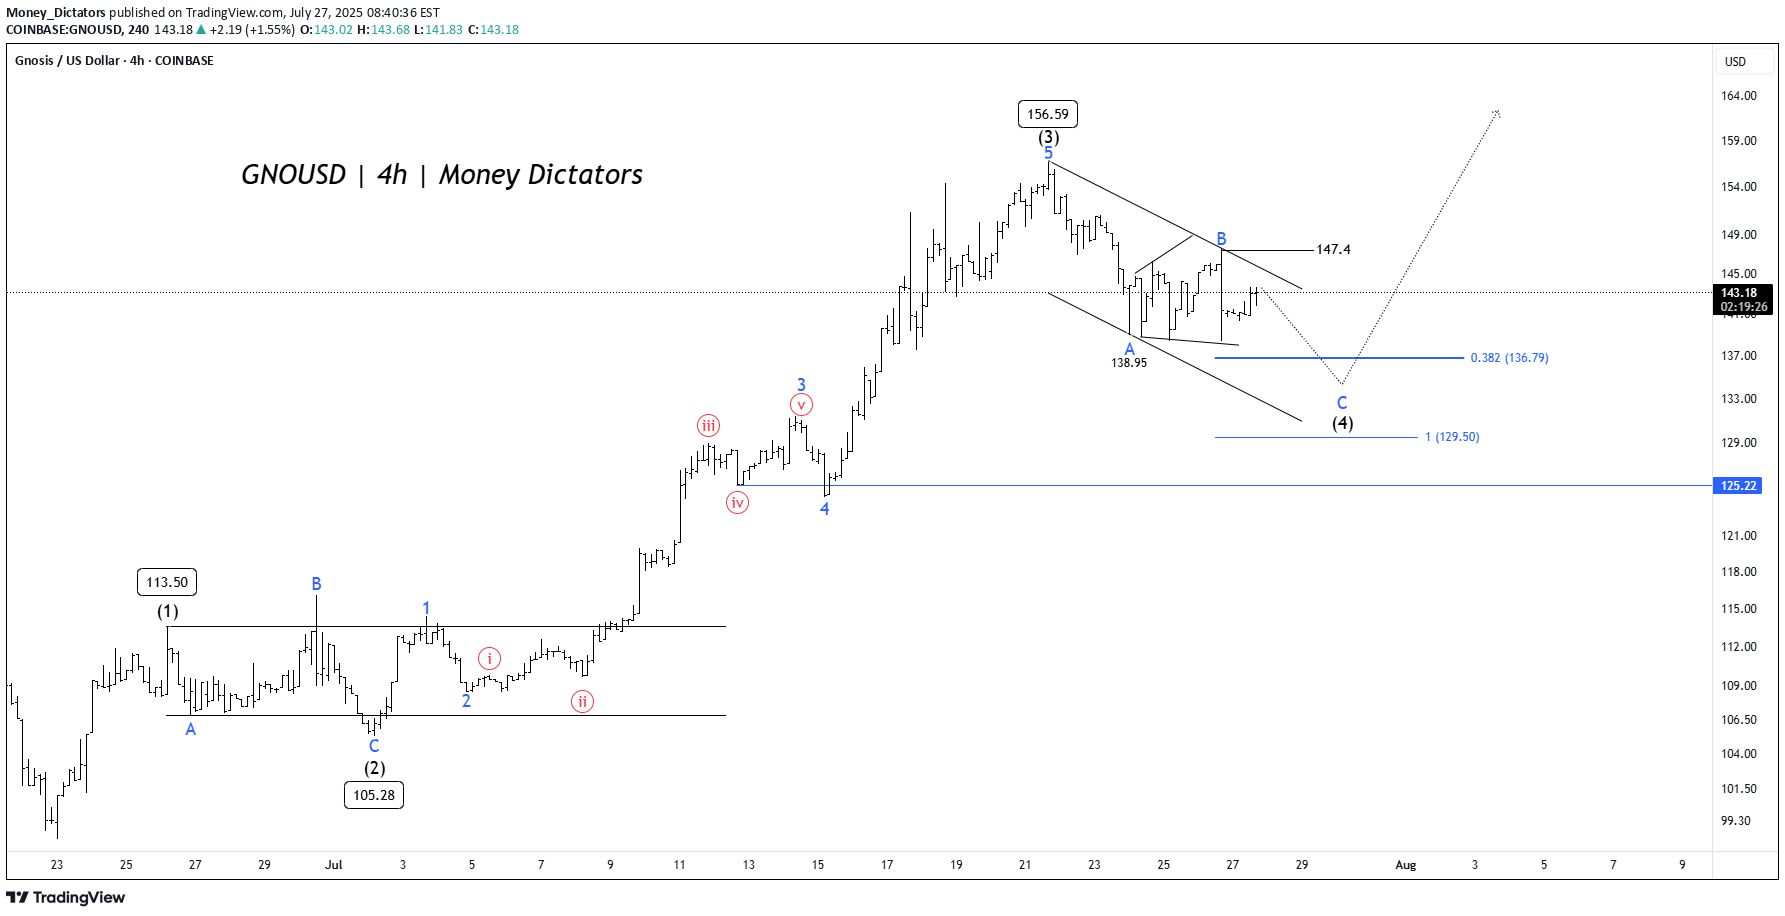
GNO/USD pair is unfolding a clean Elliott Wave impulse pattern on the 4-hour chart. The rally began with Wave (1) reaching 113.50, followed by a corrective Wave (2) that bottomed near 105.28. This set the stage for a powerful Wave (3) that surged to 156.59, aligning well with Elliott Wave theory where Wave 3 is typically the strongest and steepest leg in the sequence. Wave (4) is now in progress, taking the form of an A-B-C correction inside a descending channel. Interim support was found at 138.95 during Wave A, and Wave C could extend toward the 0.382 Fibonacci retracement level at 136.79 or the deeper support zone near 129.5. These levels are crucial, as they often mark the end of a corrective phase and the beginning of the next impulse. A confirmed breakout above 147.4 would signal the start of Wave (5) and the return of bullish momentum. Short-term targets have the potential to reach 135 – 128 , while 125.22 remains the invalidation level for this bullish setup. After the completion of Wave (4), traders can look for long opportunities targeting 147 – 154 – 172 . As long as the structure holds and price respects key supports, the outlook remains favorable for a fresh push higher in Wave (5).

MuhammadKamran83
GNOUSDT

GNOUSDT is making new Higher Highs and Higher Lows it is good to buy after breakout of Higher High

ProfittoPath
Trade Setup Analysis (30-min Chart)!

🔍 ✅ Trade Type: Long (Bullish)🔰 Entry Zone:Price is breaking a falling wedge pattern near $131.88, confirmed by:Bullish breakout from downtrend line (white line).Support bounce near the yellow horizontal line (~$130.00).🛑 Stop-Loss (SL):$129.68Below the recent support — logical invalidation level.🎯 Take-Profit (TP) Levels:TP1: $135.65 (red line – previous resistance)TP2: $139.09 (green line – major horizontal resistance)📊 Risk-to-Reward Ratio:Excellent — roughly 1:3 R:R, depending on entry precision.🔄 Technical Highlights:Falling wedge (bullish reversal pattern) is breaking out.Multiple rejection wicks at the bottom support line (accumulation sign).Potential reversal from oversold conditions.

wolffxtrader
GNO : BULLS ARE HERE

hello traders how are you today?as you can see price started a huge spike and i think bulls are coming back and i want to buy at the correctionbe safe enjoy.

Chartoholic

GNOUSDT steady price action is promising, targets shown on the chart. I would stop on daily close below 50 MA or daily close below 250$.P.S. My views only not financial advice!

CryptoAdana
GNO/USDT TEKNİK ANALİZİ

* Coin : GNO/USDT* Chart timeframe : 1 Day* Supportive Side Condition :➡️ Change Candle Color ➡️ HodL Line ➡️Engineeringrobo Cloud Signal* People's pulse : GREEN 4* Correlation with BTC; 0.24* Volatility ; % 13.46* 24-Hour Volume : LOW* Smart Money (Following whales): INStrategy;➡️ AI Buy with BUY, 21.09.2024➡️ Make some profit at resistance levels,➡️ AI Wait until you see SELL. 21.09.2024 tr.de AI Buy signal, 25.10.2024 tr.de Engineeringrobo Cloud Buy signals were received. I shared the 3X profit potential existing coin project by integrating it with Engineeringrobo and technical analysis. I wish you abundant earnings. The investment information, comments and recommendations provided herein are not within the scope of investment consultancy. Investment consultancy services are provided within the framework of an investment consultancy agreement to be signed between brokerage firms, portfolio management companies, non-deposit banks and the customer. The comments and recommendations provided herein are based on the personal opinions of those making the comments and recommendations. These opinions may not be suitable for your financial situation and risk and return preferences. Therefore, making an investment decision based solely on the information provided herein may not yield results that are in line with your expectations.
Disclaimer
Any content and materials included in Sahmeto's website and official communication channels are a compilation of personal opinions and analyses and are not binding. They do not constitute any recommendation for buying, selling, entering or exiting the stock market and cryptocurrency market. Also, all news and analyses included in the website and channels are merely republished information from official and unofficial domestic and foreign sources, and it is obvious that users of the said content are responsible for following up and ensuring the authenticity and accuracy of the materials. Therefore, while disclaiming responsibility, it is declared that the responsibility for any decision-making, action, and potential profit and loss in the capital market and cryptocurrency market lies with the trader.