
GMX
GMX
| تریدر | نوع سیگنال | حد سود/ضرر | زمان انتشار | مشاهده پیام |
|---|---|---|---|---|
No results found. | ||||
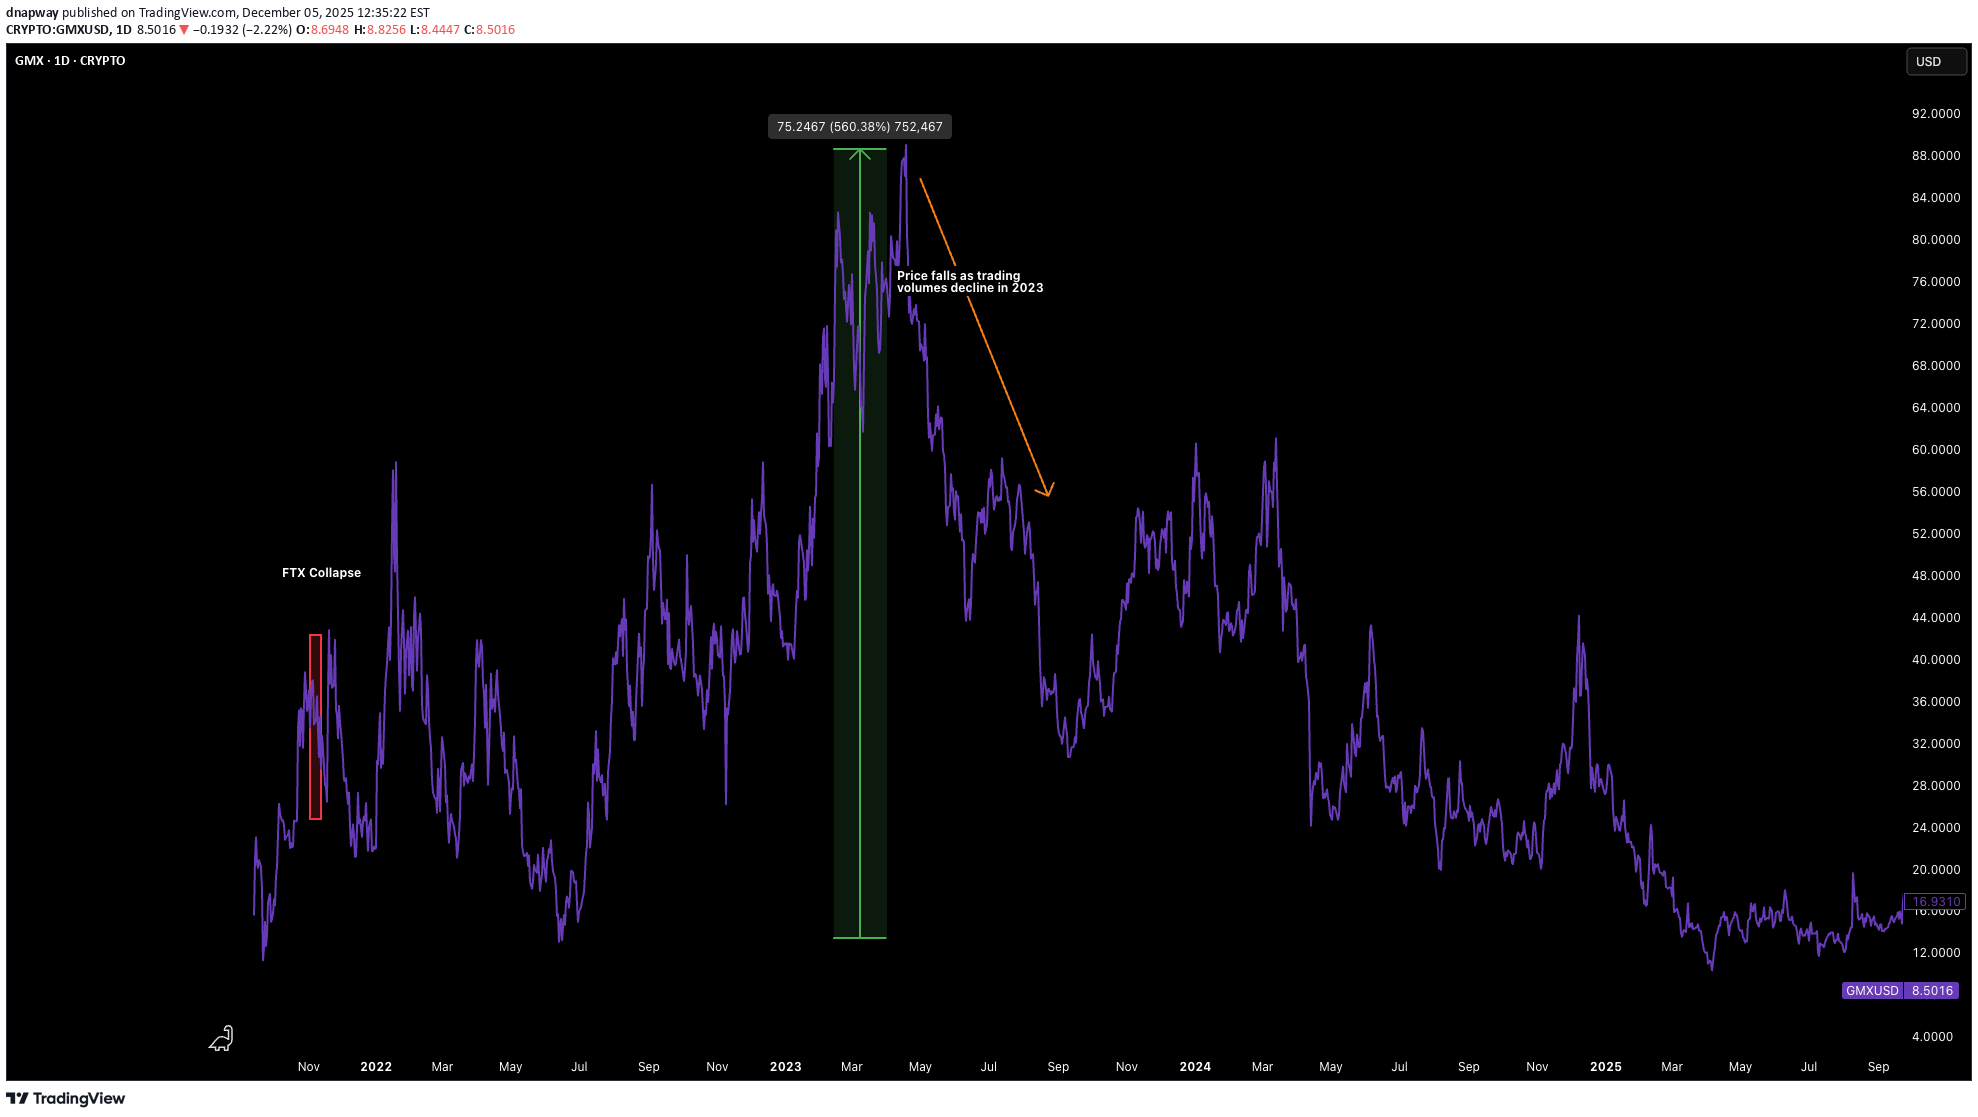
Price Chart of GMX
سود 3 Months :
سیگنالهای GMX
Filter
Sort messages by
Trader Type
Time Frame


Alpha-GoldFX
GMXUSDT Forming Bullish Continuation

GMXUSDT is currently trading within a consolidation zone, forming a contracting pattern that indicates a potential breakout ahead. With strong volume support and steady investor activity, this setup is gaining attention as a possible bullish continuation structure. Based on the technical outlook, GMXUSDT shows the potential for a 50% to 60%+ move if momentum builds and buyers push the price above key resistance levels. This kind of structure often signals accumulation, where smart money is preparing for the next upward move. A confirmed breakout from the pattern could trigger a rally toward higher resistance zones, making GMXUSDT an attractive opportunity for traders seeking medium-term gains. The current chart structure aligns with bullish market sentiment and offers a favorable risk-to-reward setup. Investor interest is steadily increasing, and the volume profile supports the possibility of a breakout-driven rally. If the trend follows through, GMXUSDT could experience significant price expansion in the coming weeks. Monitoring the breakout levels will be crucial, as a strong push above resistance may unlock fresh bullish momentum for this pair. ✅ Show your support by hitting the like button and ✅ Leaving a comment below! (What is You opinion about this Coin) Your feedback and engagement keep me inspired to share more insightful market analysis with you!

SHORT POSITION
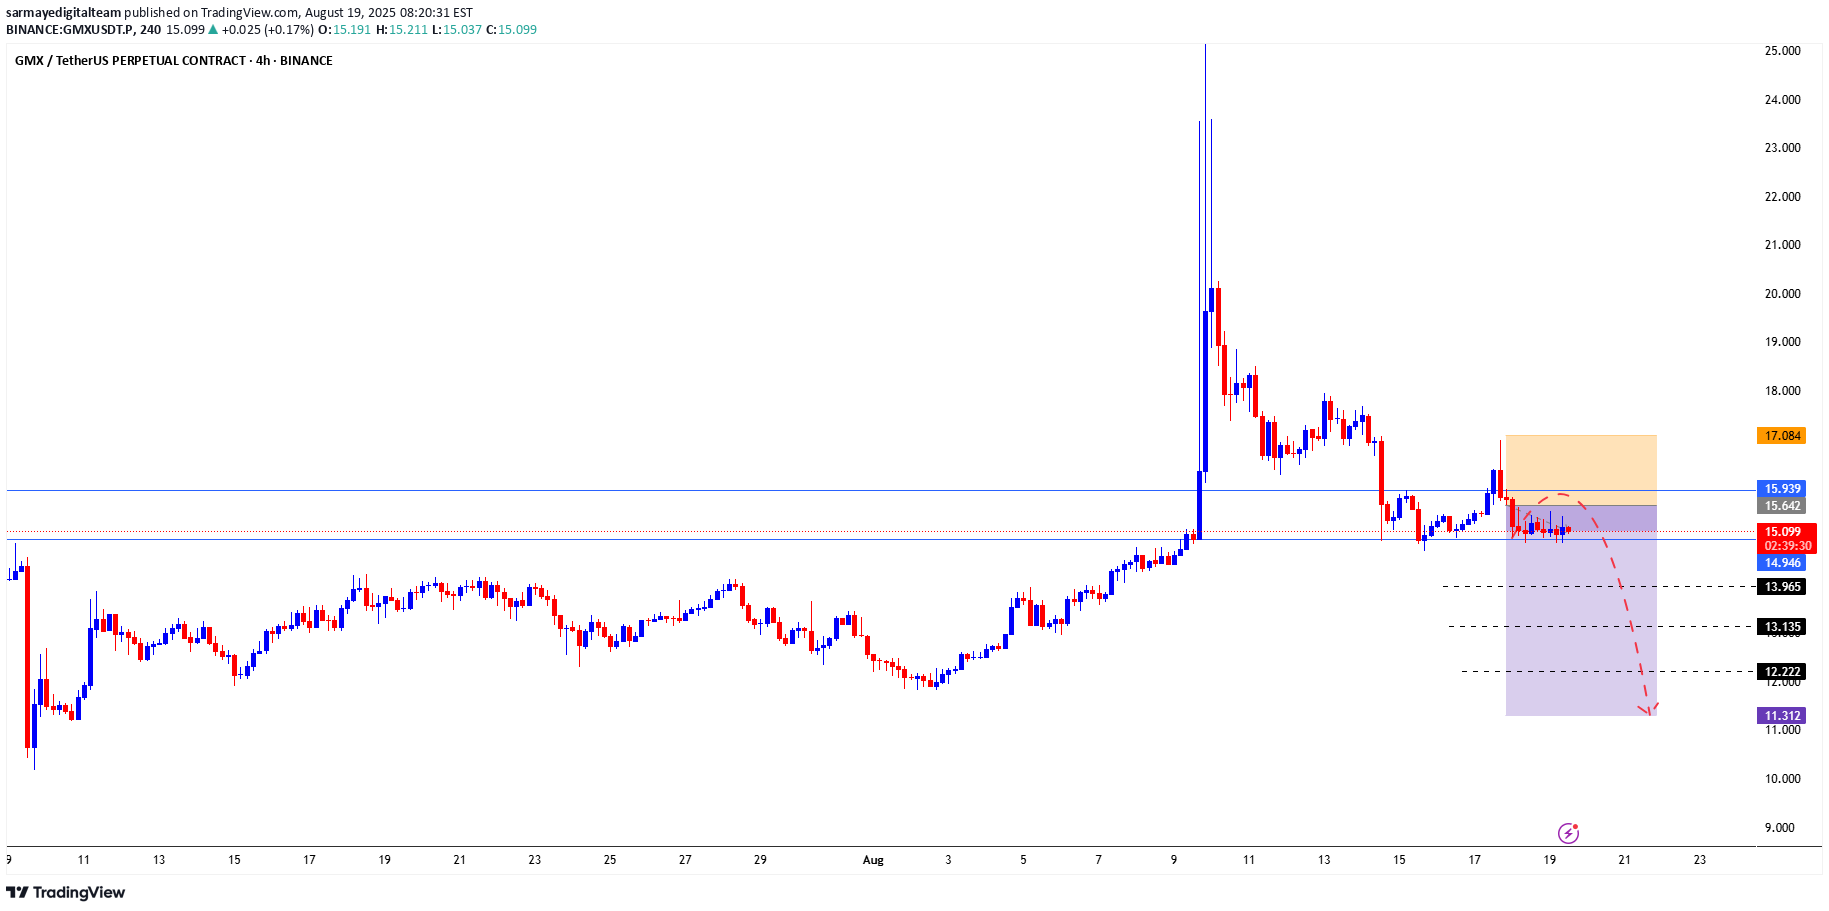
Everything is clear on the chart, the blue lines are entry points, and the black lines are price targets. Let’s go! SarmayeDigital Analytical Team

mohamed_yousef_elziny
BTC يثبت قوته.. وGMX على موعد مع انطلاقة مزدوجة من مناطق الطلب
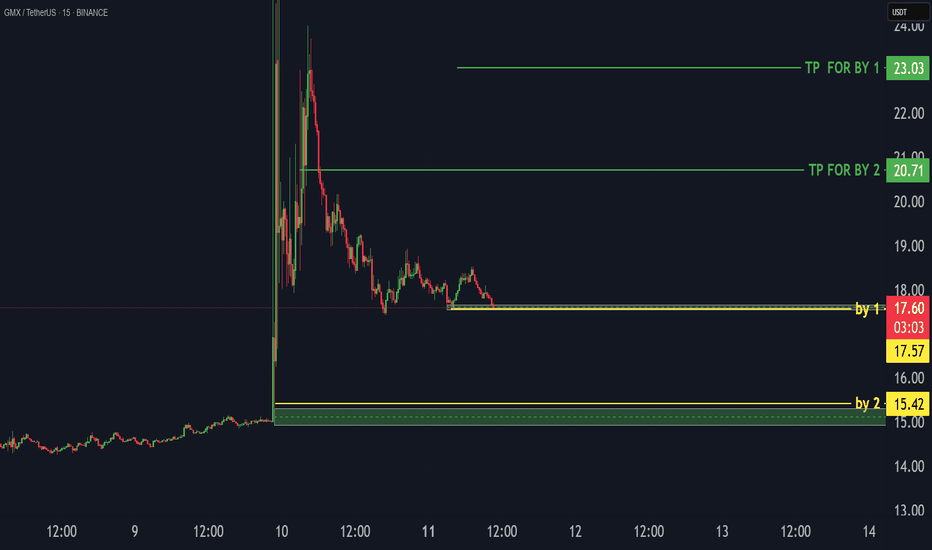
📊 Analysis of GMX/USDT - Offer and Request areas 🔹 Al -Farim: 1 hour 🔹 Strategy: Supply & Demand 1️⃣ DEMAND Zone Buy 1: At 17.53 → A short -term request area after the price falls and test it several times, which is the point from which buyers are expected to start defending the price. Buy 2: At 15.40 → It represents a deeper and stronger request area, which is the previous large emerging movement base, and often it has institutional purchase orders. 2️⃣ Display Zone (Supply Zone) TP for Buy 2: At 20.71 → A short -term display area resulting from a previous correction, which is the logical goal of the second purchase. TP for Buy 1: at 23.03 → a major and powerful display area, represents the peak of the previous launch. 3️⃣ Trading Plan 📍 The first entry: Buy from 17.53 Hard at 23.03 The expected profit rate ≈ 30% 📍 The second entry: Buy from 15.42 Hard at 20.7 The expected profit rate ≈ 35% In the case of the second purchase, you have a quantity by selling the full quantity at the second purchase goal TP for 2 4️⃣ Educational concept The demand area is the place of strong purchase orders that pay the price to climb. The display area is the place of strong sale orders that pay the price to land or correction. The combination of two different regions of entry (Buy 1 & Buy 2) gives you multiple chances and reduces the risks if the first entry does not succeed. 💡 Note: The combination of the entrances with the commitment to the management of the capital achieves an excellent balance between the rate of risk and the return. ⚠️ Elimination responsibility: This content is for educational purposes and clarifying trading ideas only, and is not considered an investment advice or a direct recommendation for purchase or sale. Trading in financial markets, especially the chipo, involves high risks that may completely lose capital. Always perform your own search and wisely manage trading risk. 💬 Share your opinion on the comments, do you see the deal logical from your perspective? 📊 For additional technical analyzes, entry signals and direct discussions: Telegram: @Elzinyterad #Highusdt #cryptotrading #smartMoneyconcepts #smc #cryptosignals #PRICEAEACTION #Orderblock #Cryptosetup #riskreward #supplydemand
mohamed_yousef_elziny
BTC يثبت قوته.. وGMX على موعد مع انطلاقة مزدوجة من مناطق الطلب

📊 Analysis of GMX/USDT - Offer and Request areas 🔹 Al -Farim: 1 hour 🔹 Strategy: Supply & Demand 1️⃣ DEMAND Zone Buy 1: At 17.53 → A short -term request area after the price falls and test it several times, which is the point from which buyers are expected to start defending the price. Buy 2: At 15.40 → It represents a deeper and stronger request area, which is the previous large emerging movement base, and often it has institutional purchase orders. 2️⃣ Display Zone (Supply Zone) TP for Buy 2: At 20.71 → A short -term display area resulting from a previous correction, which is the logical goal of the second purchase. TP for Buy 1: at 23.03 → a major and powerful display area, represents the summit of the previous launch. 3️⃣ Trading Plan 📍 The first entry: Buy from 17.53 Hard at 23.03 The expected profit rate ≈ 30% 📍 The second entry: Buy from 15.42 Hard at 20.7 The expected profit rate ≈ 35% In the case of the second purchase, you have a quantity by selling the full quantity at the second purchase goal TP for 2 4️⃣ Educational concept The demand area is the place of strong purchase orders that pay the price to climb. The display area is the place of strong sale orders that pay the price to land or correction. The combination of two different regions of entry (Buy 1 & Buy 2) gives you multiple chances and reduces the risks if the first entry does not succeed. 💡 Note: The combination of the entrances with the commitment to the management of the capital achieves an excellent balance between the rate of risk and the return. ⚠️ Elimination responsibility: This content is for educational purposes and clarifying trading ideas only, and is not considered an investment advice or a direct recommendation for purchase or sale. Trading in financial markets, especially the chipo, involves high risks that may completely lose capital. Always perform your own search and wisely manage trading risk. 💬 Share your opinion on the comments, do you see the deal logical from your perspective? 📊 For additional technical analyzes, entry signals and direct discussions: Telegram: @Elzinyterad #Highusdt #cryptotrading #smartMoneyconcepts #smc #cryptosignals #PRICEAEACTION #Orderblock #Cryptosetup #riskreward #supplydemand
Alpha-GoldFX
GMXUSDT Forming Bullish Momentum

GMXUSDT is currently showing a breakout setup from a long-standing resistance zone that looks to be flipping into support—a decisive shift that often marks the start of a new bullish trend. The price pushed through the overhead resistance on strong volume, signaling a potential change in market sentiment. Pulling back slightly toward the new support may provide a solid entry point for traders looking to capitalize on the momentum. Volume conditions are solid, suggesting that this move is supported by genuine buying interest, not just a short-term spike. A successful retest of the breakout zone could serve as confirmation and set the stage for a further rally. If momentum holds, this could result in a 90%–100%+ gain as price targets are reached toward prior highs. Wider market attention is turning toward GMX, with more investors recognizing its potential as decentralized perpetual trading gains traction. The combination of structural breakout, volume backing, and rising investor interest makes GMXUSDT an attractive mid-term setup for those targeting higher returns. This chart is worth watching closely—especially key support retests and volume behavior—to determine if this breakout has staying power and can launch a sustained trend. ✅ Show your support by hitting the like button and ✅ Leaving a comment below! (What is You opinion about this Coin) Your feedback and engagement keep me inspired to share more insightful market analysis with you!

سیگنال آلفا کریپتو
⚜️GMX/USDT 🛒 ناحیه خرید: 15.69 - 16.50 ⚡️اهداف قیمت: 🎯هدف 1: 16.83 🎯هدف 2: 17.48 🎯هدف 3: 18.79 🎯هدف 4: 20.43 🎯هدف 5: 22.88 🎯هدف 6: 27.78 🔺️ حد ضرر: 13.07 💵 سرمایه پیشنهادی: 5 درصد از کل سرمایه 🔥 @Signal_Alpha 🔥

Bithereum_io
GMXUSDT 1D

#GMX has broken the descending channel to the upside on the daily chart. It is currently trading above the daily MA50. Expect some upward movement from here. Targets are:🎯 $18.35🎯 $21.33🎯 $23.29🎯 $27.28🎯 $31.27⚠️ Use a tight stop-loss.

Filnft
Gmx short to 12.1

Just now opened a short position on GMX. Am expecting a clean fall soon down to $12.1 potential demand zone.2.5-3.67RR75% Tp at $12.54close at $12.1Stop: $13.78DTT strategy applied
Filnft
Gmx short to

Entered gmx short a while ago. I anticipate further selloff down to 13.6 area.Roughly 3RRMarket reacting to supply zone- more supply coming in.DTT applied.Stop and target on chartTime sensitiveScaled into gmx shortScaled into gmx short againClosed my short. Might enter back later onJust shorted gmx again14.31 adjusted stop for Gmx
Disclaimer
Any content and materials included in Sahmeto's website and official communication channels are a compilation of personal opinions and analyses and are not binding. They do not constitute any recommendation for buying, selling, entering or exiting the stock market and cryptocurrency market. Also, all news and analyses included in the website and channels are merely republished information from official and unofficial domestic and foreign sources, and it is obvious that users of the said content are responsible for following up and ensuring the authenticity and accuracy of the materials. Therefore, while disclaiming responsibility, it is declared that the responsibility for any decision-making, action, and potential profit and loss in the capital market and cryptocurrency market lies with the trader.