
GMT
STEPN
| تریدر | نوع سیگنال | حد سود/ضرر | زمان انتشار | مشاهده پیام |
|---|---|---|---|---|
No results found. | ||||
Price Chart of STEPN
سود 3 Months :
سیگنالهای STEPN
Filter
Sort messages by
Trader Type
Time Frame

OpenYourMind1318
پیشبینی شوکهکننده از آینده GMT/STEPN: آیا اصلاح بزرگ در راه است؟ (تحلیل تکنیکال هفتگی)

Not sure about others, but personally I really like CCI indicator. Looking at its historical performance especially on the weekly timeframe it has proven to be extremely precise in signaling key market reversals and momentum shifts. Currently, we can see a triangle pattern forming on the chart. If this triangle plays out as expected - targets are marked on the chart and I’d dare to assume those could represent the final highs before a major correction or potential “scam phase”

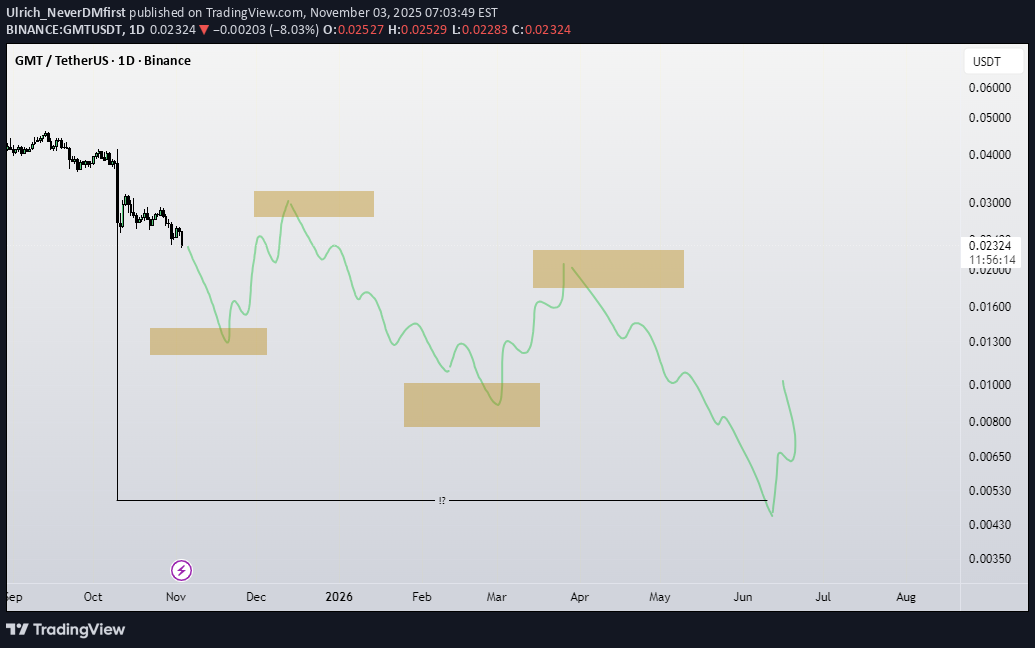
Ulrich_NeverDMfirst
آینده ارزهای دیجیتال آلت کوین و GMT در یک سال آینده: تحلیل اختصاصی و مهم!

Bithereum_io
تحلیل تکنیکال GMT: آیا کف مثلث نزولی میشکند؟ اهداف صعودی بزرگ تا ۰.۱ دلار!

#GMT is moving inside a falling wedge pattern on the 3-day timeframe chart and is currently testing the wedge support line. In case of a successful bounce and a breakout above the wedge resistance, the potential targets are: 🎯 $0.03760 🎯 $0.04337 🎯 $0.05436 🎯 $0.06325 🎯 $0.07214 🎯 $0.08479 🎯 $0.10090 ⚠️ Always remember to use a tight stop-loss and maintain proper risk management.

CryptoNuclear
GMT/USDT — Descending Triangle: Breakout or Breakdown?
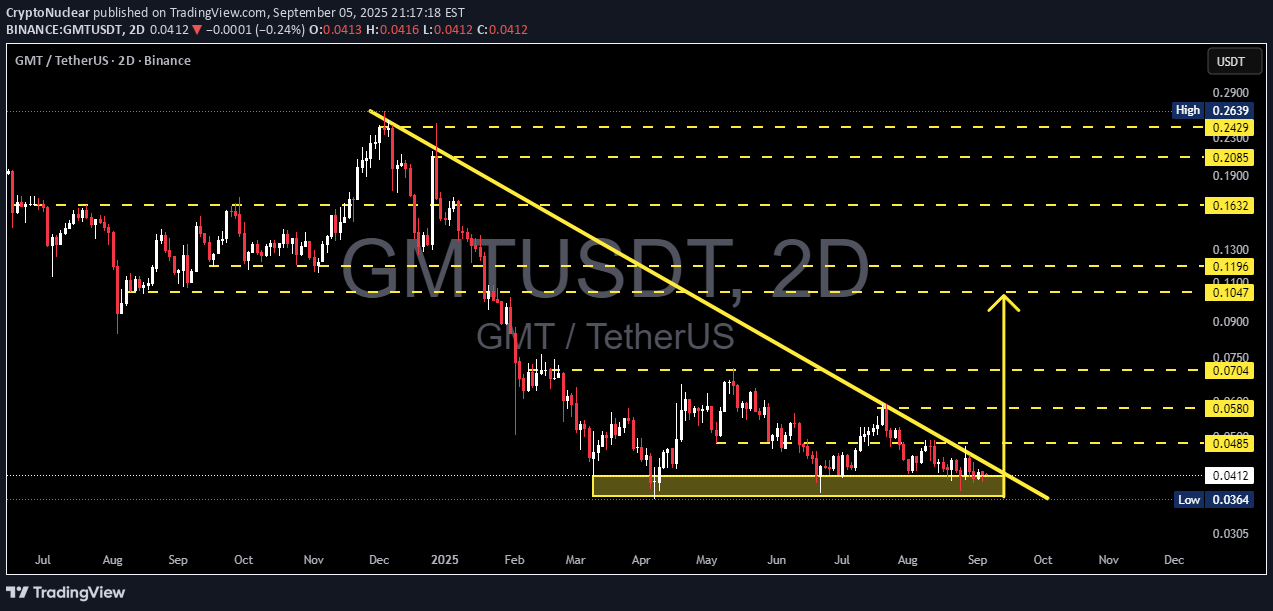
📝 Market Overview: Since the early 2025 peak, GMT has been in a clear downtrend, consistently forming lower highs along the descending trendline (yellow). Price is now consolidating within a major support zone at 0.0364 – 0.0413, which has been tested multiple times. The structure forms a Descending Triangle: flat support + lower highs. Statistically, this pattern carries a bearish continuation bias, but a reversal scenario is not ruled out if bulls manage to reclaim key levels. --- 🔎 Pattern Significance A Descending Triangle occurs when sellers keep pressing with lower highs, while buyers are forced to defend the same horizontal level. ➡️ Default bias: bearish (higher probability of breakdown, ~60–65%). ➡️ However, a strong breakout above the trendline often triggers a short squeeze, flipping sentiment and leading to a bullish reversal. --- 📊 Bearish Scenario (Dominant Bias) Trigger: 2D candle close below 0.0364 with strong volume. Target: Measured move (0.0485 – 0.0364 = 0.0121). Breakdown projection → 0.0243. Extra confirmation: Failed retest of broken support turning into resistance. Risk: A weak-volume breakdown could lead to a fake-out and quick rebound. --- 📈 Bullish Scenario (Needs Strong Confirmation) Trigger: 2D close above descending trendline and above first resistance 0.0485. Initial targets: 0.0580 → 0.0704. Extended target: 0.1047 if momentum builds. Best confirmation: Successful retest of 0.0485 as new support with increased buying volume. --- ⚖️ Conclusion The 0.036–0.041 zone is a “make-or-break” level for GMT. As long as this support holds, bulls still have a fighting chance. But the descending triangle pattern leans bearish → breakdown towards 0.024 remains a strong risk. Traders should wait for a 2D candle confirmation with volume before committing to either direction. --- 📌 Trading Checklist 1. Focus on 2D candle closes (not intraday wicks). 2. Watch for volume confirmation on breakouts/breakdowns. 3. Prefer setups with retest + rejection for higher reliability. 4. Place stop-loss around invalidation levels (above resistance or below support). 5. Maintain strict risk management (R:R at least 1:2). --- 🔑 Key Technical Levels Main Support: 0.0364 – 0.0413 Resistances: 0.0485 → 0.0580 → 0.0704 → 0.1047 Bearish target (breakdown): ~0.0243 Bullish targets (if breakout): 0.0580 → 0.0704 --- #GMT #GMTUSDT #Crypto #Altcoins #TechnicalAnalysis #DescendingTriangle #Breakout #Breakdown #SupportResistance #ChartPattern

Alpha-GoldFX
GMTUSDT Forming Bullish Wave
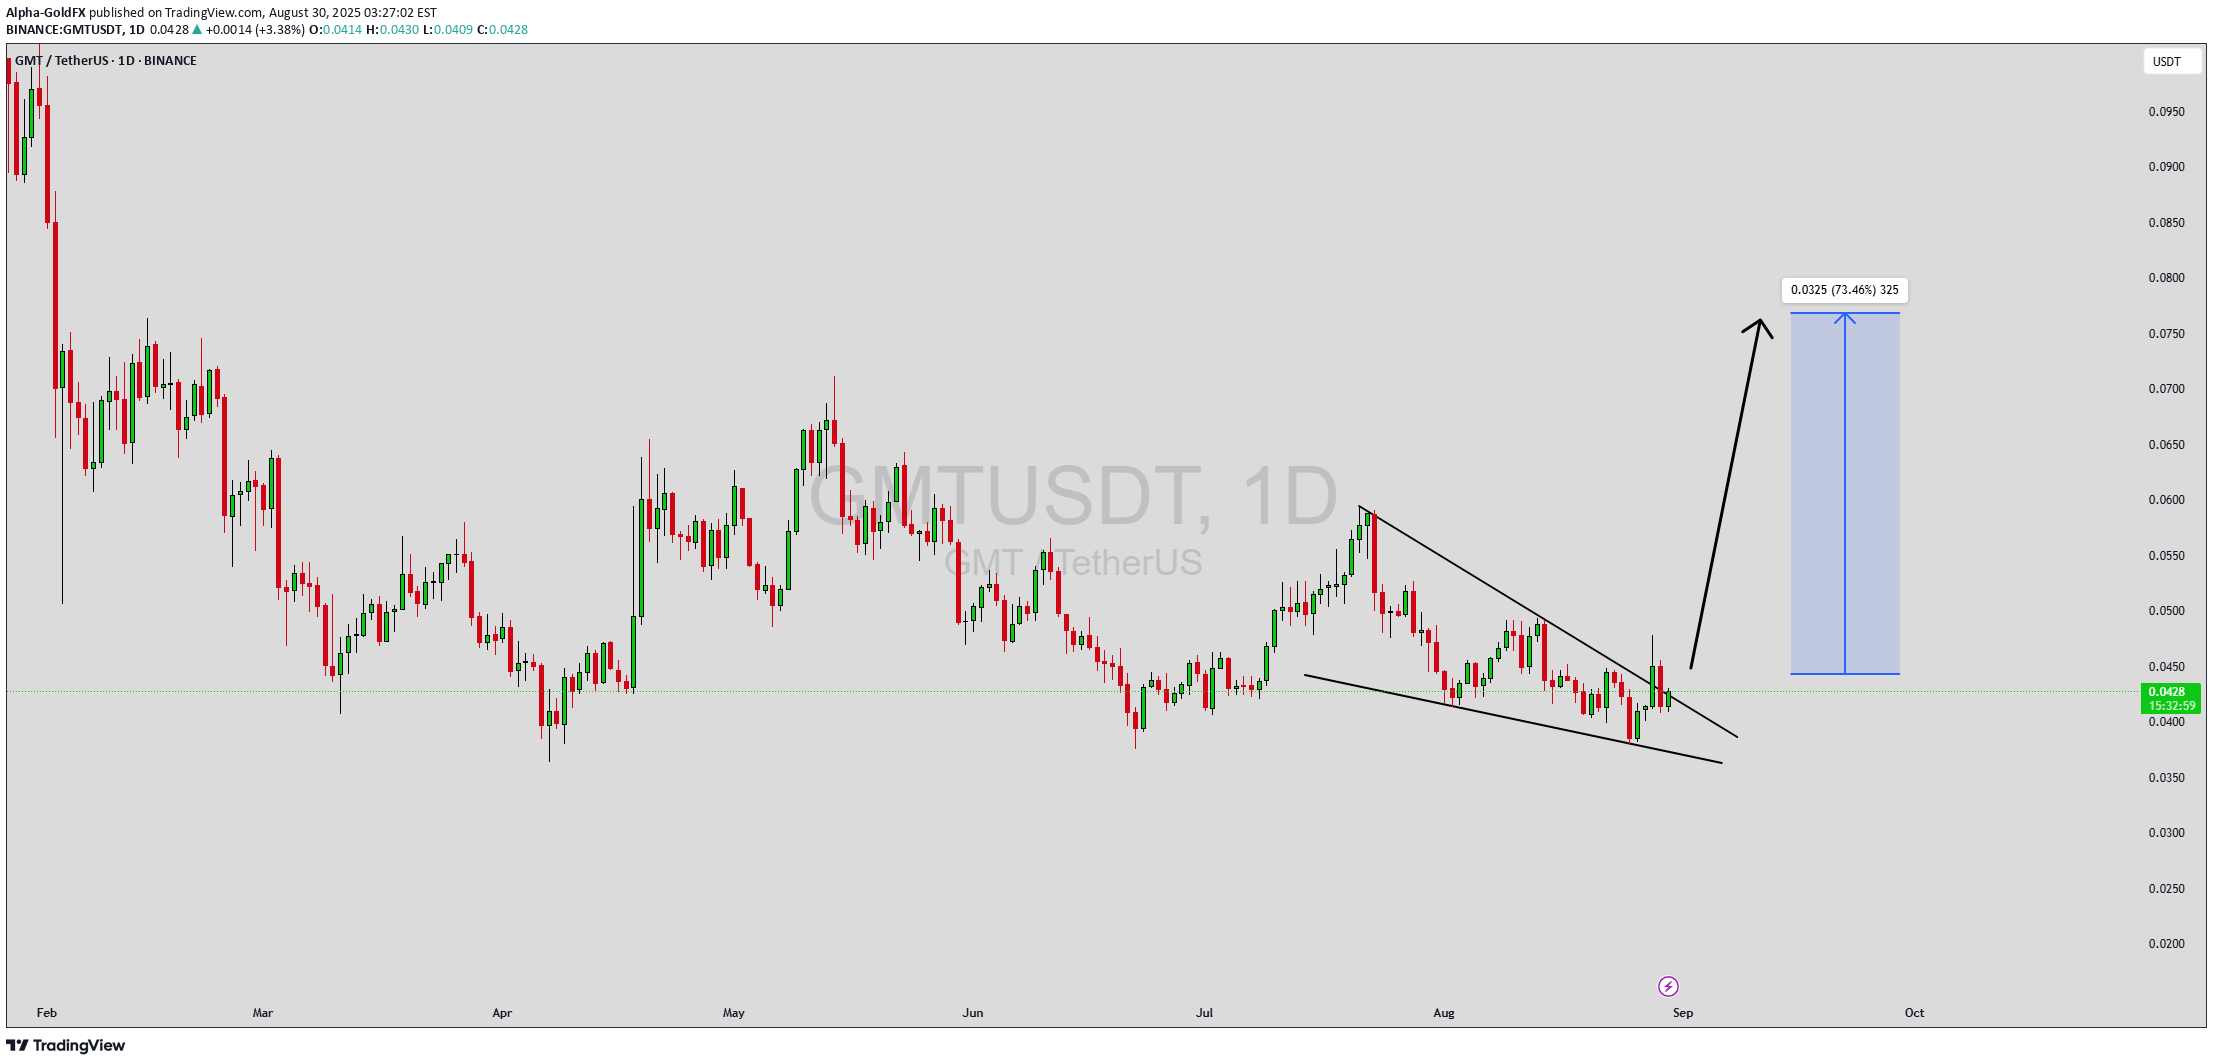
GMTUSDT is showing signs of strength as the price structure forms a bullish breakout setup. The chart indicates that after a prolonged period of consolidation, the pair is attempting to push higher, supported by good trading volume. This increase in buying activity highlights that market participants are positioning themselves ahead of a potential trend reversal. If momentum sustains, GMTUSDT could enter a new bullish wave in the coming sessions. With an expected gain of 60% to 70%+, this setup is drawing significant attention from traders and investors who are closely watching key breakout levels. The technical structure suggests that once price clears overhead resistance, strong upside potential could unfold rapidly. Such moves are often accompanied by increased liquidity and heightened trading interest, which further validates the bullish outlook. Investor confidence in this project is gradually building, which can act as a catalyst for price expansion. The favorable combination of volume confirmation, technical breakout formation, and renewed interest from the community sets the stage for potential strong gains. Traders should remain attentive to continuation signals as the breakout unfolds. ✅ Show your support by hitting the like button and ✅ Leaving a comment below! (What is You opinion about this Coin) Your feedback and engagement keep me inspired to share more insightful market analysis with you!
CryptoNuclear
GMT/USDT Breakout Alert! Major Downtrend Broken

🔻 End of a Long-Term Downtrend?GMT has been in a strong downtrend since late 2024. A clearly defined descending trendline has acted as strong resistance—until now. The price has bounced from the major support zone between $0.0364 and $0.0425, which has held multiple times since March 2025.🚀 Breakout Confirmation in Progress:The chart shows a potential breakout from the descending trendline (yellow). A confirmed breakout with volume would indicate the start of a bullish reversal pattern.🎯 Key Resistance / Profit Targets:$0.0474 – Initial minor resistance$0.0555 – First bullish confirmation$0.0665 to $0.0744 – Medium-term target$0.0977 to $0.1302 – Strong upside potential$0.2108 to $0.2471 – Full bullish target zone if momentum continues📌 Additional Notes:The highlighted yellow area is a demand zone signaling potential accumulation.This setup aligns with classic breakout-reversal formations.Excellent risk/reward due to proximity to strong support.#GMTUSDT #GMT #CryptoBreakout #AltcoinSeason #CryptoReversal#TechnicalAnalysis #BreakoutCrypto #TradingSignals #CryptoTA#BinanceTrading

lehyani
forsah GMT

First-class forsah based on the conditions of the forsah Indicator by Technical Analyst Abu Hammam 🚀📈🔥
CryptoNuclear


CryptoANalysis_CAN
#GMT/USDT SHORT SIGNAL

Another sample signal. Apply proper risk management before entry.Exchanges: ByBit USDT, Binance FuturesSignal Type: Regular (Short)Leverage: Isolated (5.0X)Amount: 5.0%Entry Targets:1) 0.066452) 0.07377Take-Profit Targets:1) 0.058402) 0.050903) 0.04084Stop Targets:1) 0.07873Trailing Configuration:Stop: Breakeven - Trigger: Target (1)Unfortunately price missed our entry by a few cents and went to target points. 🫡Let's remove our short entries and wait for a new chance. ▶️

InnerCircleAnalysis
GMT Daily Analysis | Bearish Continuation Toward Key Support

👀 Welcome to my Trading View Analysis and Trading Channel Here , we share the latest market analysis, trading signals, and key insights together .Ready for smarter trades ? ⭐️🧠 Technical Analysis of GMT Coin – Daily TimeframeThis analysis reviews the recent price behavior of GMT coin on the daily chart. Based on the current market structure, there are multiple technical signals suggesting the continuation of the downtrend and a possible entry into a consolidation phase.1. 🚀 Sharp Uptrend Followed by a Correction PhaseInitially, GMT experienced a sharp bullish rally, accompanied by a noticeable surge in trading volume, pushing the price to higher levels. However, after the rally peaked, the price entered a corrective phase that still appears to be ongoing.2. ❌ Breakdown of the Key $0.058 Support LevelOne of the most critical developments during the correction was the breakdown of the $0.058 support zone. This level had previously acted as a strong support area. Its failure signals growing selling pressure and increases the likelihood of the downtrend continuing.3. 📉 Bearish Reaction to the 3 SMA IndicatorDuring its downward movement, the price encountered the 3 SMA indicator (a combination of three Simple Moving Averages). The key observations are:All recent candlesticks have closed below the SMA linesThis is considered a strong bearish confirmation in technical analysisIt also highlights the dominance of sellers at this stage of the market4. 🛡 Major Support Area at $0.043Given the ongoing bearish pressure, the $0.043 support level has become a critical area to watch. Historically, this level has successfully prevented further declines and may act as a strong support once again.If the price reaches this zone, it may:Show a supportive reaction (respect the level)Enter a short-term consolidation rangeOr potentially initiate a new bullish wave, depending on candlestick formations and trading volume around that level✅ Final Summary:The overall trend remains bearish for nowThe break of $0.058 and candlestick closures below the 3 SMA confirm ongoing selling pressureThe $0.043 level is a critical support zone that could trigger a potential reversal or consolidation🗞 Recent GMT Weekly HighlightsHere are the key developments from the past week in the GMT ecosystem:1️⃣ 🔥 Buyback & Burn of 600M GMT TokensGMT DAO announced a massive buyback of 600 million tokens worth around $100M. After a community vote, these tokens may be burned — a move expected to reduce supply and potentially support price growth.2️⃣ 👟 Adidas Partnership & NFT SneakersThe STEPN project partnered with Adidas to launch 1,200 limited edition physical sneakers tied to NFTs. This collaboration aims to boost brand visibility and attract new users.3️⃣ 🎁 Massive Community AirdropAn additional 600 million GMT tokens will be distributed via airdrop to increase community engagement and encourage participation in DAO governance.I love you all so much . 👀don't forget about capital management and risk management .Be careful with your positions . 🥇
Disclaimer
Any content and materials included in Sahmeto's website and official communication channels are a compilation of personal opinions and analyses and are not binding. They do not constitute any recommendation for buying, selling, entering or exiting the stock market and cryptocurrency market. Also, all news and analyses included in the website and channels are merely republished information from official and unofficial domestic and foreign sources, and it is obvious that users of the said content are responsible for following up and ensuring the authenticity and accuracy of the materials. Therefore, while disclaiming responsibility, it is declared that the responsibility for any decision-making, action, and potential profit and loss in the capital market and cryptocurrency market lies with the trader.