
FXS
Frax Share
Price Chart of Frax Share and Frax Share Signal Trend
Traders' comments on price Frax Share
Who made the most profit from Frax Share?
Signals of Frax Share
Filter
Signal Type
Trader Type
Time Frame

CryptoNuclear

FXS ~ 1W Analysis #FXS Buy after successfully breaking through this resistance line if you still have confidence in this coin with a short-term target of at least 20%++


Ren_MomentumTrader

Key Level Zone: 2.8080 - 2.8350HMT v8.1 detected. The setup looks promising, supported by a previous upward/downward trend with increasing volume and momentum, presenting an excellent reward-to-risk opportunity.HMT (High Momentum Trending):HMT is based on trend, momentum, volume, and market structure across multiple timeframes. It highlights setups with strong potential for upward movement and higher rewards.Whenever I spot a signal for my own trading, I’ll share it. Please note that conducting a comprehensive analysis on a single timeframe chart can be quite challenging and sometimes confusing. I appreciate your understanding of the effort involved.Important Note :Role of Key Levels:- These zones are critical for analyzing price trends. If the key level zone holds, the price may continue trending in the expected direction. However, momentum may increase or decrease based on subsequent patterns.- Breakouts: If the key level zone breaks, it signals a stop-out. For reversal traders, this presents an opportunity to consider switching direction, as the price often retests these zones, which may act as strong support-turned-resistance (or vice versa).My Trading RulesRisk Management- Maximum risk per trade: 2.5%.- Leverage: 5x.Exit StrategyProfit-Taking:- Sell at least 70% on the 3rd wave up (LTF Wave 5).- Typically, sell 50% during a high-volume spike.- Adjust stop-loss to breakeven once the trade achieves a 1.5:1 reward-to-risk ratio.- If the market shows signs of losing momentum or divergence, ill will exit at breakeven.The market is highly dynamic and constantly changing. HMT signals and target profit (TP) levels are based on the current price and movement, but market conditions can shift instantly, so it is crucial to remain adaptable and follow the market's movement.If you find this signal/analysis meaningful, kindly like and share it.Thank you for your support~Sharing this with love!HMT v2.0:- Major update to the Momentum indicator- Reduced false signals from inaccurate momentum detection- New screener with improved accuracy and fewer signalsHMT v3.0:- Added liquidity factor to enhance trend continuation- Improved potential for momentum-based plays- Increased winning probability by reducing entries during peaksHMT v3.1:- Enhanced entry confirmation for improved reward-to-risk ratiosHMT v4.0:- Incorporated buying and selling pressure in lower timeframes to enhance the probability of trending moves while optimizing entry timing and scalingHMT v4.1:- Enhanced take-profit (TP) target by incorporating market structure analysisHMT v5 :Date: 23/01/2025- Refined wave analysis for trending conditions- Incorporated lower timeframe (LTF) momentum to strengthen trend reliability- Re-aligned and re-balanced entry conditions for improved accuracyHMT v6 :Date : 15/02/2025- Integrated strong accumulation activity into in-depth wave analysisHMT v7 :Date : 20/03/2025- Refined wave analysis along with accumulation and market sentimentHMT v8 :Date : 16/04/2025- Fully restructured strategy logicHMT v8.1 :Date : 18/04/2025- Refined Take Profit (TP) logic to be more conservative for improved win consistency

stanleycrypto_1

FXS Setup Heating Up 🔥FXSUSD is holding strong above the breakout zone near $3 after a clean retest.As long as it stays above this support, the setup looks bullish with a potential 100% move toward $6.20. Momentum is building, one to keep an eye on!DYRO, NFA

CryptoAnalystSignal

#FXSThe price is moving within a descending channel on the 1-hour frame, adhering well to it, and is heading for a strong breakout and retest.We are experiencing a rebound from the lower boundary of the descending channel, which is support at 3.70.We are experiencing a downtrend on the RSI indicator, which is about to break and retest, supporting the upward trend.We are looking for stability above the 100 Moving Average.Entry price: 3.75First target: 3.96Second target: 4.13Third target: 4.37

Bithereum_io

#FXS is on the verge of breaking out above the neckline of the rounding bottom pattern and the descending resistance on the daily timeframe. In case of a breakout, the targets are:🎯 $4.098🎯 $4.934🎯 $6.073🎯 $7.212⚠️ Use a tight stop-loss.

MasterAnanda

The low here happened 11-March rather than 7-April, 7-April was a higher low. The action is strongly bullish and the rising channel has been broken, the upper boundary. From this we can deduct that the next higher high will be a really strong one.Frax Share is on the way up.The $11.33 target with 270% potential on the chart gives 809% potential when taken from the 11-March low. This is the projected size of this first 2025 bull market advance. Of course it can happen that the peak reaches $7.47. The first peak can be $7.47 or $11.33 doesn't matter. After the higher high is in, we are likely to experience a retrace or correction followed by additional growth. This "additional growth" will result in something really huge. It will be awesome.Prepare now, many Altcoins are still trading at bottom prices.Plan before buying. When will you sell if prices start to rise after you bought?How much will you sell?If you don't sell everything, what will you do with the remaining tokens?If you sell everything, what will you do with the free capital? Use a portion to enter a new trade while securing some profits? Go all in a new trade or split between multiple pairs?Plan for all scenarios.Create your own scenarios. This way you can win big.Namaste.

pullbacksignal
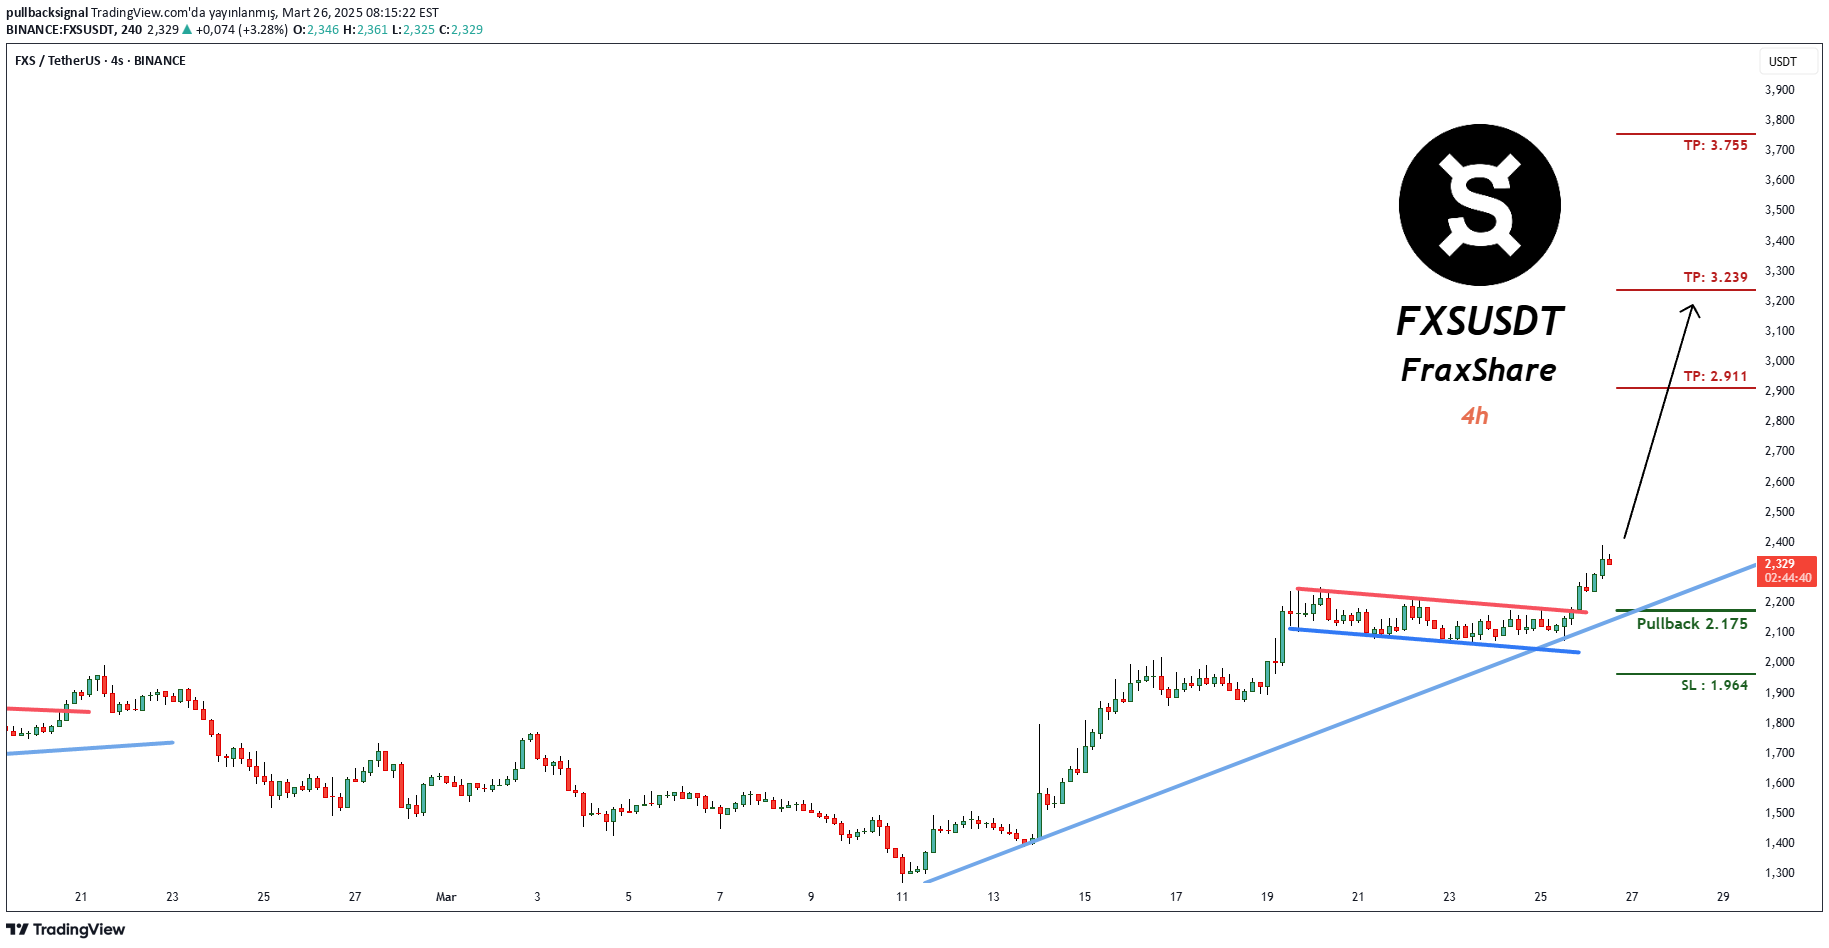
Ticaret Kurulumu:FXSUSDT FraxShare'de (4s) bir Ticaret Sinyali görülüyorTicaretçiler ŞİMDİ Satın Alma İşlemlerini açabilirler⬆️Şimdi satın al veya 2,175'te satın al⭕️SL @ 1,964🔵TP1 @ 2,911🔵TP2 @ 3,239🔵TP3 @ 3,755Bu sinyaller neye dayanmaktadır?Klasik Teknik AnalizFiyat Hareketi Mum Çubukları FibonacciRSI, Hareketli Ortalama, Ichimoku, Bollinger BantlarıRisk UyarısıForex, CFD'ler, Kripto, Vadeli İşlemler ve Hisse Senetleri ticareti kayıp riski içerir. Lütfen bu tür ticaretin sizin için uygun olup olmadığını dikkatlice düşünün. Geçmiş performans gelecekteki sonuçların göstergesi değildir.Fikirlerimizi beğendiyseniz lütfen beğenilerinizle👍 ve yorumlarınızla bizi destekleyin.
pullbacksignal
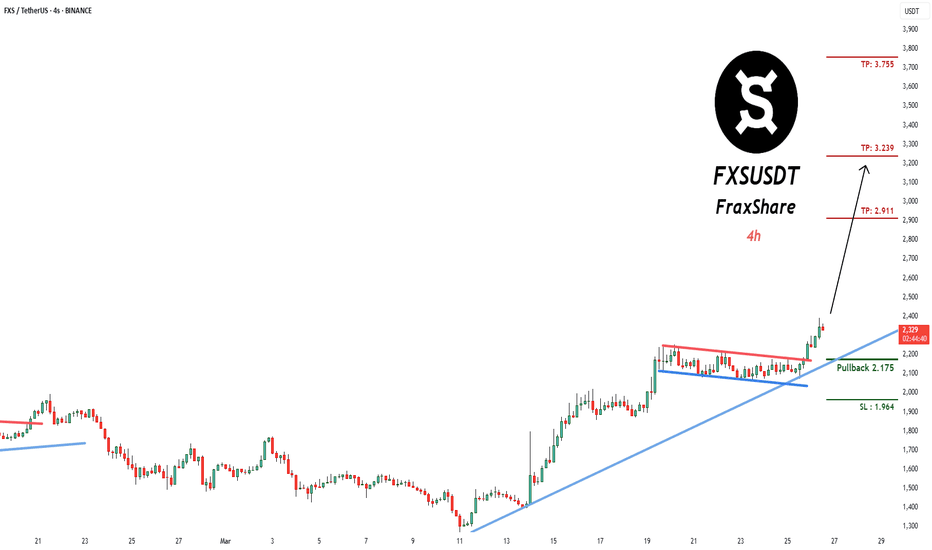
Ticaret Kurulumu:FXSUSDT FraxShare'de (4s) bir Ticaret Sinyali görülüyorTicaretçiler ŞİMDİ Satın Alma İşlemlerini açabilirler⬆️Şimdi satın al veya 2,175'te satın al⭕️SL @ 1,964🔵TP1 @ 2,911🔵TP2 @ 3,239🔵TP3 @ 3,755Bu sinyaller neye dayanmaktadır?Klasik Teknik AnalizFiyat Hareketi Mum Çubukları FibonacciRSI, Hareketli Ortalama, Ichimoku, Bollinger BantlarıRisk UyarısıForex, CFD'ler, Kripto, Vadeli İşlemler ve Hisse Senetleri ticareti kayıp riski içerir. Lütfen bu tür ticaretin sizin için uygun olup olmadığını dikkatlice düşünün. Geçmiş performans gelecekteki sonuçların göstergesi değildir.Fikirlerimizi beğendiyseniz lütfen beğenilerinizle👍 ve yorumlarınızla bizi destekleyin.
pullbacksignal

Trading Setup:A Trading Signal is seen in the FXSUSDT FraxShare (4h)Traders can open their Buy Trades NOW⬆️Buy now or Buy on 2.175⭕️SL @ 1.964🔵TP1 @ 2.911🔵TP2 @ 3.239🔵TP3 @ 3.755What are these signals based on?Classical Technical AnalysisPrice Action Candlesticks FibonacciRSI, Moving Average , Ichimoku , Bollinger BandsRisk WarningTrading Forex, CFDs, Crypto, Futures, and Stocks involve a risk of loss. Please consider carefully if such trading is appropriate for you. Past performance is not indicative of future results.If you liked our ideas, please support us with your likes 👍 and comments.

rasooldavarpanah57

Considering it has reached a strong support level and swept previous lows, it offers a good R/R ratio.From a technical perspective, it's in a favorable position.On the 4H timeframe, a pullback is expected, providing a better entry opportunity at a discount.
Disclaimer
Any content and materials included in Sahmeto's website and official communication channels are a compilation of personal opinions and analyses and are not binding. They do not constitute any recommendation for buying, selling, entering or exiting the stock market and cryptocurrency market. Also, all news and analyses included in the website and channels are merely republished information from official and unofficial domestic and foreign sources, and it is obvious that users of the said content are responsible for following up and ensuring the authenticity and accuracy of the materials. Therefore, while disclaiming responsibility, it is declared that the responsibility for any decision-making, action, and potential profit and loss in the capital market and cryptocurrency market lies with the trader.