
FIDA
Bonfida
| تریدر | نوع سیگنال | حد سود/ضرر | زمان انتشار | مشاهده پیام |
|---|---|---|---|---|
No results found. | ||||
Price Chart of Bonfida
سود 3 Months :
سیگنالهای Bonfida
Filter
Sort messages by
Trader Type
Time Frame

Bithereum_io
تحلیل فیدا (FIDA): زمان خرید پس از شکست مثلث نزولی و اهداف قیمتی هیجانانگیز
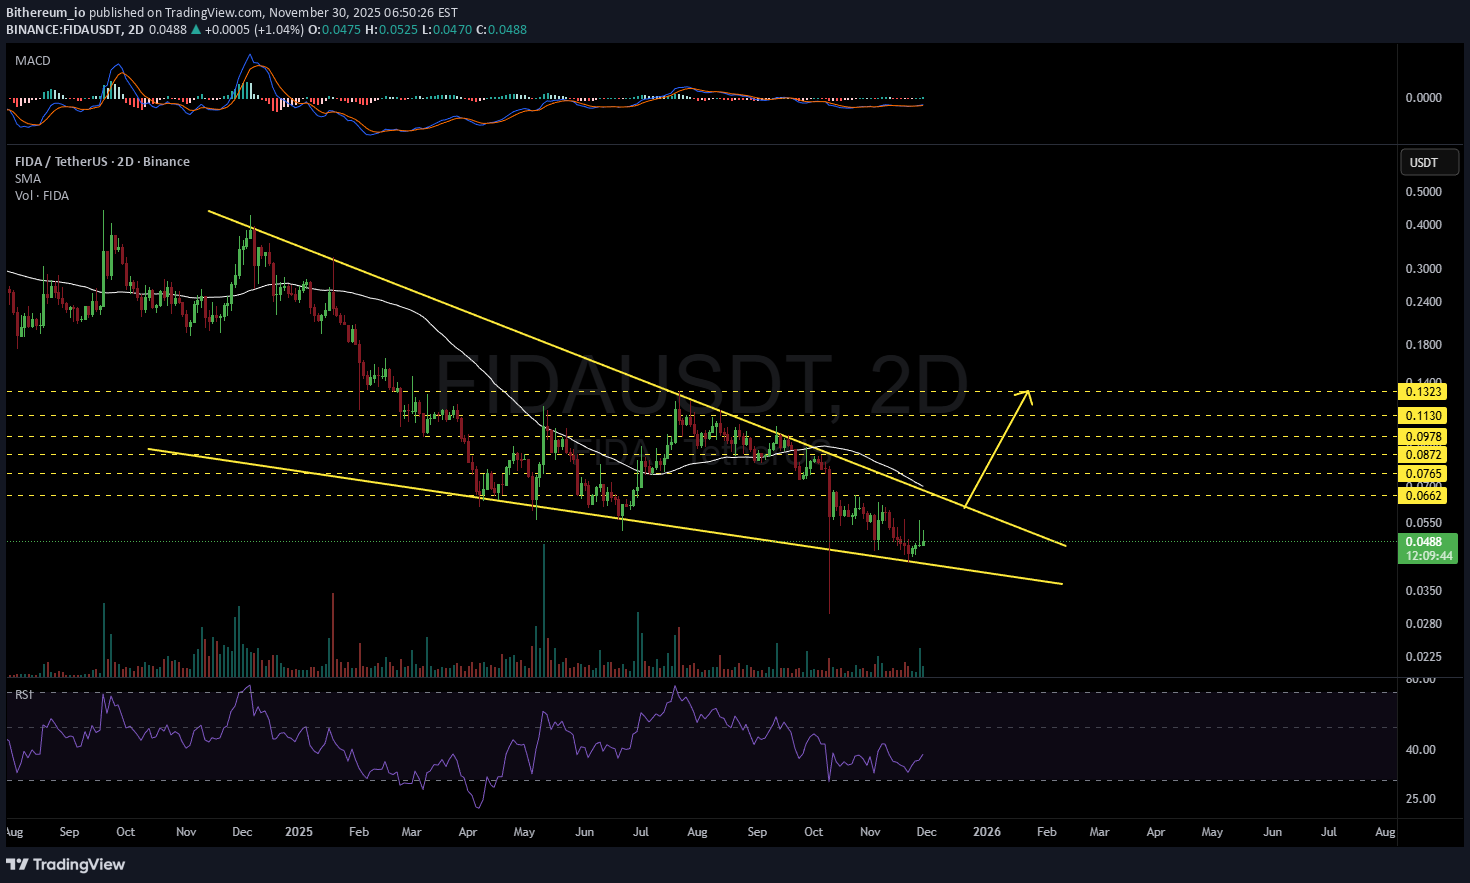
#FIDA is moving inside a falling wedge pattern on the 2-day timeframe. Consider buying only after a solid breakout above the wedge and the SMA50. If that breakout confirms, the potential upside targets are: 🎯 $0.0662 🎯 $0.0765 🎯 $0.0872 🎯 $0.0978 🎯 $0.1130 🎯 $0.1323 ⚠️ Always remember to use a tight stop-loss and maintain proper risk management.

FortuneAI
تأیید شکست صعودی فیدا: سیگنال خرید در منطقه تقاضای قوی!

FIDA Technicals look Bullish and it's sitting in strong liquidity demand zone. Use proper risk management. The total crypto market cap rose amid extreme fear sentiment (index 18), a contrarian signal that often precedes rebounds. FIDA’s shows technical oversold conditions with speculative volume

suleymankumyol
تحلیل تکنیکال FIDA/USDT: چرا این ارز دیجیتال هنوز "خودش را پیدا نکرده" است؟
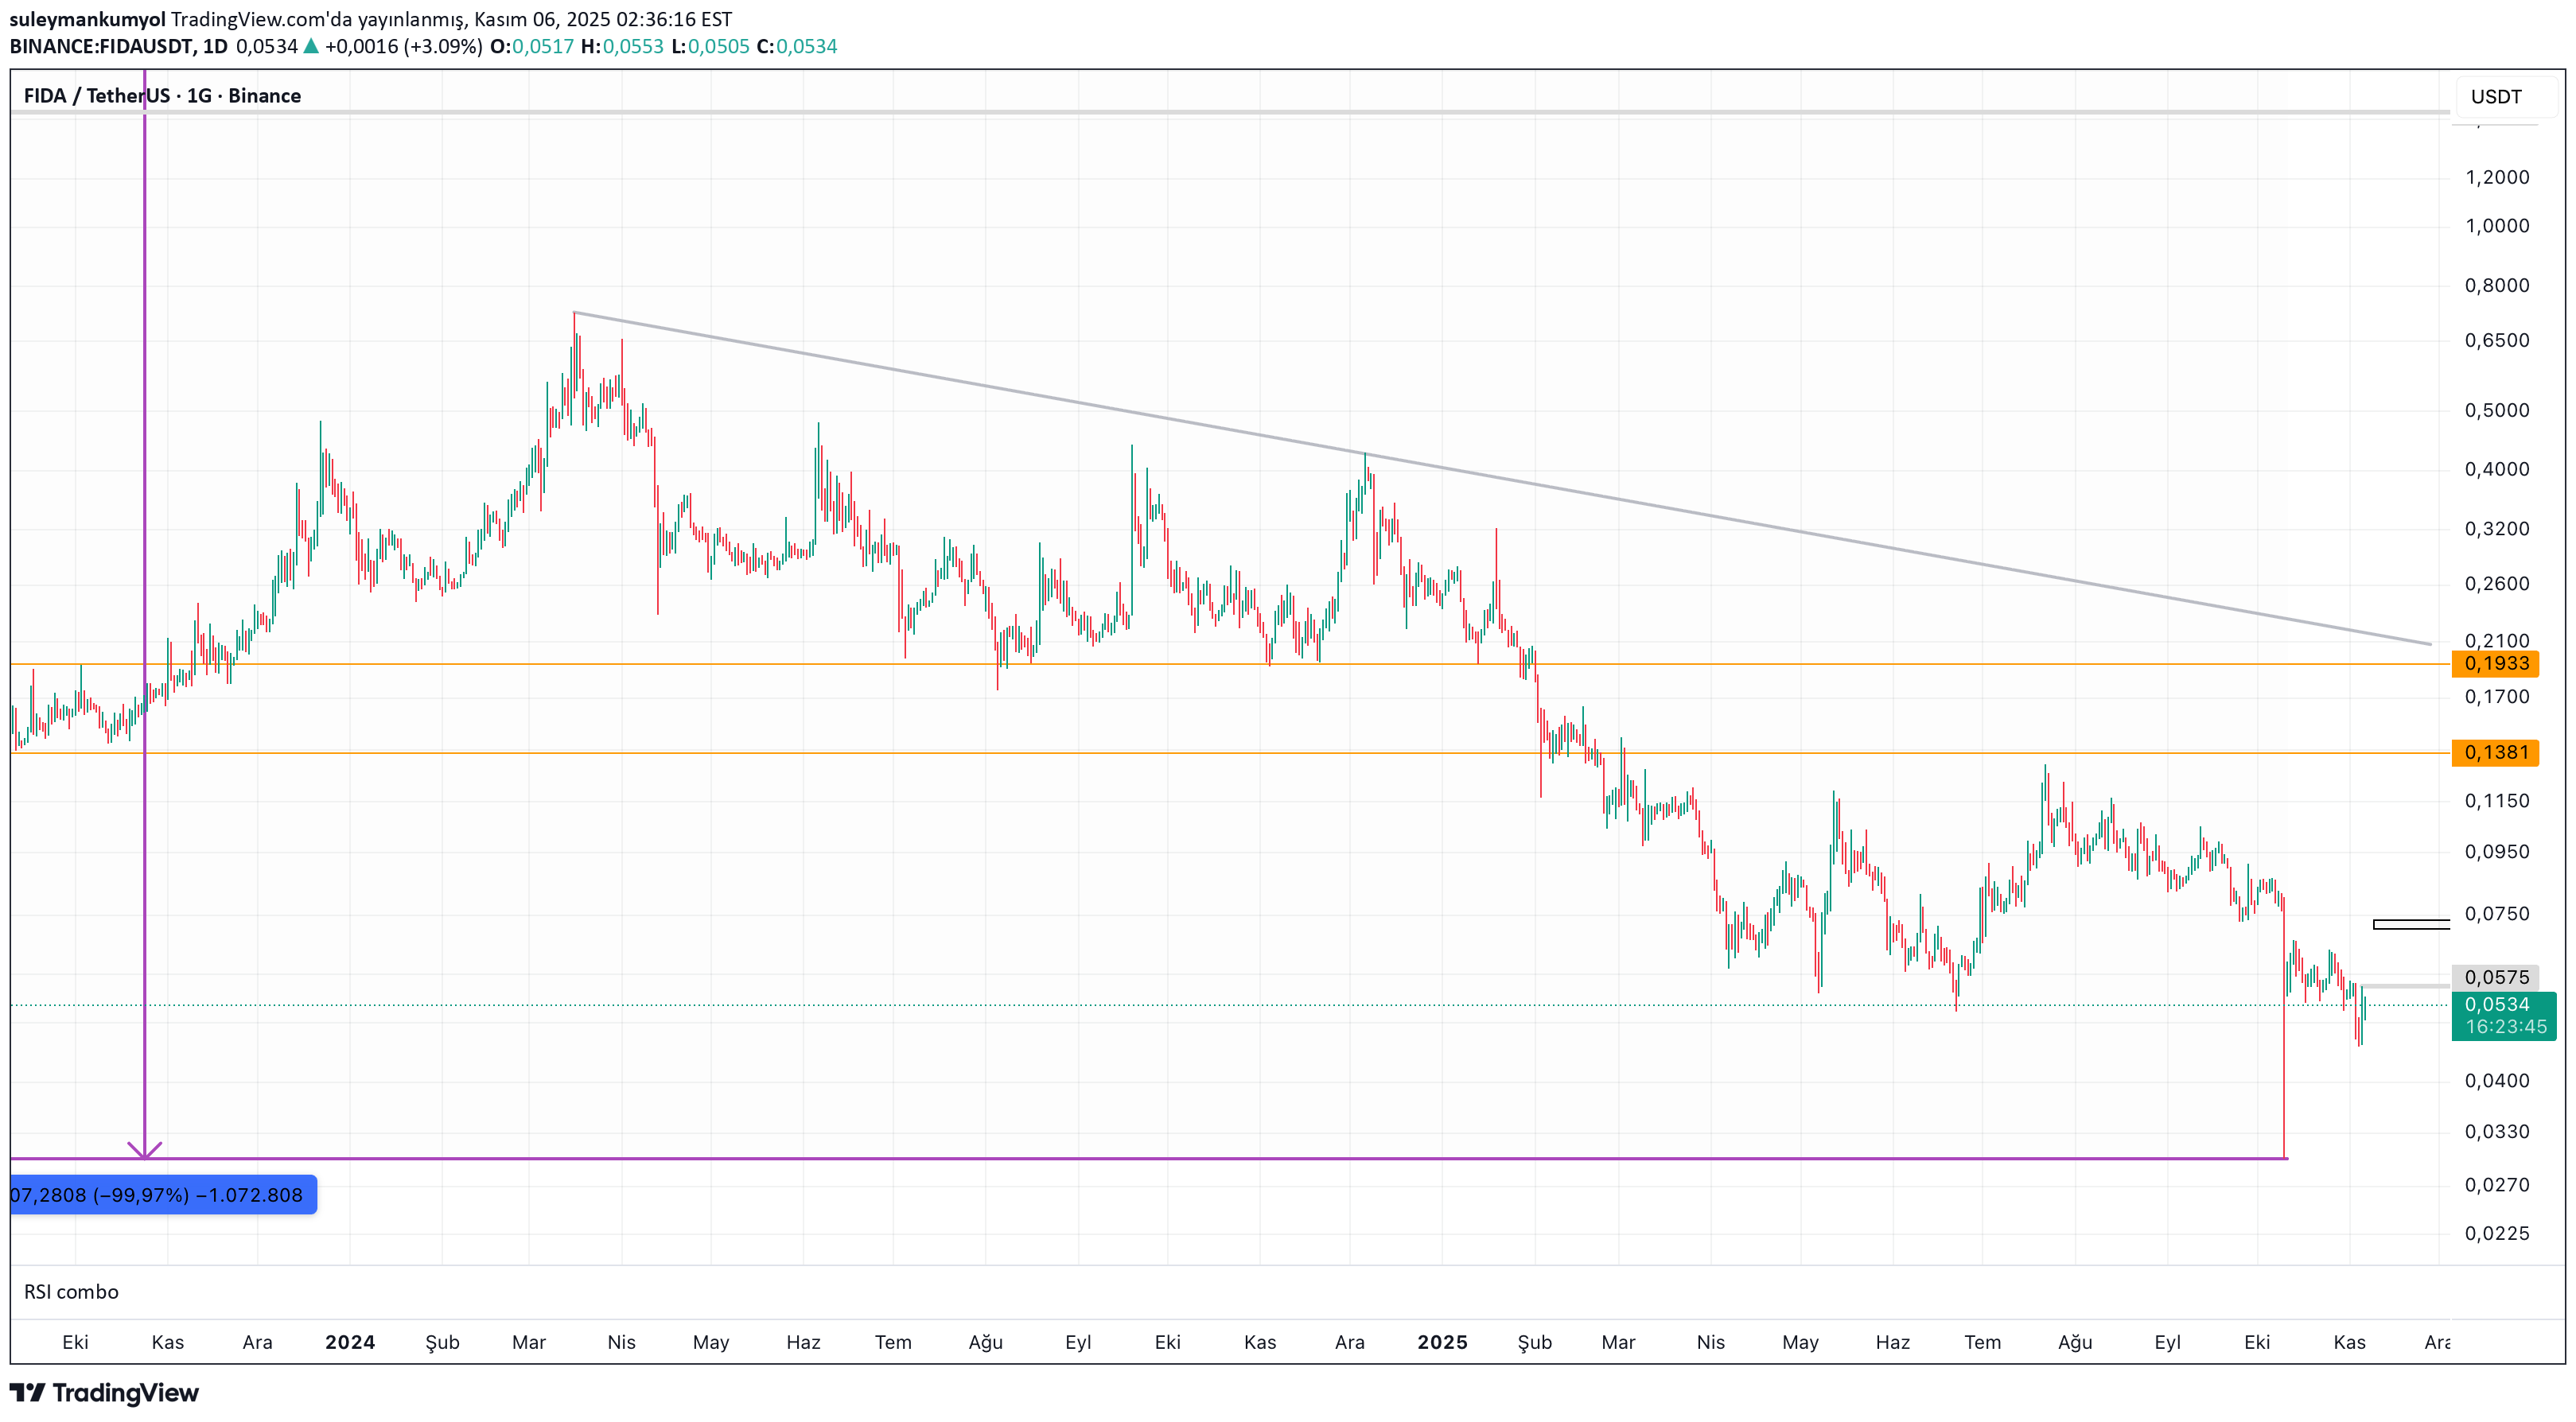
FIDAUSDT Chart Commentary I did not like this coin. I am aware that it is a harsh entry, but when the chart is examined carefully, there is a difference of exactly 99.97% between the ath level in 2021 and the pricing of the destruction day that the market experienced on October 10. In other words, it is a coin that was offered in the long 21 bull and could not find itself after that. In addition, although it is in the SOLANA ecosystem (koaly naming function in the Sol ecosystem), it has not experienced price fluctuations in parallel with Solana. I saw this as an organic disconnection. It is necessary to comprehensively examine what the community or developers say. Let's see what the graph says: Sequential day closes above $0.0575 could initiate an uptrend. However, there is resistance in the $0.072-0.075 band. If this is exceeded, we may see a sharp upward movement above our expectations. This movement will probably remain as a needle throw. If the trend line at $0.2 is broken, extremely positive pricing may occur for FIDAUSDT. If we look at the negative side, we can say the following. It is a coin that has remained horizontal for a long time and has not been able to form a bottom. This is a situation that will alienate investors. A few years ago, FILUSDT was able, at least partially, to come back after a huge devastation. I don't know if FIDAUSDT's story is similar to this. In my opinion, it is not possible for this coin to make the desired and longed-for movements before the market moves upwards. I showed sequential targets in the chart. It is not investment advice. Leveraged transactions should be avoided. I wish everyone good luck.

crypto_profile
آیندهی قیمت FIDA: دو سناریوی مهم و زمان خرید طلایی!

Hello friends, this product was viewed upon request. Going back to our topic There are 2 possibilities for spot 1 - We can see the price drop to 0.001 and wait for a return, but if we see that the price of this product bottoms out again with this return, the rally in this product may end between 13-30 dollars 2-The price falls below 0.001 and returns, with a 0.1 cent break, it cannot fall below 0.001 again, then I expect 2k It is very difficult to decide, it would be more accurate to watch it, but for those who like risk, it can cost 0.001 or less, but not with large figures. I think you can take risks and buy some, but I am speaking for my personal account and it is not investment advice.

RoyalExcellence
FIDAUSDT Trading Idea.
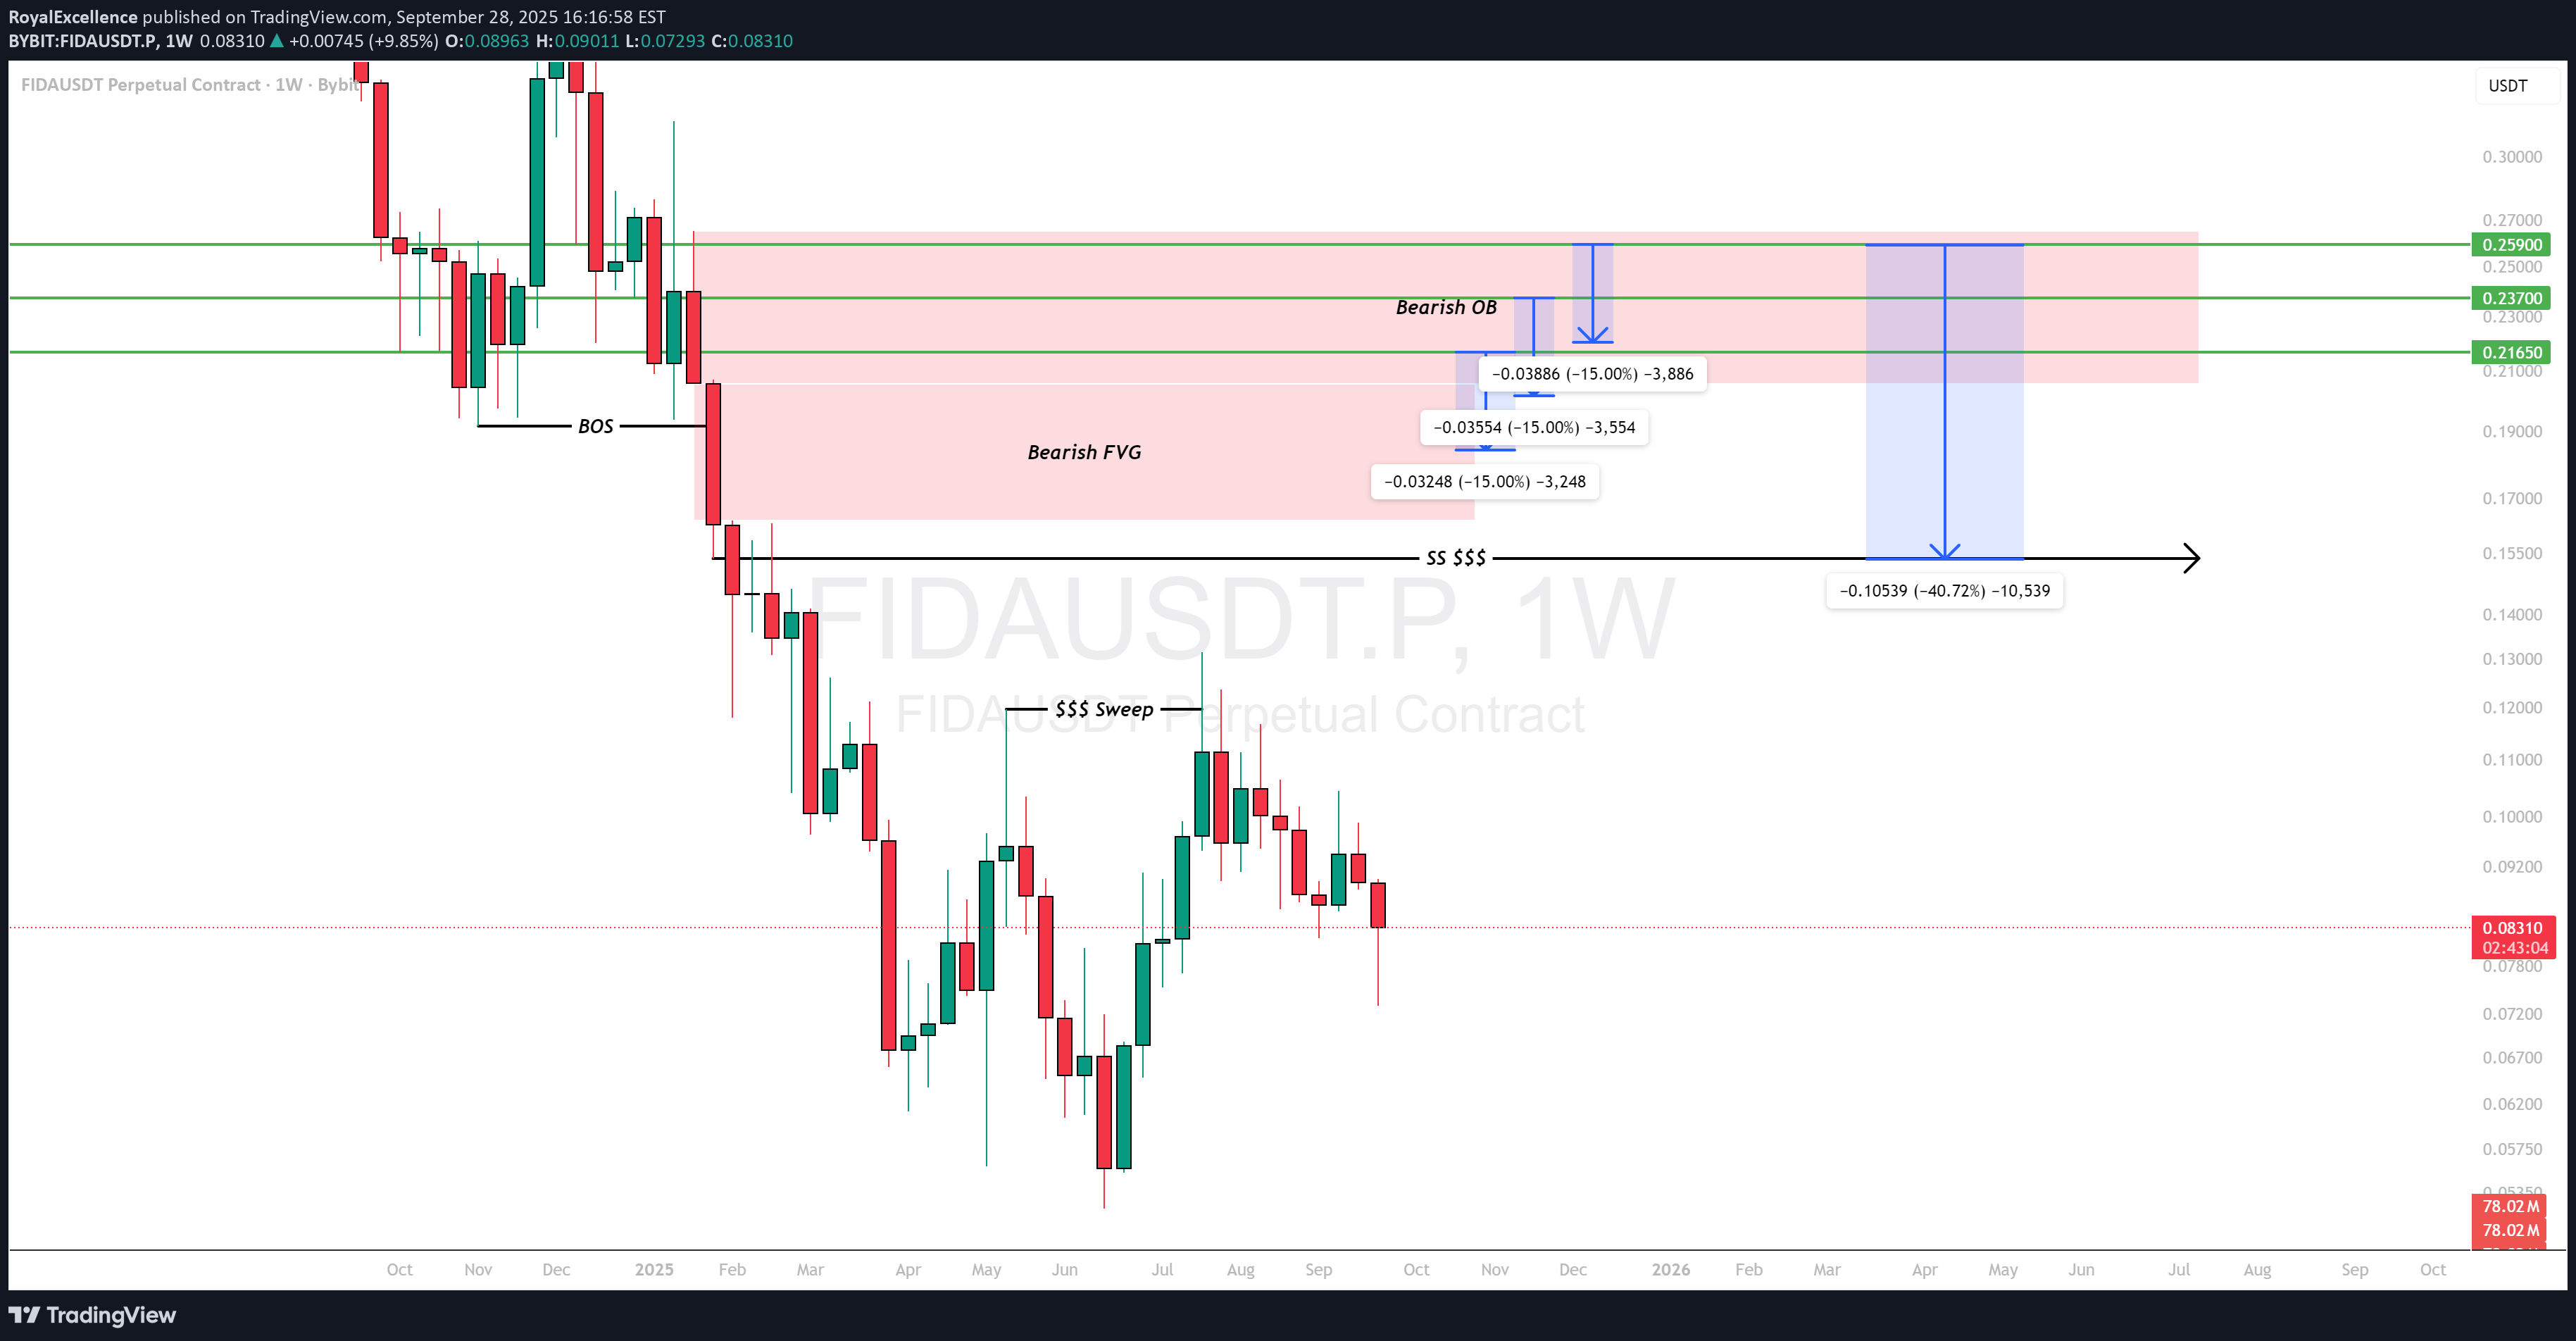
Likely a reversal to the downside from $0.21650, $0.23700 OR $0.25900 provided the one week order block is not mitigated. The preferred position should be a short position.
Bithereum_io
FIDAUSDT 1D
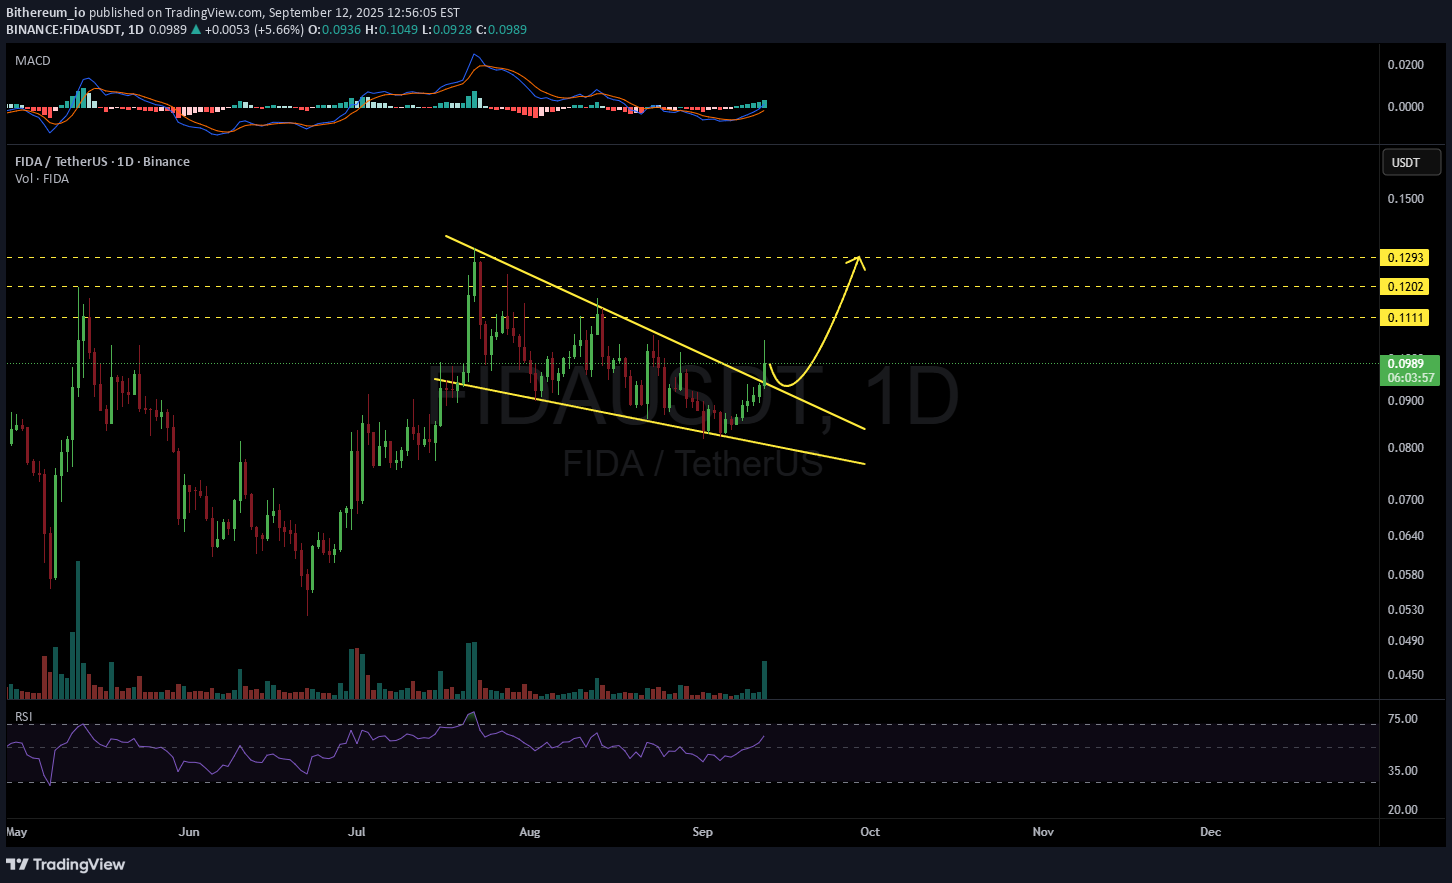
#FIDA has broken above the falling wedge pattern on the daily timeframe, and a retest of the pattern is possible. The targets are: 🎯 $0.1111 🎯 $0.1202 🎯 $0.1293 ⚠️ Always remember to use a tight stop-loss and follow proper risk management.

pullbacksignal
FIDAUSDT Bullish pattern is completing
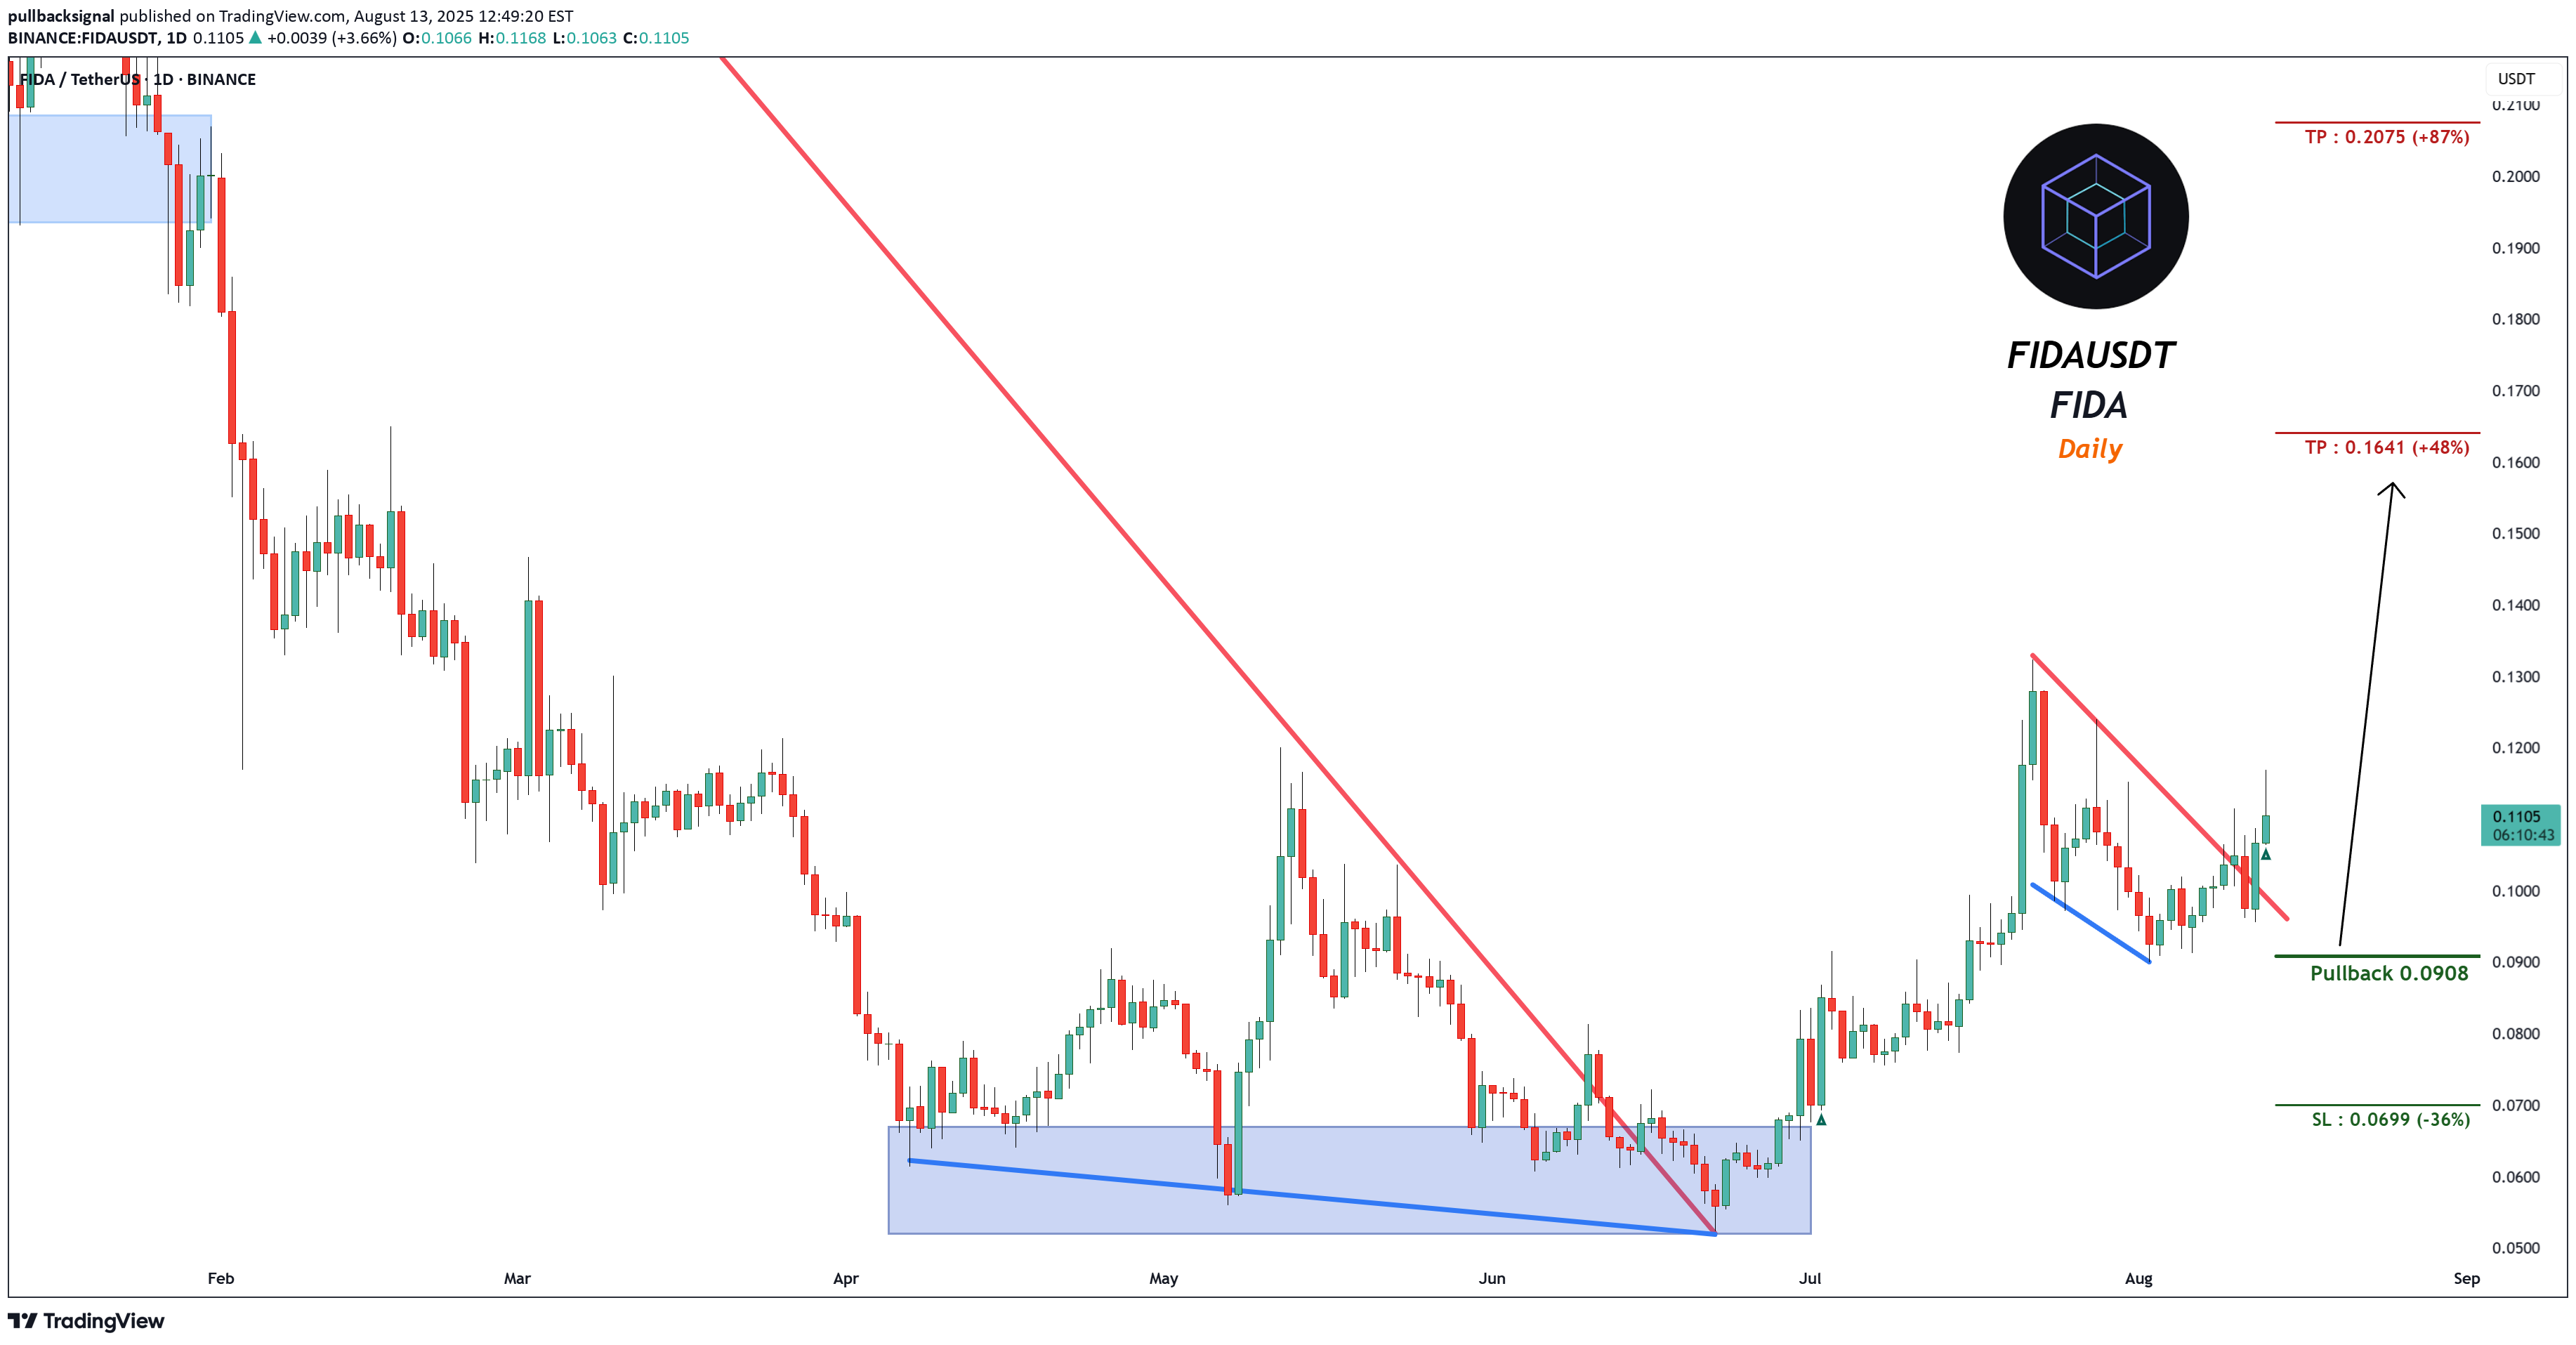
Trading Setup: A Trading Signal is seen in the FIDAUSDT FIDA (Daily) Traders can open their Buy Trades NOW ⬆️Buy now or Buy on 0.0908 ⭕️SL @ 0.0699 (-36%) 🔵TP1 @ 0.1641 (+48%) 🔵TP2 @ 0.2075 (+87%) What are these signals based on? Classical Technical Analysis Price Action Candlesticks Fibonacci RSI, Moving Average , Ichimoku , Bollinger Bands Risk Warning Trading Forex, CFDs, Crypto, Futures, and Stocks involve a risk of loss. Please consider carefully if such trading is appropriate for you. Past performance is not indicative of future results. If you liked our ideas, please support us with your likes 👍 and comments .
pullbacksignal
FIDAUSDT Bearish FLAG Pattern
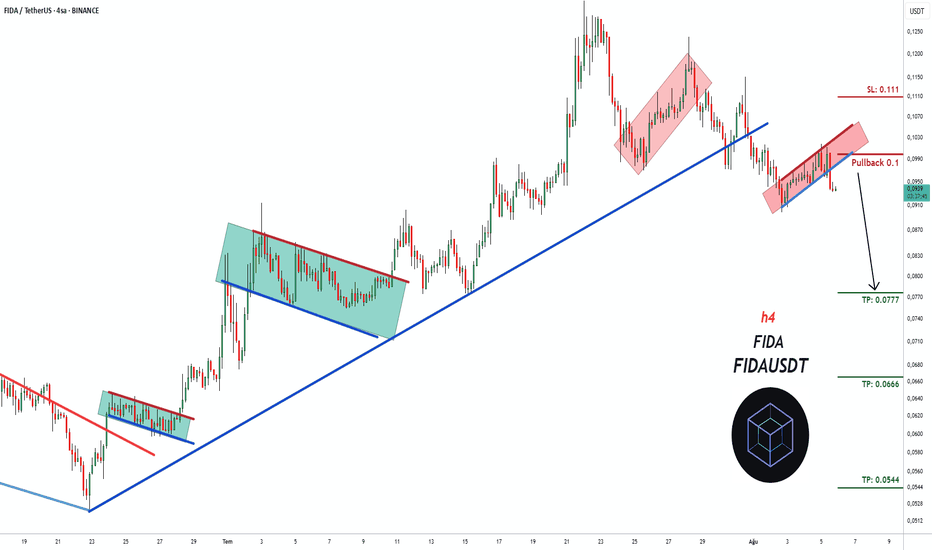
İşlem Kurulumu: FIDAUSDT FIDA (Vadeli İşlemler) (4s)'de bir İşlem Sinyali görülüyor İşlemciler ŞİMDİ Satış İşlemlerini açabilirler ⬇️ Şimdi veya 0,1'den sat ⭕️SL @ 0,111 🔵TP1 @ 0,0777 🔵TP2 @ 0,0666 🔵TP3 @ 0,0544 Bu sinyaller neye dayanıyor? Klasik Teknik Analiz Fiyat Hareketi Mum Grafikleri Fibonacci RSI, Hareketli Ortalama, Ichimoku, Bollinger Bantları Risk Uyarısı Forex, CFD, Kripto, Vadeli İşlemler ve Hisse Senetleri ticareti kayıp riski içerir. Bu tür bir yatırımın sizin için uygun olup olmadığını lütfen dikkatlice değerlendirin. Geçmiş performans, gelecekteki sonuçların göstergesi değildir. Fikirlerimizi beğendiyseniz, lütfen beğenileriniz 👍 ve yorumlarınızla bizi destekleyin.
pullbacksignal
FIDAUSDT Bearish FLAG Pattern
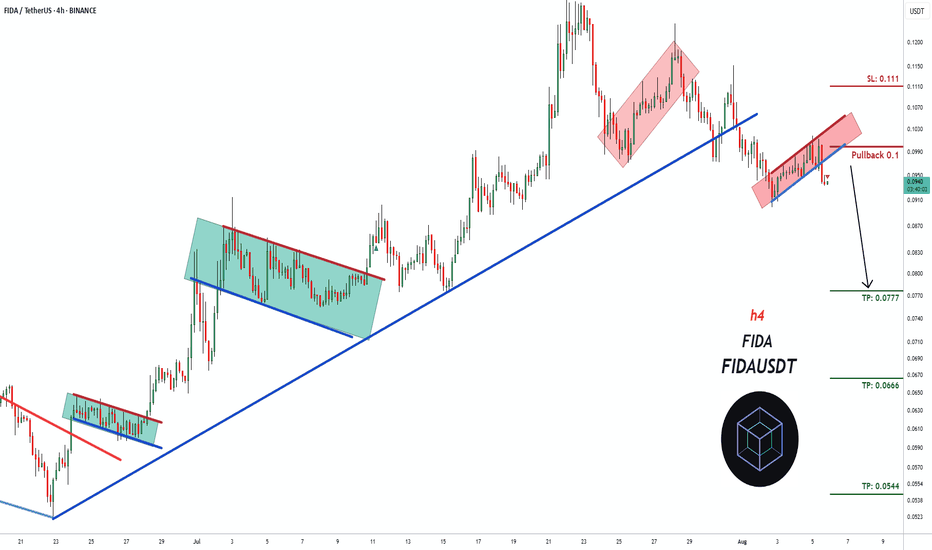
Trading Setup: A Trading Signal is seen in the FIDAUSDT FIDA (Futures) (4h) Traders can open their Sell Trades NOW ⬇️ Sell now or sell on 0.1 ⭕️SL @ 0.111 🔵TP1 @ 0.0777 🔵TP2 @ 0.0666 🔵TP3 @ 0.0544 What are these signals based on? Classical Technical Analysis Price Action Candlesticks Fibonacci RSI, Moving Average , Ichimoku , Bollinger Bands Risk Warning Trading Forex, CFDs, Crypto, Futures, and Stocks involve a risk of loss. Please consider carefully if such trading is appropriate for you. Past performance is not indicative of future results. If you liked our ideas, please support us with your likes 👍 and comments .
Disclaimer
Any content and materials included in Sahmeto's website and official communication channels are a compilation of personal opinions and analyses and are not binding. They do not constitute any recommendation for buying, selling, entering or exiting the stock market and cryptocurrency market. Also, all news and analyses included in the website and channels are merely republished information from official and unofficial domestic and foreign sources, and it is obvious that users of the said content are responsible for following up and ensuring the authenticity and accuracy of the materials. Therefore, while disclaiming responsibility, it is declared that the responsibility for any decision-making, action, and potential profit and loss in the capital market and cryptocurrency market lies with the trader.