
EIGEN
EigenLayer
| تریدر | نوع سیگنال | حد سود/ضرر | زمان انتشار | مشاهده پیام |
|---|---|---|---|---|
No results found. | ||||
Price Chart of EigenLayer
سود 3 Months :
سیگنالهای EigenLayer
Filter
Sort messages by
Trader Type
Time Frame

FDaylak
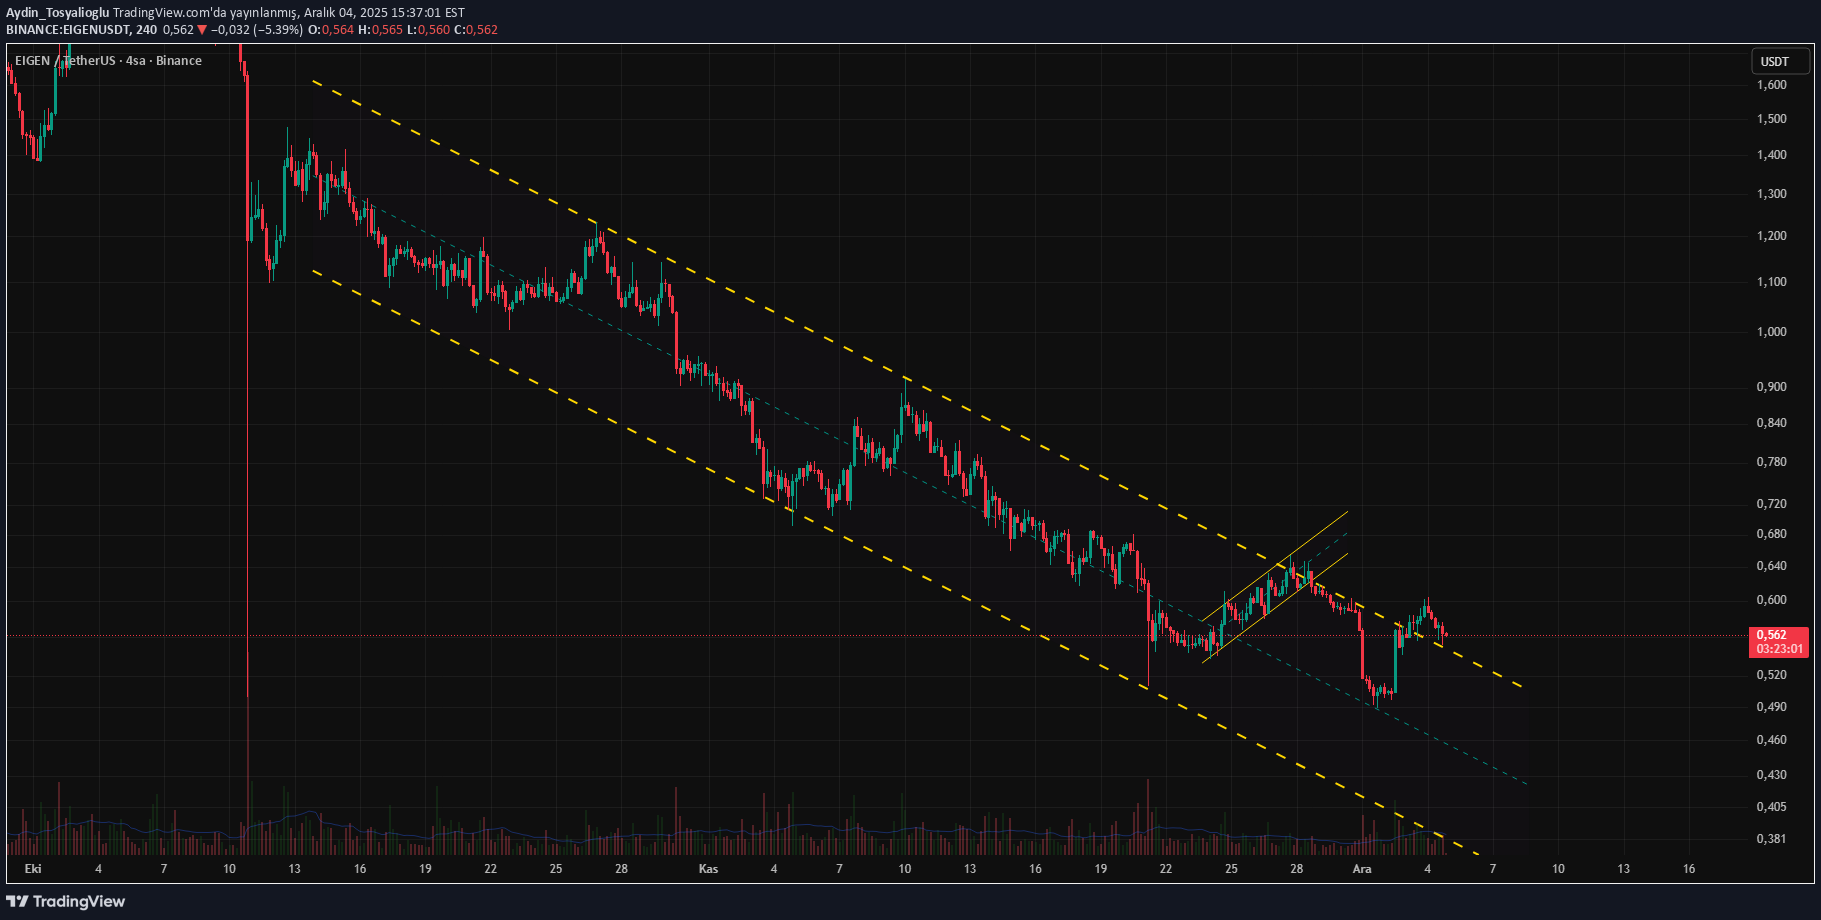
EIGEN UZUN VADE HAREKET TAHMİNİM

I'm sharing it just for follow-up purposes, I want to see how the chart has matured after 1-1.5 years.
EIGENUSDT.P tarafında oluşan daralan üçgenin sonu ne olacak ?

The narrowing triangle in the EIGENUSDT.P parity catches our eye. It is useful to follow the breakouts. It seems possible that we will see a rapid exit to get the trend liquidity after a possible upward break. However, if there is a downward break, it is likely to result in disappointment...

Cryptojobs
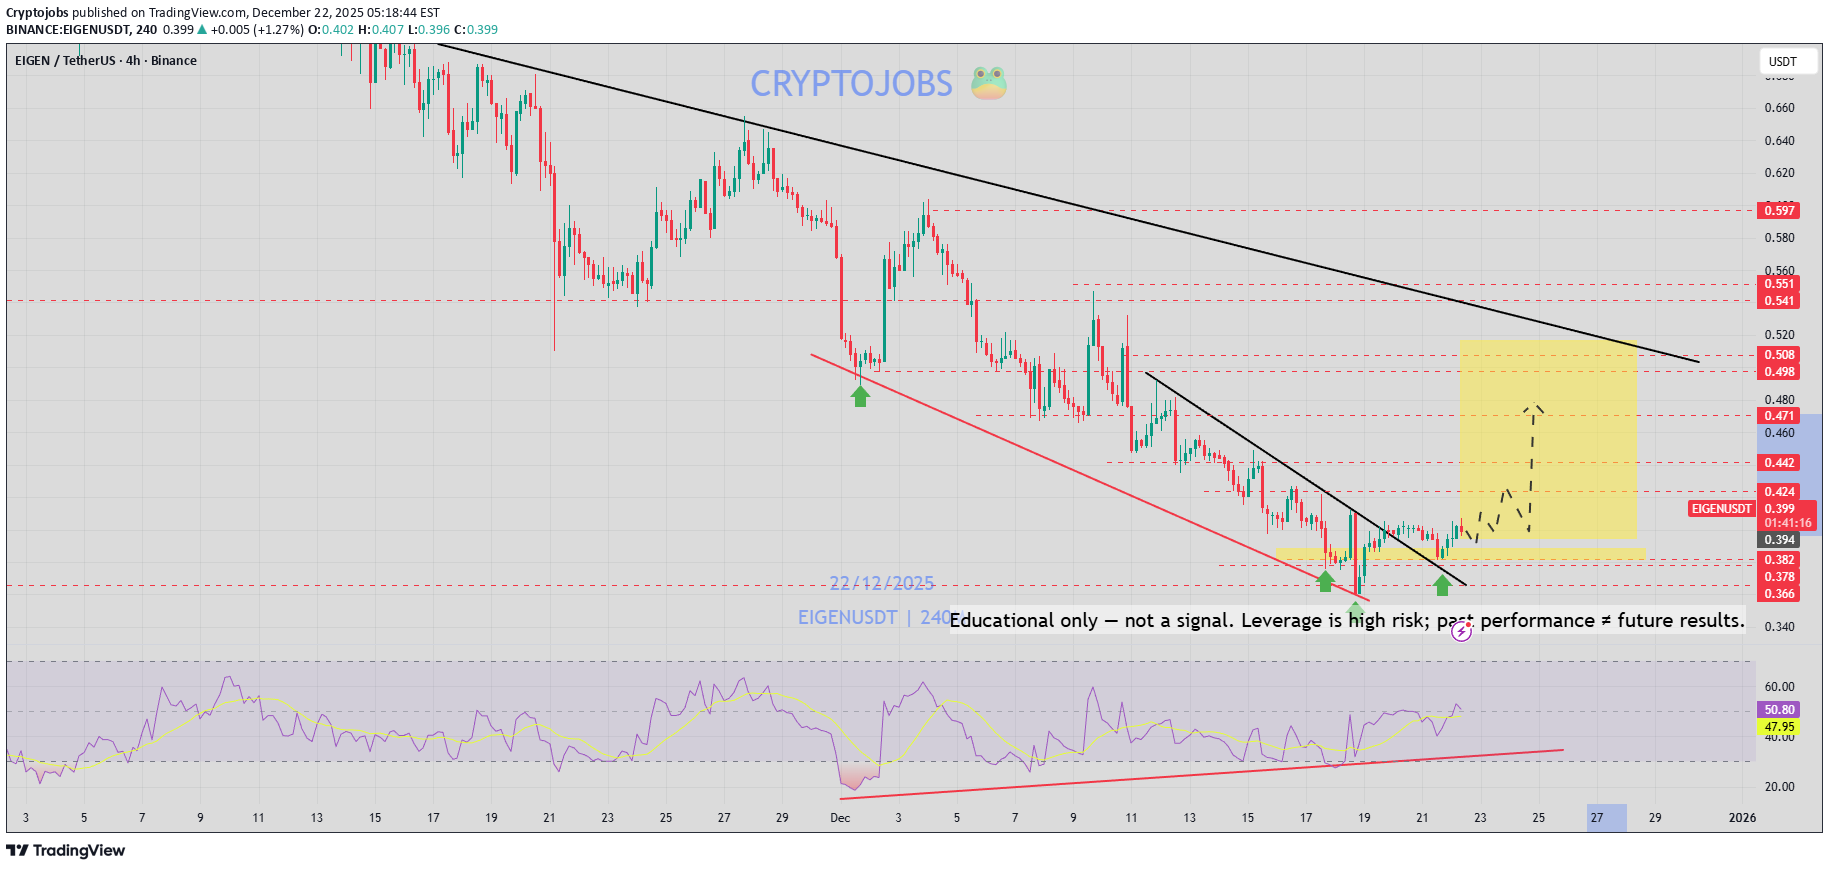
تحلیل تکنیکال EIGEN: آیا شکست کانال، نقطه عطف جدیدی است؟
EIGEN (4H) broke its falling channel to the upside, but immediately came back to the test. A high volume response is required here — falling back into the channel at the critical level would be very negative. ⚠️ It is not investment advice.

BandForBands

arpaciramazan86
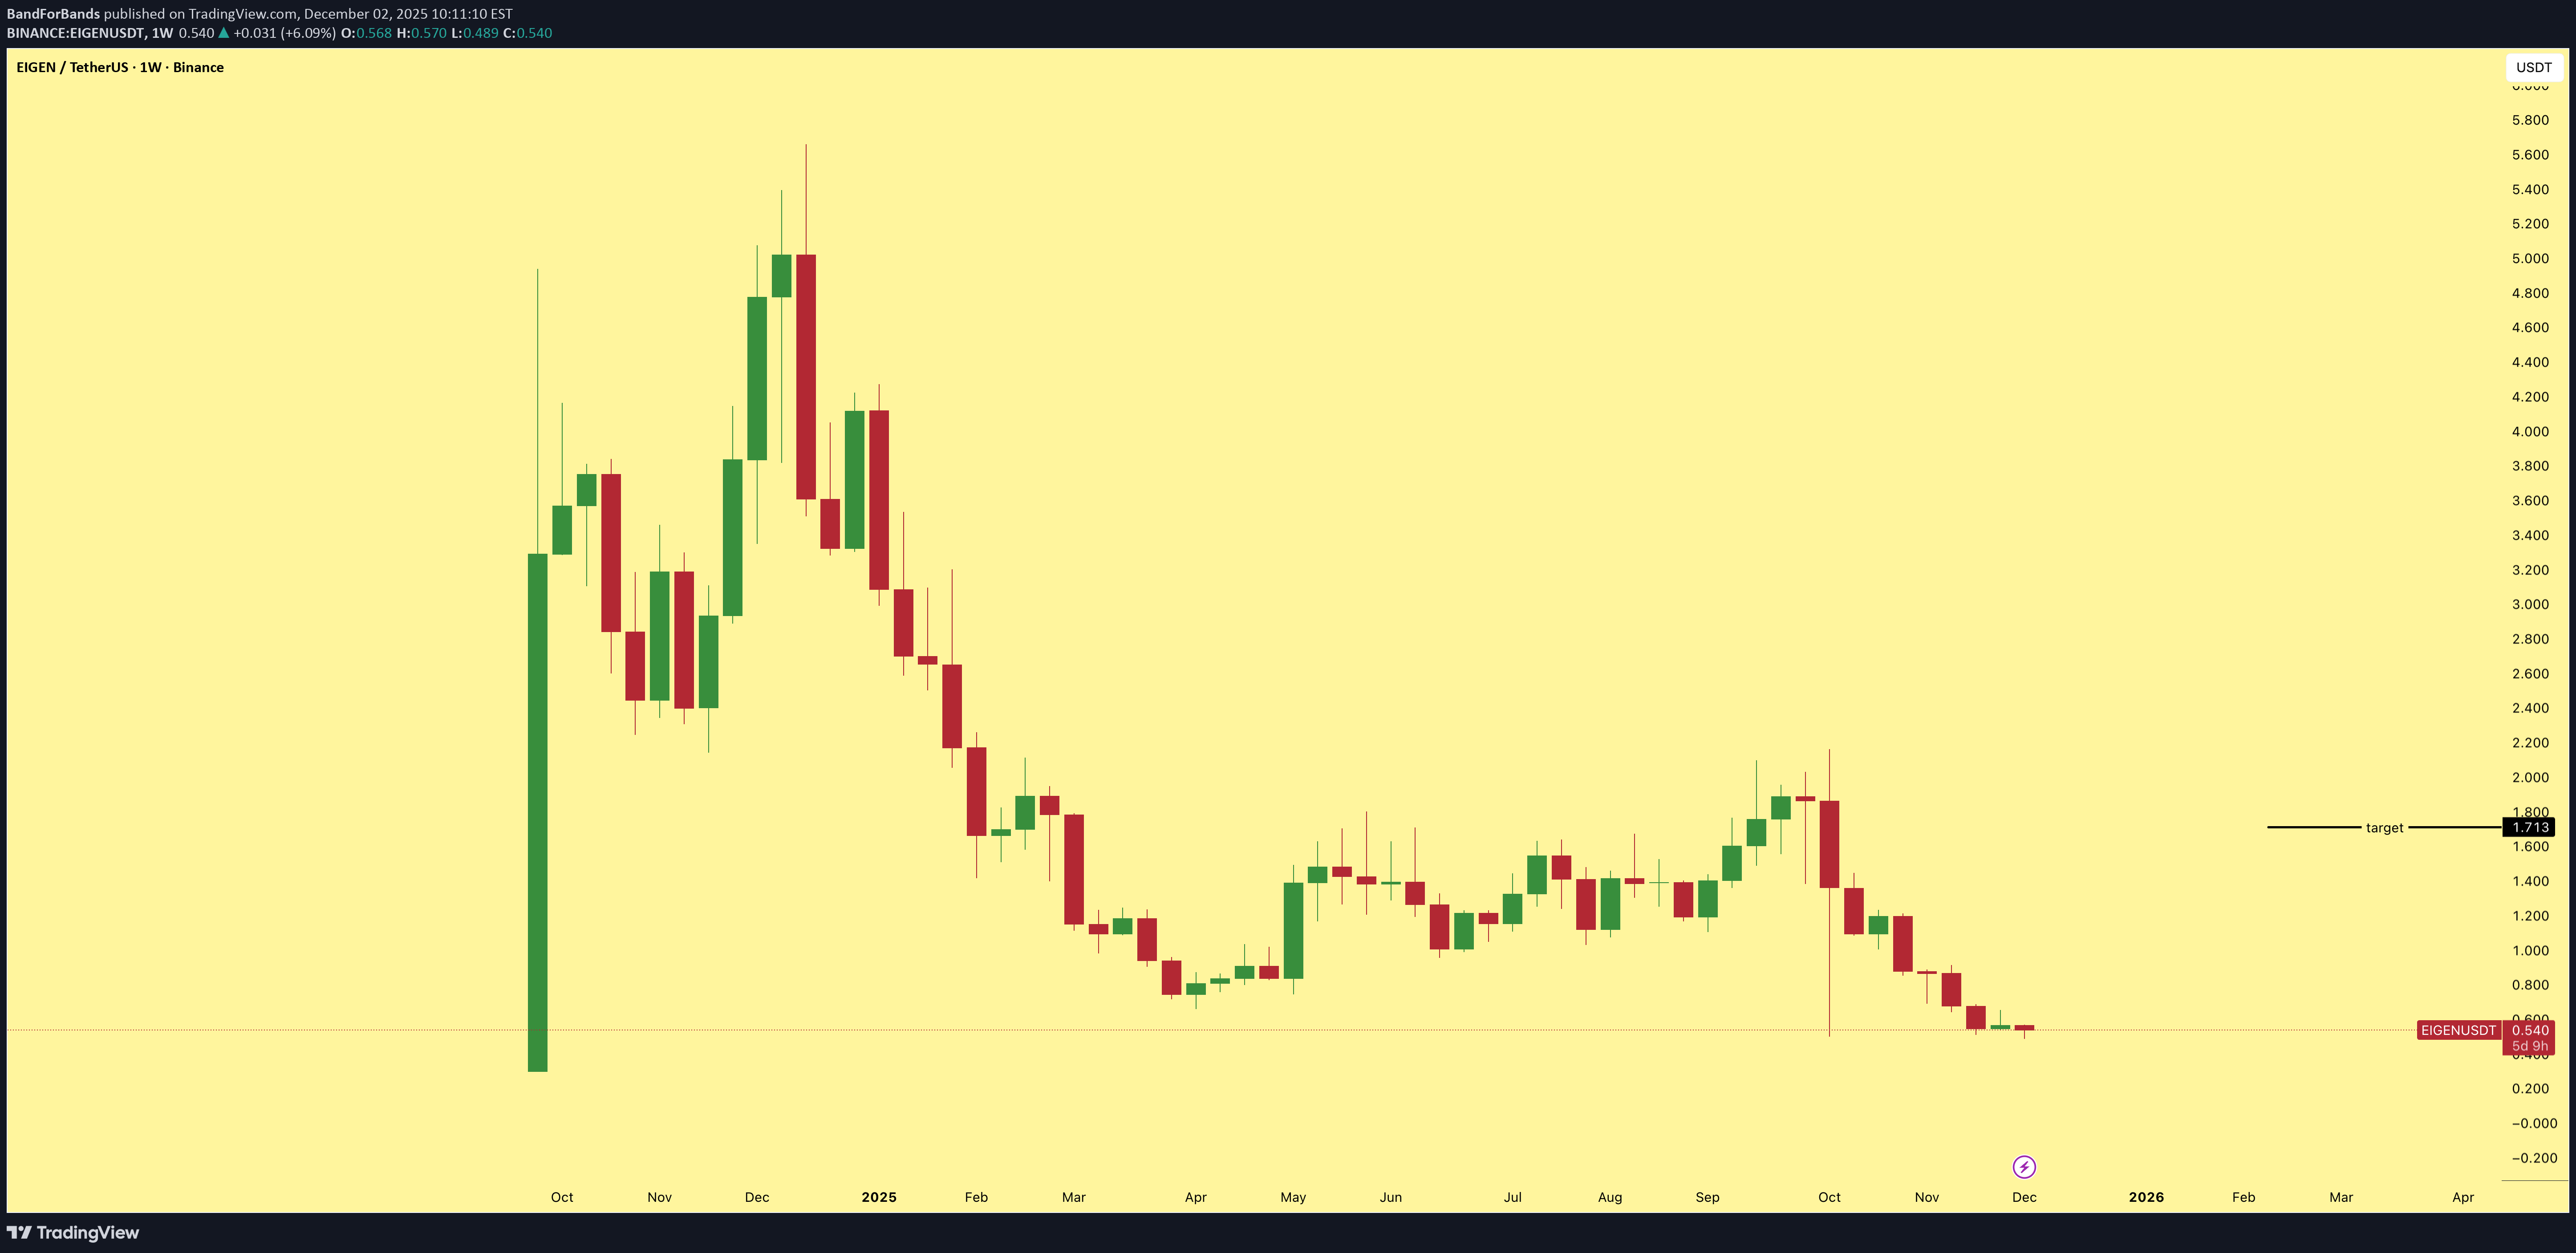
پروژه وب 3 با پتانسیل انفجاری پس از ATH اتریوم: امنیت آسان و استیکینگ بدون دردسر!
A project that makes it easier to build a security mechanism for Web3 developers who aim to develop decentralized applications and services on the Ethereum network. With the restaking concept, it saves these applications and services from having to find their own stakers. I think Eth is the project with the highest potential after ath. Technically, it was designed to set a final goal for myself and does not contain investment advice.

Bithereum_io
قیمت EIGEN در آستانه انفجار صعودی: اهداف قیمتی شگفتانگیز در تایم فریم ۱۲ ساعته!
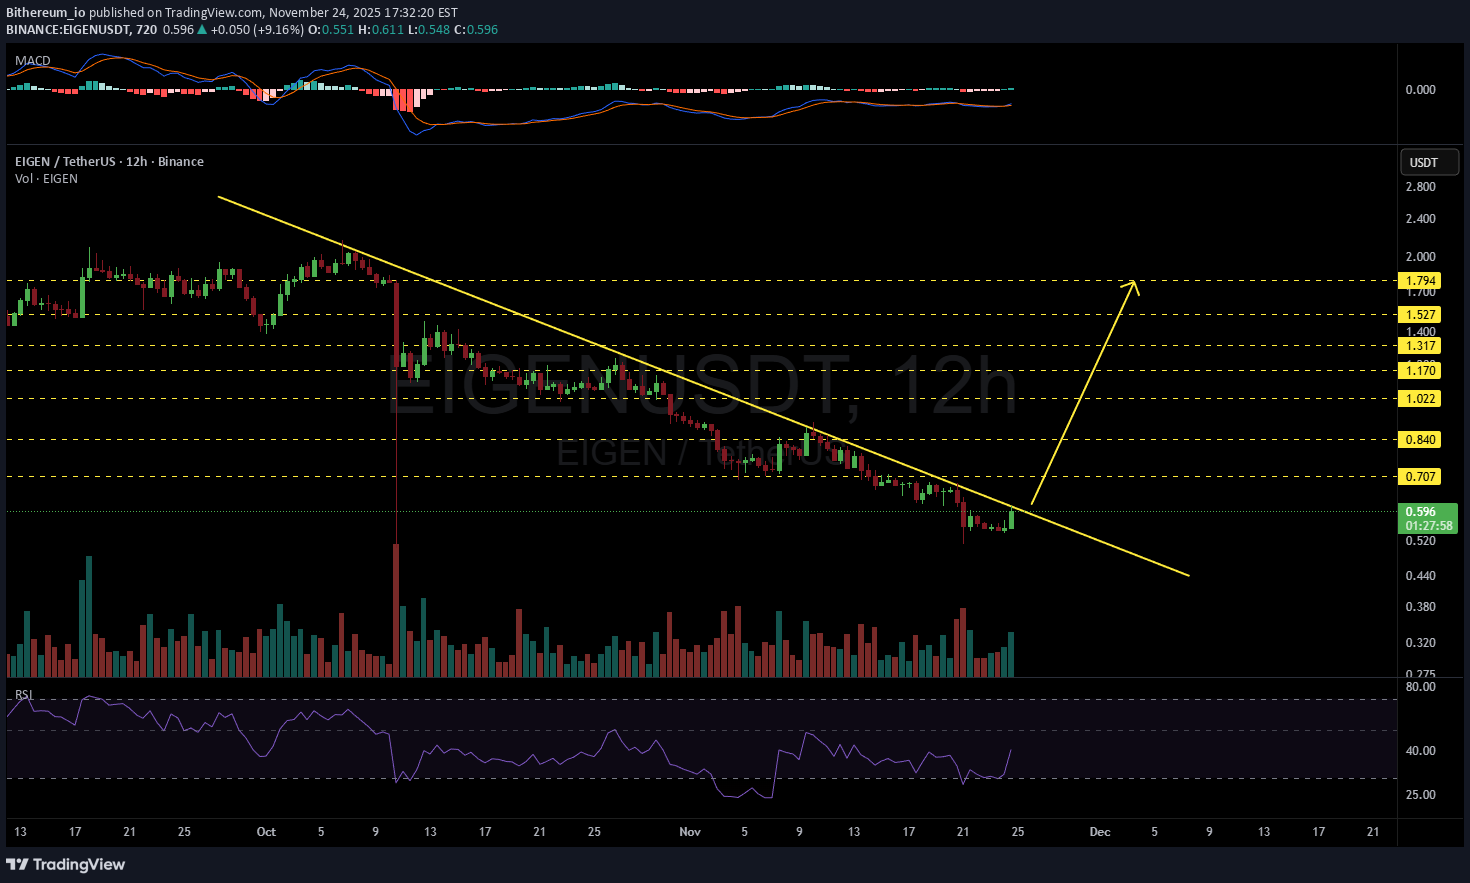
Keep an eye on the #EIGEN 12H timeframe chart. It is on the verge of breaking above the descending resistance. Both RSI and MACD indicate the possibility of incoming bullish momentum. In case a breakout confirms, the potential upside targets are: 🎯 $0.707 🎯 $0.840 🎯 $1.022 🎯 $1.170 🎯 $1.317 🎯 $1.527 🎯 $1.794 ⚠️ Always remember to use a tight stop-loss and maintain proper risk management.

CryptoNuclear
EIGEN/USDT: لحظه حساس؛ آیا غول صعودی از منطقه تجمعی برمیخیزد یا سقوط ادامه دارد؟
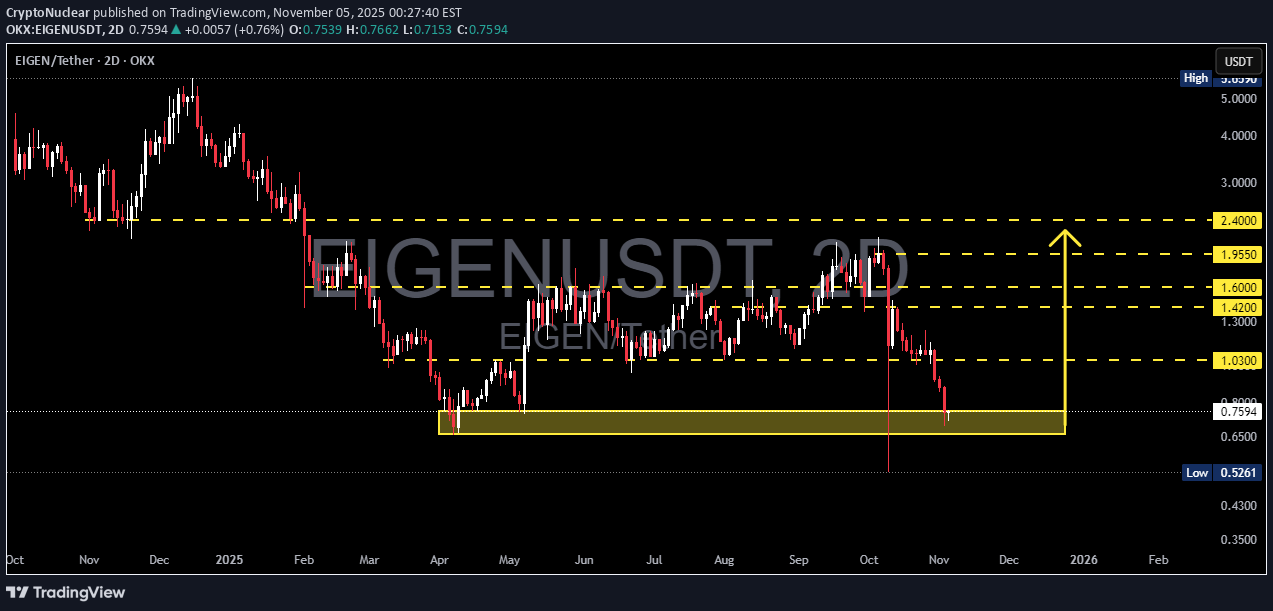
EIGEN currently stands at the edge of a cliff — right above its major accumulation zone between 0.76–0.66, an area that has acted as a strong demand base since March 2025. This is a decisive moment: will we witness a macro reversal formation or a continuation of the downtrend? After a steady decline since October, price has returned to the same demand zone where smart money previously absorbed heavy sell pressure. The long lower wick seen here suggests a liquidity sweep, a classic signal of accumulation before a potential bullish reversal. Structurally, the market is still in a short-term downtrend — but the combination of oversold conditions and strong horizontal support makes this zone extremely important for a possible rebound. --- Bullish Scenario If the 0.76–0.66 zone successfully absorbs selling pressure again and a bullish rejection candle forms with notable volume, then EIGEN could initiate a multi-stage rebound toward: Target 1: 1.03 Target 2: 1.42 Target 3: 1.60–1.95 Extended target: 2.40 A decisive 2D candle close above 0.85–0.90 would serve as a strong confirmation of bullish strength and potential trend reversal. --- Bearish Scenario If price breaks and closes below 0.66, A lower low structure will form, confirming continuation of the downtrend. The next potential support lies around 0.526, aligning with a previous swing low. Any failed retest of 0.66 as resistance after breakdown could trigger another leg lower. --- Pattern & Market Structure This chart highlights a broad accumulation range at the base of the trend — potentially the early stage of a Wyckoff accumulation phase. The yellow zone may act as the spring point, where liquidity is flushed before a major markup. However, if sellers maintain dominance, this same zone could transform into a redistribution area before further decline. --- Strategy & Risk Management Conservative entry: Wait for a confirmed bullish candle closing above 0.76–0.80. Aggressive entry: Gradually scale in between 0.70–0.75 with a stop below 0.64. Take profit levels: Align with resistance zones (1.03, 1.42, 1.60+). Breakdown play: Wait for a 2D close below 0.66 and short on retest failure. Risk control: Keep total risk per trade under 1–2% of capital. --- Core Narrative EIGEN is now at a make-or-break zone. This is the last stronghold for buyers — and possibly a golden opportunity for traders waiting for a clear directional bias. A bullish reversal here could ignite a multi-week rally, attracting attention across the market. But a decisive breakdown below the range could mark the start of a capitulation phase toward deeper lows. --- Conclusion The 0.76–0.66 zone represents the heartbeat of EIGEN’s current market cycle. As long as price holds above it, the probability of a strong reversal remains alive — offering a compelling reward-to-risk setup. But if the level collapses, traders should prepare for a potential slide toward 0.52 or even lower. --- #EIGEN #EIGENUSDT #Crypto #Altcoins #TechnicalAnalysis #PriceAction #SupportResistance #SwingTrading #SmartMoney #Wyckoff #LiquiditySweep #ReversalZone #CryptoAnalysis #MarketStructure
CryptoNuclear
EIGEN در آستانه سقوط: آیا خریداران از آخرین سنگر دفاعی 1.10 دلار دفاع میکنند؟

EIGEN is once again approaching a critical demand zone around 0.95 – 1.10, a level that has repeatedly acted as the market’s turning point throughout this cycle. This zone isn’t just a technical level — it’s the final line of defense separating a potential accumulation phase from a deeper breakdown. After rallying toward 2.0 in early October, sellers regained control, printing a clear sequence of lower highs and pushing price back down into the same historical demand area. Each touch of this yellow block has sparked aggressive buy reactions, suggesting there are still strong buyers defending this region. --- Bullish Scenario (Bounce & Reversal) The bullish outlook remains valid as long as price holds above 1.00 – 1.10. A clear bullish engulfing candle or a strong rejection wick in this demand zone could confirm a reversal setup. If confirmed: Entry: Above 1.20 – 1.25 (confirmation breakout). Targets: Target 1 → 1.42 (first key resistance). Target 2 → 1.60 (mid-range supply zone). Target 3 → 1.97 – 2.00 (major structural target). Stop-loss: Below 0.94 – 0.95 (bullish invalidation). A daily close above 1.60 would confirm a structure shift and re-establish medium-term bullish momentum. --- Bearish Scenario (Breakdown & Continuation) If the demand zone fails to hold and price closes below 0.95, sellers could regain full momentum, opening the door for a continuation move toward 0.75 – 0.80. Bearish confirmation signals include: A decisive daily close below the yellow zone. Failed retest around 1.00 – 1.10 (support turning into resistance). Rising sell volume confirming downward pressure. Such conditions would likely trigger a bearish continuation pattern, as the liquidity beneath this zone remains largely untested. --- Pattern & Structure Analysis Range Accumulation Zone: The 0.95 – 1.10 area has repeatedly acted as a multi-tested demand base for accumulation. Lower High Formation: Sellers remain dominant since the October peak. Liquidity Wick Trap: The deep lower wick indicates stop-hunting behavior, often preceding strong reversals or momentum shifts. Horizontal Resistance Ladder: Step-by-step resistance levels at 1.42, 1.59, and 1.97 will act as key checkpoints for any bullish recovery. --- Conclusion EIGEN is standing at a critical battlefield between continued accumulation and a deeper breakdown. Traders should wait for clear confirmation at this demand zone before committing to any major position. A daily close above 1.25 reopens the path to bullish recovery, while a breakdown below 0.95 could accelerate the next bearish leg toward 0.75 or lower. The upcoming reaction from this zone will likely define EIGEN’s next multi-week trend direction. --- #EIGEN #EIGENUSDT #Crypto #Altcoin #TechnicalAnalysis #PriceAction #SupportResistance #MarketStructure #SwingTrading #CryptoAnalysis #ChartUpdate

Morningtsar
خرید و فروش توکن PAPARAZZI: راهنمای کامل صرافیهای برتر

PAPARAZZI tokens can be traded on centralized crypto exchanges. The most popular exchange to buy and trade Paparazzi Token is Gate, where the most active trading pair PAPARAZZI/USDT has a trading volume of $752,585 in the last 24 hours. Other popular options include KCEX and BingX.
Disclaimer
Any content and materials included in Sahmeto's website and official communication channels are a compilation of personal opinions and analyses and are not binding. They do not constitute any recommendation for buying, selling, entering or exiting the stock market and cryptocurrency market. Also, all news and analyses included in the website and channels are merely republished information from official and unofficial domestic and foreign sources, and it is obvious that users of the said content are responsible for following up and ensuring the authenticity and accuracy of the materials. Therefore, while disclaiming responsibility, it is declared that the responsibility for any decision-making, action, and potential profit and loss in the capital market and cryptocurrency market lies with the trader.