
DYM
Dymension
| تریدر | نوع سیگنال | حد سود/ضرر | زمان انتشار | مشاهده پیام |
|---|---|---|---|---|
No results found. | ||||
Price Chart of Dymension
سود 3 Months :
سیگنالهای Dymension
Filter
Sort messages by
Trader Type
Time Frame

CryptoAnalystSignal
دایممکس (DYM) در مرز سقوط: آیا زمان برگشت فرا رسیده است؟ (تحلیل فنی و پیشبینی قیمت)
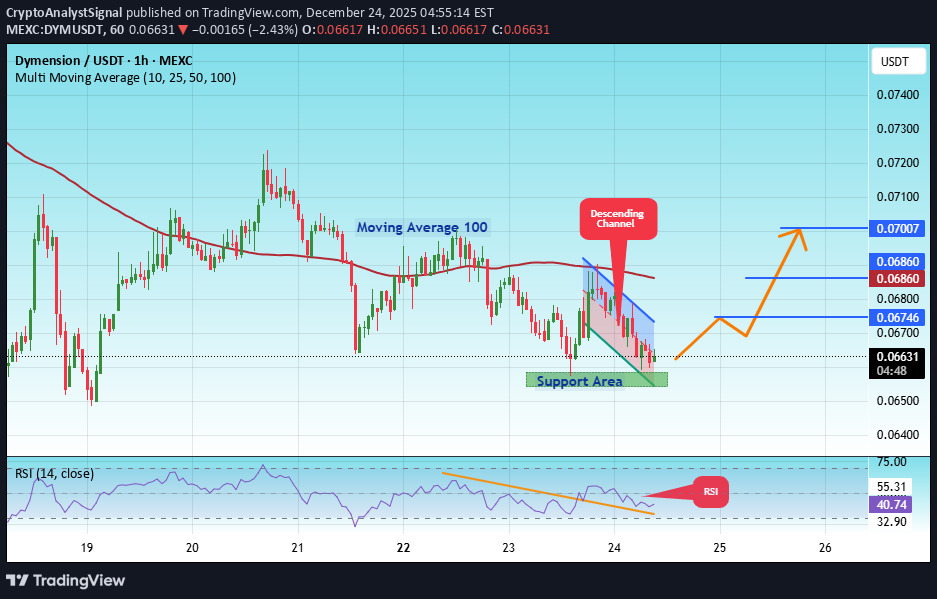
#DYM The price is moving in a descending channel on the 1-hour timeframe. It has reached the lower boundary and is heading towards breaking above it, with a retest of the upper boundary expected. We have a downtrend on the RSI indicator, which has reached near the lower boundary, and an upward rebound is expected. There is a key support zone in green at 0.06560. The price has bounced from this level multiple times and is expected to bounce again. We have a trend towards consolidation above the 100-period moving average, as we are moving close to it, which supports the upward movement. Entry price: 0.06633 First target: 0.06746 Second target: 0.06860 Third target: 0.07007 Don't forget a simple principle: money management. Place your stop-loss order below the support zone in green. For any questions, please leave a comment. Thank you.#DYM First target: 0.06746 Reached Second target: 0.06860 Reached#DYM First target: 0.06746 Reached Second target: 0.06860 Reached Third target: 0.07007 Reached
CryptoAnalystSignal
تحلیل تکنیکال DYM/USDT: فرصت خرید در کف کانال نزولی (با اهداف قیمتی مشخص)
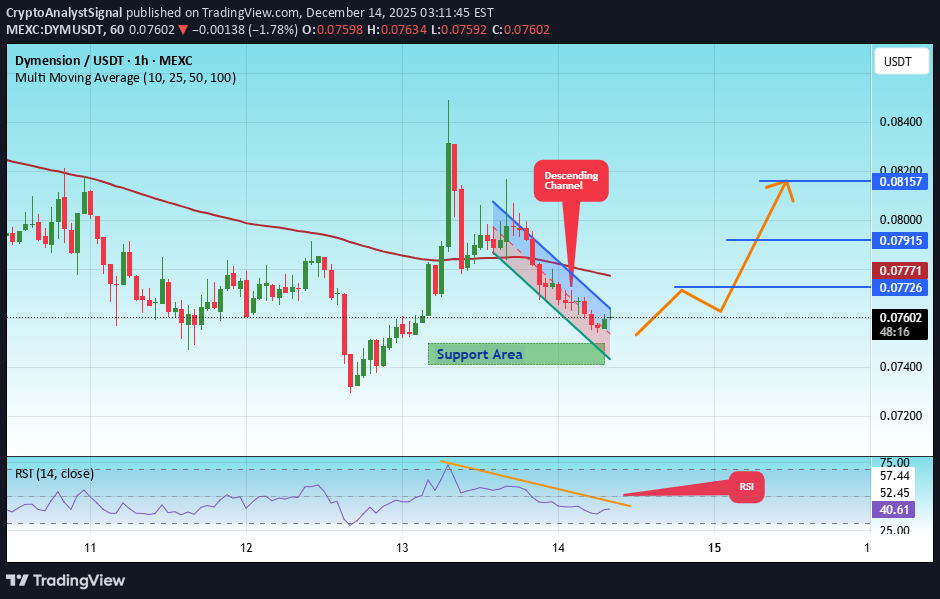
#DYM The price is moving in a descending channel on the 1-hour timeframe. It has reached the lower boundary and is heading towards breaking above it, with a retest of the upper boundary expected. We have a downtrend on the RSI indicator, which has reached near the lower boundary, and an upward rebound is expected. There is a key support zone in green at 0.07430. The price has bounced from this level multiple times and is expected to bounce again. We have a trend towards stability above the 100-period moving average, as we are moving close to it, which supports the upward movement. Entry price: 0.07600 First target: 0.07726 Second target: 0.07915 Third target: 0.08157 Don't forget a simple principle: money management. Place your stop-loss below the support zone in green. For any questions, please leave a comment. Thank you.#DYM First target: 0.07726 Reached Second target: 0.07915 Reached Third target: 0.08157 Reached

iMoneyTeam
DYM Sell/Short Setup (30M)
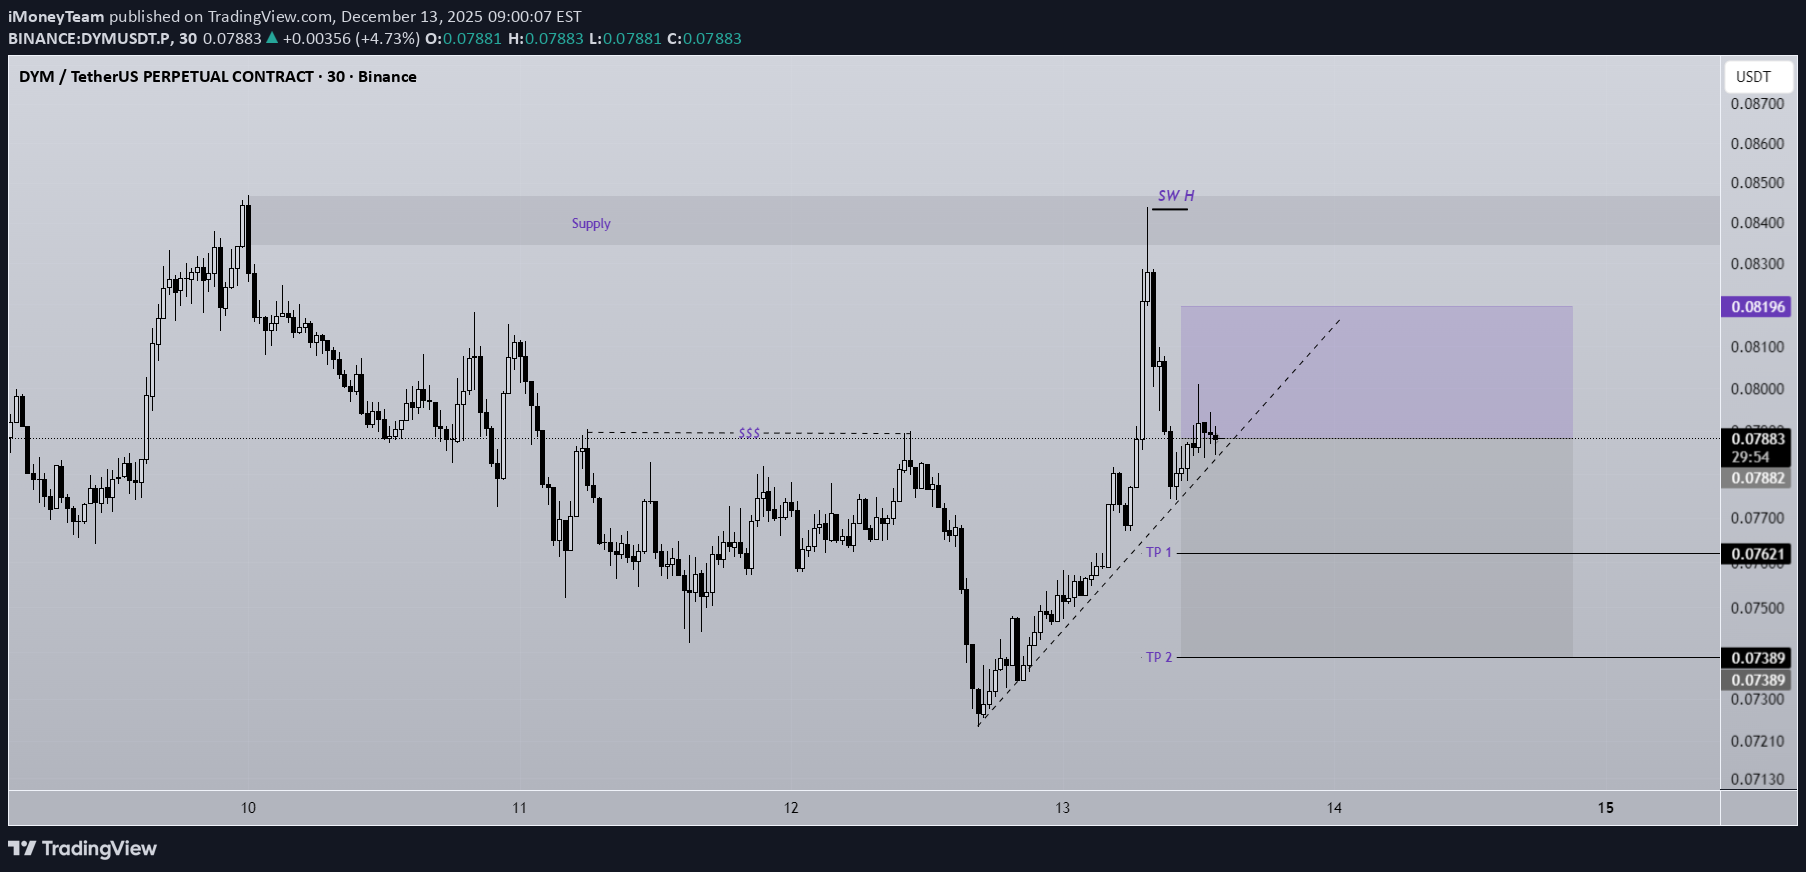
Price has reacted to a strong supply zone above. A breakable trendline has formed below price, and a liquidity pool above has been swept. Based on this setup, price can now move toward at least the minimum target marked on the chart. Take partial profits at the first target, then move the stop-loss to breakeven. Do not enter the position without capital management and stop setting Comment if you have any questions thank youThe first target was hit.
CryptoAnalystSignal
خرید DYM/USDT: فرصت خرید در کف کانال نزولی با اهداف صعودی جدید!
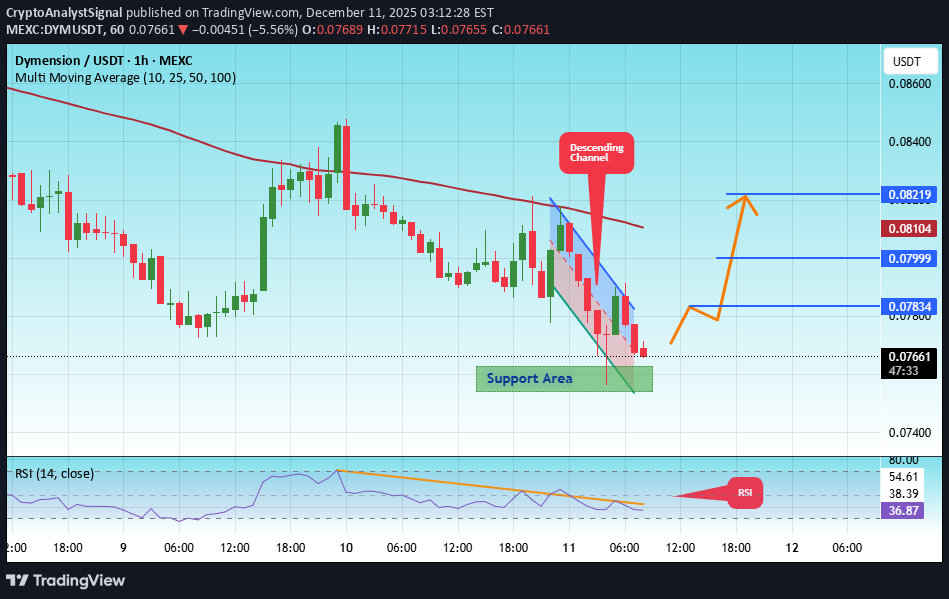
#DYM The price is moving in a descending channel on the 1-hour timeframe. It has reached the lower boundary and is heading towards breaking above it, with a retest of the upper boundary expected. We have a downtrend on the RSI indicator, which has reached near the lower boundary, and an upward rebound is expected. There is a key support zone in green at 0.07600. The price has bounced from this level multiple times and is expected to bounce again. We have a trend towards consolidation above the 100-period moving average, as we are moving close to it, which supports the upward movement. Entry price: 0.07680 First target: 0.07834 Second target: 0.08000 Third target: 0.08220 Don't forget a simple principle: money management. Place your stop-loss below the support zone in green. For any questions, please leave a comment. Thank you.#DYM First target: 0.07834 Reached Second target: 0.08000 Reached Third target: 0.08220 Reached
CryptoAnalystSignal
سیگنال خرید DYM/USDT: آماده جهش از کف حمایت کلیدی!
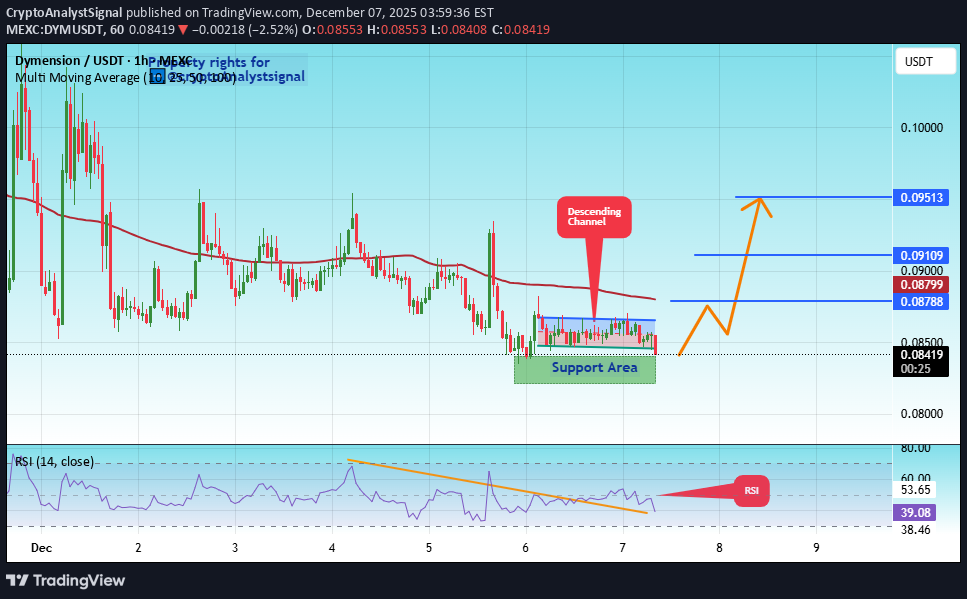
#DYM The price is moving in a descending channel on the 1-hour timeframe. It has reached the lower boundary and is heading towards breaking above it, with a retest of the upper boundary expected. We have a downtrend on the RSI indicator, which has reached near the lower boundary, and an upward rebound is expected. There is a key support zone in green at 0.08300. The price has bounced from this level multiple times and is expected to bounce again. We have a trend towards consolidation above the 100-period moving average, as we are moving close to it, which supports the upward movement. Entry price: 0.08411 First target: 0.08788 Second target: 0.09100 Third target: 0.09500 Don't forget a simple principle: money management. Place your stop-loss order below the support zone in green. For any questions, please leave a comment. Thank you.

The_Traders_House
سیگنال فروش فوری DYM: فرصت شکار قیمت از حمایت حیاتی ۰.۰۸۴۶۱!
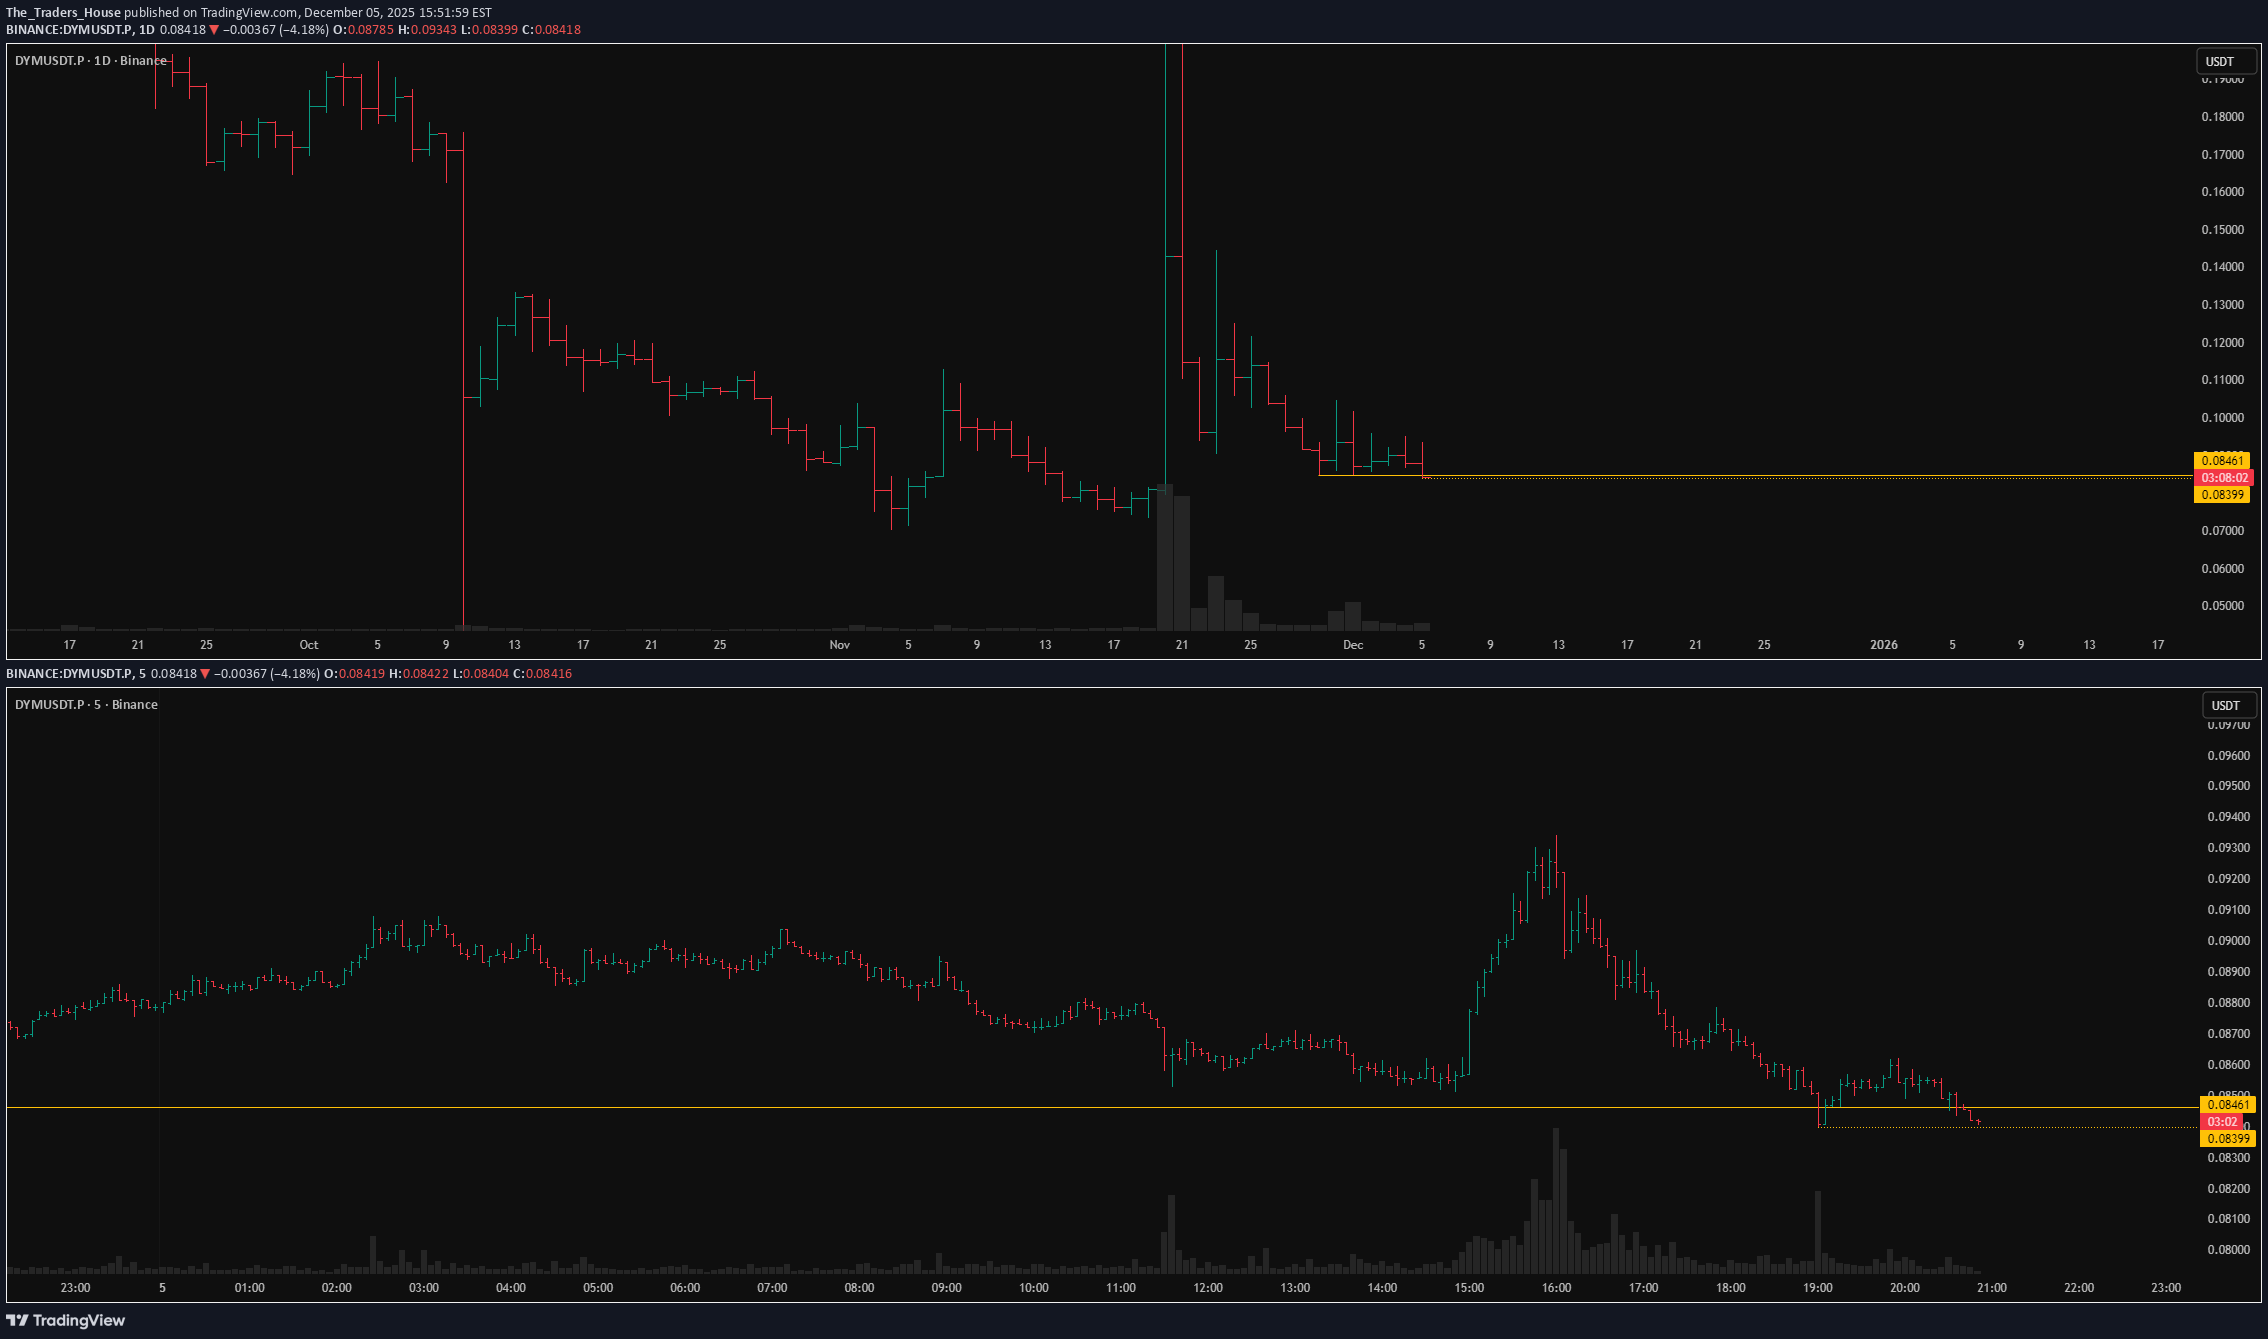
DYMUSDT.P has been holding above the level for nearly a week, confirming it multiple times. Recently, we saw a test via a false breakout, followed by only a shallow correction, and now the price is approaching the support again. This weak reaction from buyers is a good signal. In my opinion, a solid short setup is forming here from the local level at 0.08399. Key factors for this scenario: Global & local trend alignment Correlation with the market Volatility contraction on approach Immediate retest No reaction after a false break Was this analysis helpful? Leave your thoughts in the comments and follow to see more.The asset moved in the intended direction, but there was no valid entry.
CryptoAnalystSignal
خریدDYM/USDT: سیگنال خرید کمریسک با تریگرهای قوی صعودی!
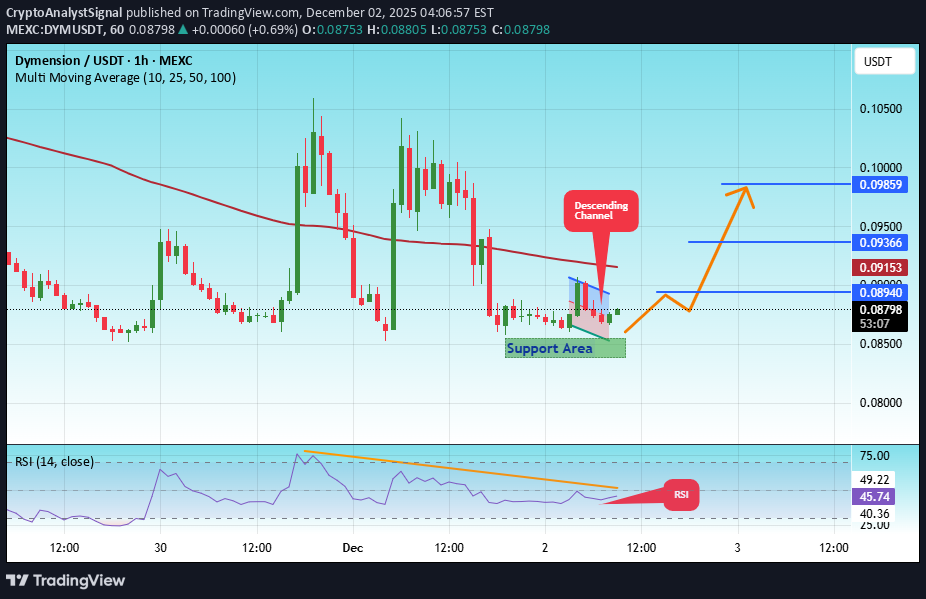
#DYM The price is moving in a descending channel on the 1-hour timeframe. It has reached the lower boundary and is heading towards breaking above it, with a retest of the upper boundary expected. We have a downtrend on the RSI indicator, which has reached near the lower boundary, and an upward rebound is expected. There is a key support zone in green at 0.08455. The price has bounced from this level multiple times and is expected to bounce again. We have a trend towards consolidation above the 100-period moving average, as we are moving close to it, which supports the upward movement. Entry price: 0.08777 First target: 0.08940 Second target: 0.09366 Third target: 0.09860 Don't forget a simple principle: money management. Place your stop-loss order below the green support zone. For any questions, please leave a comment. Thank you.
CryptoAnalystSignal
پیشبینی صعودی DYM/USDT: زمان خرید کمریسک در سطح حمایتی کلیدی!
#DYM The price is moving in a descending channel on the 1-hour timeframe. It has reached the lower boundary and is heading towards breaking above it, with a retest of the upper boundary expected. We have a downtrend on the RSI indicator, which has reached near the lower boundary, and an upward rebound is expected. There is a key support zone in green at 0.08455. The price has bounced from this level multiple times and is expected to bounce again. We have a trend towards consolidation above the 100-period moving average, as we are moving close to it, which supports the upward movement. Entry price: 0.08777 First target: 0.08940 Second target: 0.09366 Third target: 0.09860 Don't forget a simple principle: money management. Place your stop-loss order below the green support zone. For any questions, please leave a comment. Thank you.#DYM First target: 0.08940 Reached Second target: 0.09366 Reached
CryptoAnalystSignal
سیگنال خرید DYM/USDT: آیا قیمت به زودی اوج میگیرد؟ (تحلیل فنی و نقاط ورود)
#DYM The price is moving in a descending channel on the 1-hour timeframe. It has reached the lower boundary and is heading towards breaking above it, with a retest of the upper boundary expected. We have a downtrend on the RSI indicator, which has reached near the lower boundary, and an upward rebound is expected. There is a key support zone in green at 0.08455. The price has bounced from this level multiple times and is expected to bounce again. We have a trend towards consolidation above the 100-period moving average, as we are moving close to it, which supports the upward movement. Entry price: 0.08777 First target: 0.08940 Second target: 0.09366 Third target: 0.09860 Don't forget a simple principle: money management. Place your stop-loss order below the green support zone. For any questions, please leave a comment. Thank you.#DYM First target: 0.08940 Reached Second target: 0.09366 Reached
CryptoAnalystSignal
فرصت خرید DYM/USDT: ورود به موقع در کف کانال نزولی (تحلیل و سیگنال خرید)
#DYM The price is moving in a descending channel on the 1-hour timeframe. It has reached the lower boundary and is heading towards breaking above it, with a retest of the upper boundary expected. We have a downtrend on the RSI indicator, which has reached near the lower boundary, and an upward rebound is expected. There is a key support zone in green at 0.08455. The price has bounced from this level multiple times and is expected to bounce again. We have a trend towards consolidation above the 100-period moving average, as we are moving close to it, which supports the upward movement. Entry price: 0.08777 First target: 0.08940 Second target: 0.09366 Third target: 0.09860 Don't forget a simple principle: money management. Place your stop-loss order below the green support zone. For any questions, please leave a comment. Thank you.#DYM First target: 0.08940 Reached Second target: 0.09366 Reached
Disclaimer
Any content and materials included in Sahmeto's website and official communication channels are a compilation of personal opinions and analyses and are not binding. They do not constitute any recommendation for buying, selling, entering or exiting the stock market and cryptocurrency market. Also, all news and analyses included in the website and channels are merely republished information from official and unofficial domestic and foreign sources, and it is obvious that users of the said content are responsible for following up and ensuring the authenticity and accuracy of the materials. Therefore, while disclaiming responsibility, it is declared that the responsibility for any decision-making, action, and potential profit and loss in the capital market and cryptocurrency market lies with the trader.