
DUSK
Dusk Network
| تریدر | نوع سیگنال | حد سود/ضرر | زمان انتشار | مشاهده پیام |
|---|---|---|---|---|
No results found. | ||||
Price Chart of Dusk Network
سود 3 Months :
سیگنالهای Dusk Network
Filter
Sort messages by
Trader Type
Time Frame
Disk için mini ralli

The price maintains its rising trend structure. In the short term, the red zone can act as a liquidity/supply area. If persistence above this region is achieved, the target is the upper trend line (≈0.070 – 0.072). In the opposite scenario, pullback should be followed after zone rejection. Risk management should not be neglected.

iMoneyTeam
DUSK Buy/Long Signal (4H)
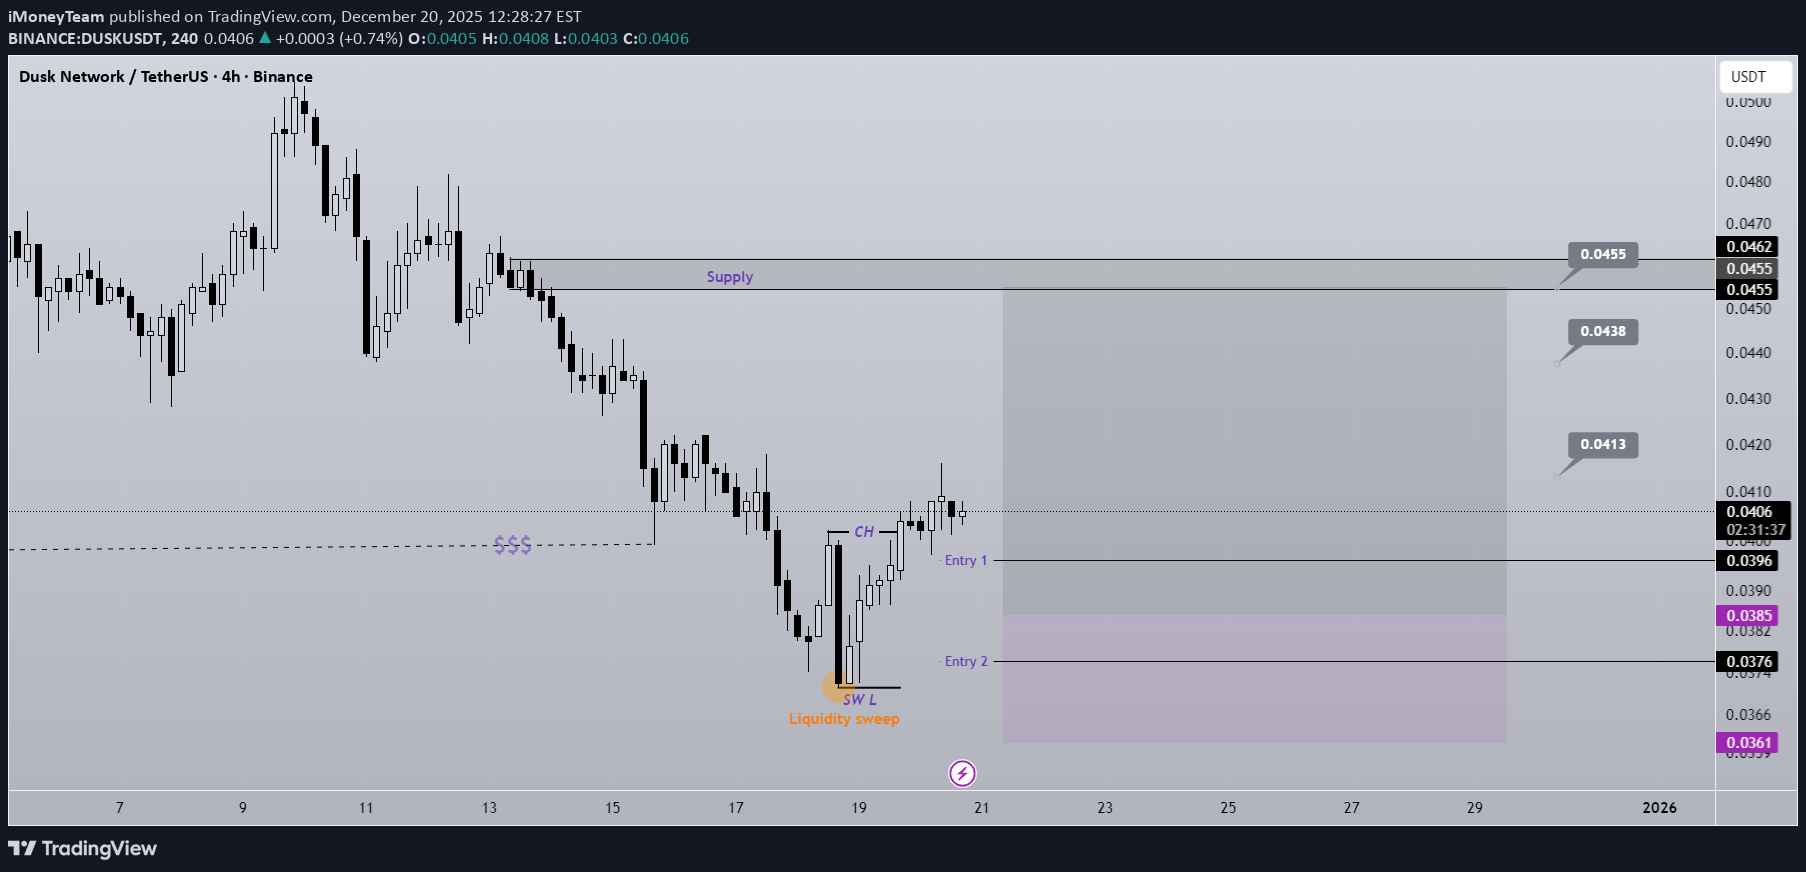
Considering the liquidity sweep at the bottom, followed by the formation of a large bearish candle and then its engulfment with the formation of a bullish CH, we can look for buy/long positions on the pullback to the support zones. We have marked two entry points on the chart, which should be entered using DCA. The targets are also marked on the chart. Do not enter the position without capital management and stop setting Comment if you have any questions thank youAfter hitting the first entry point the price pumped more than 11% and reached the first target.

VIPCryptoVault
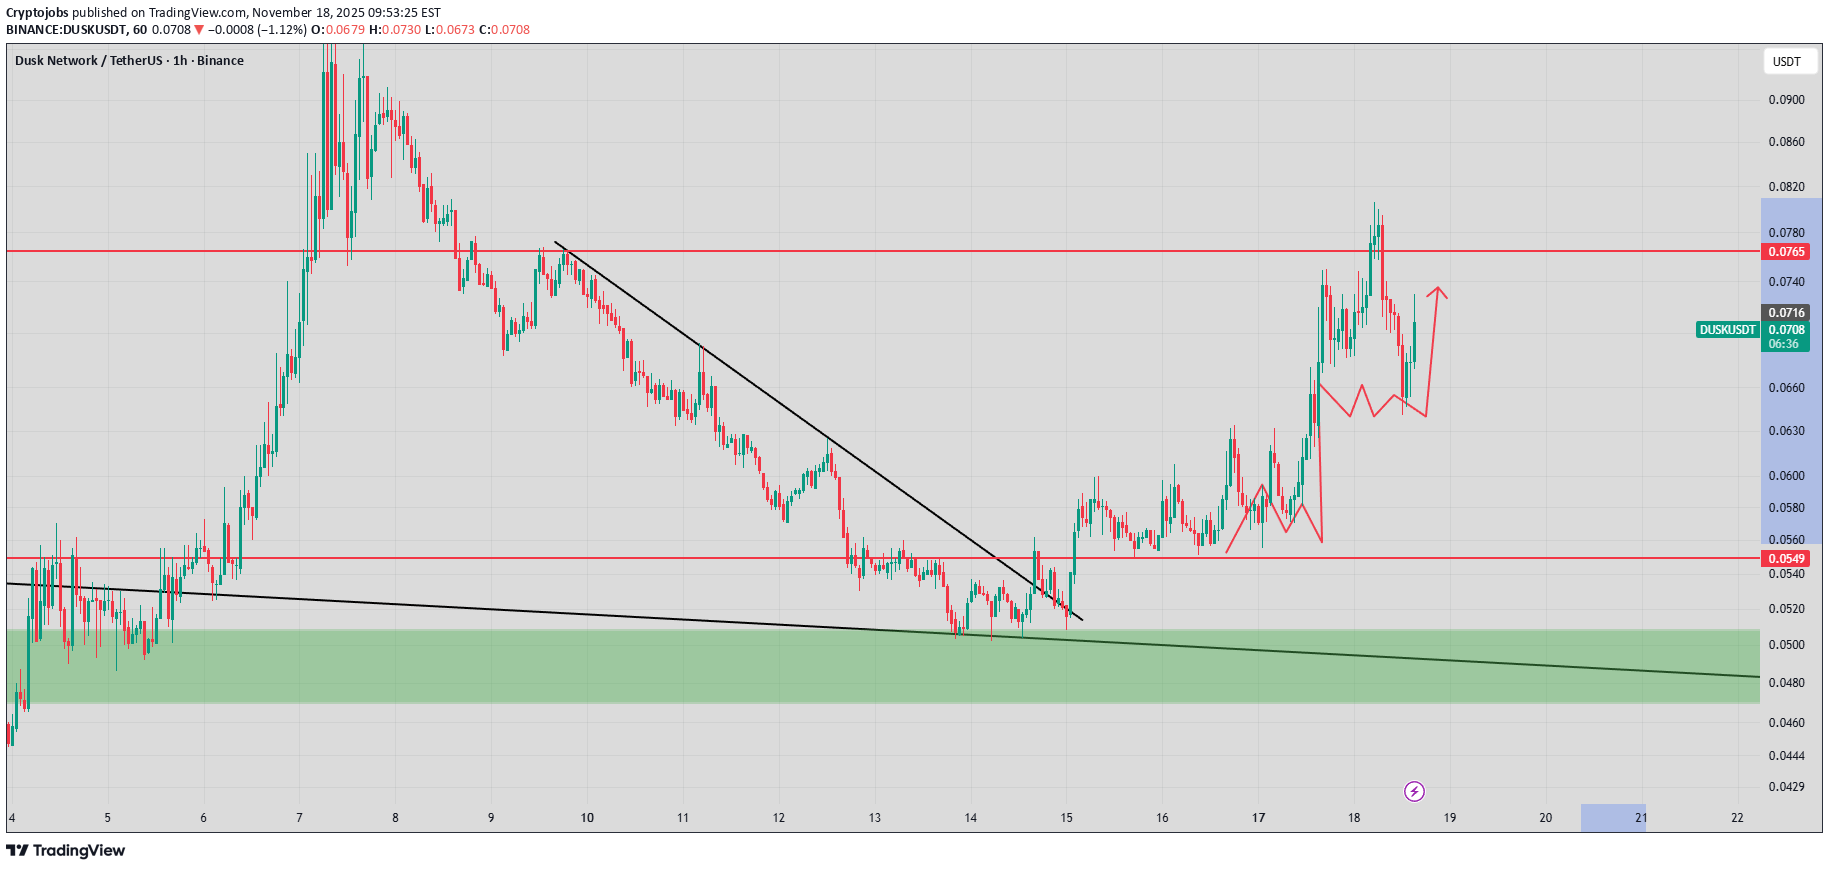
DUSK/USDT در آستانه انفجار؟ تحلیل سطوح حمایت و اهداف صعودی جدید

Price is holding a support zone (≈ 0.043–0.046) after a long downtrend and a prior fakeout. We’re in a consolidation box. Bullish edge if this range holds or price breaks up. Targets $0.0503 $0.0528 $0.0554 Stop-loss: 0.0422 Good Luck!Only 2 sats diff from first TP. I locked in some profit here and have my trailing stop

Cryptojobs
Cryptojobs


BandForBands
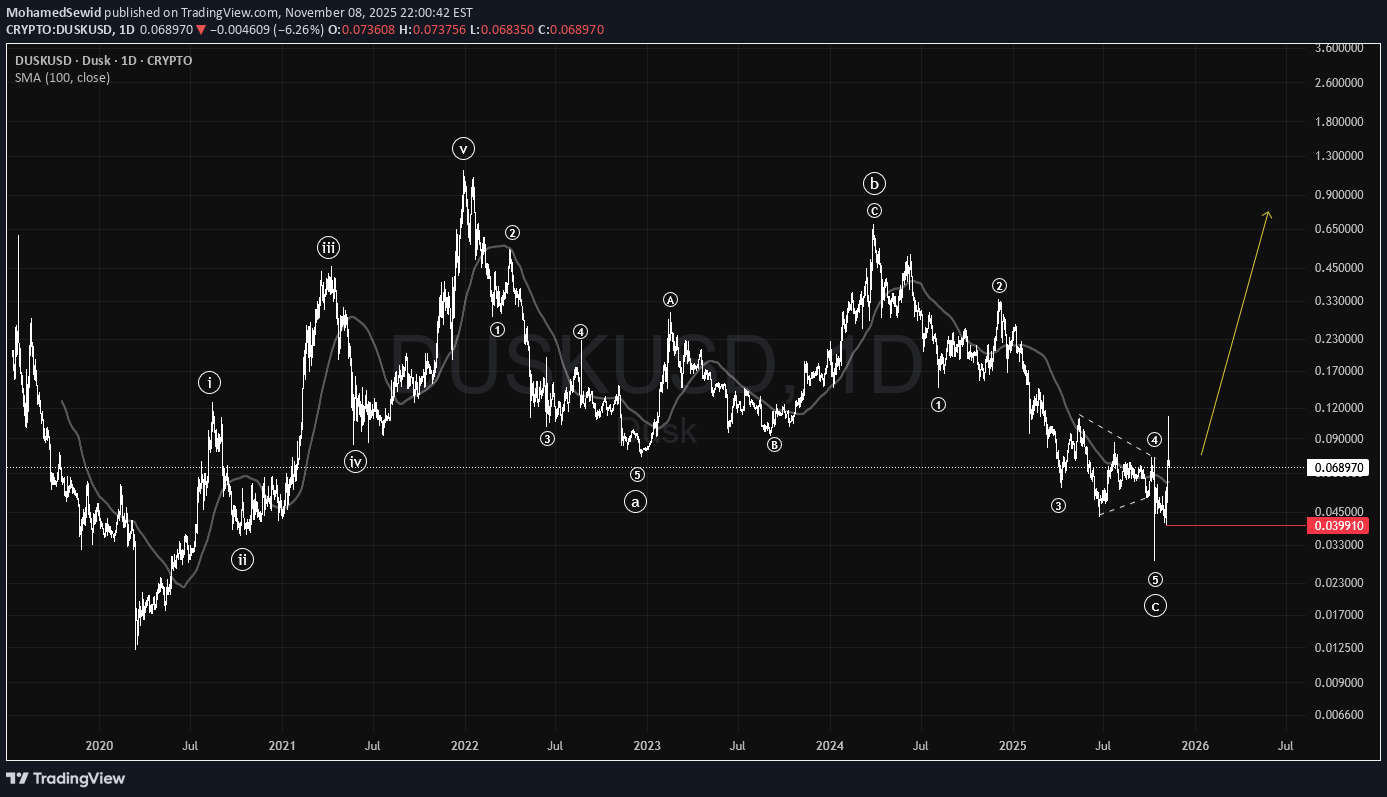
DUSK: آیا کف قیمت شکسته شد؟ شانس سود 300 درصدی در انتظار است!

DUSK looks like it has bottomed and the risk to reward from here is very good. From the current level, there’s a potential 300 percent gain to be made once momentum kicks in and the structure starts to expand.

MohamedSewid
DUSK به نقطه عطف رسید: آیا قیمت به سقف جدید میرسد؟ (تحلیل تکنیکال)
#DUSK has completed a historical 1–2 pattern, indicating a bullish outlook for the future ahead. As long as it holds above the $0.04 support level, it shows potential for high targets.

CryptoAnalystSignal
تحلیل قیمت DUSK/USDT: آیا آماده انفجار قیمتی از الگوی گوه نزولی است؟
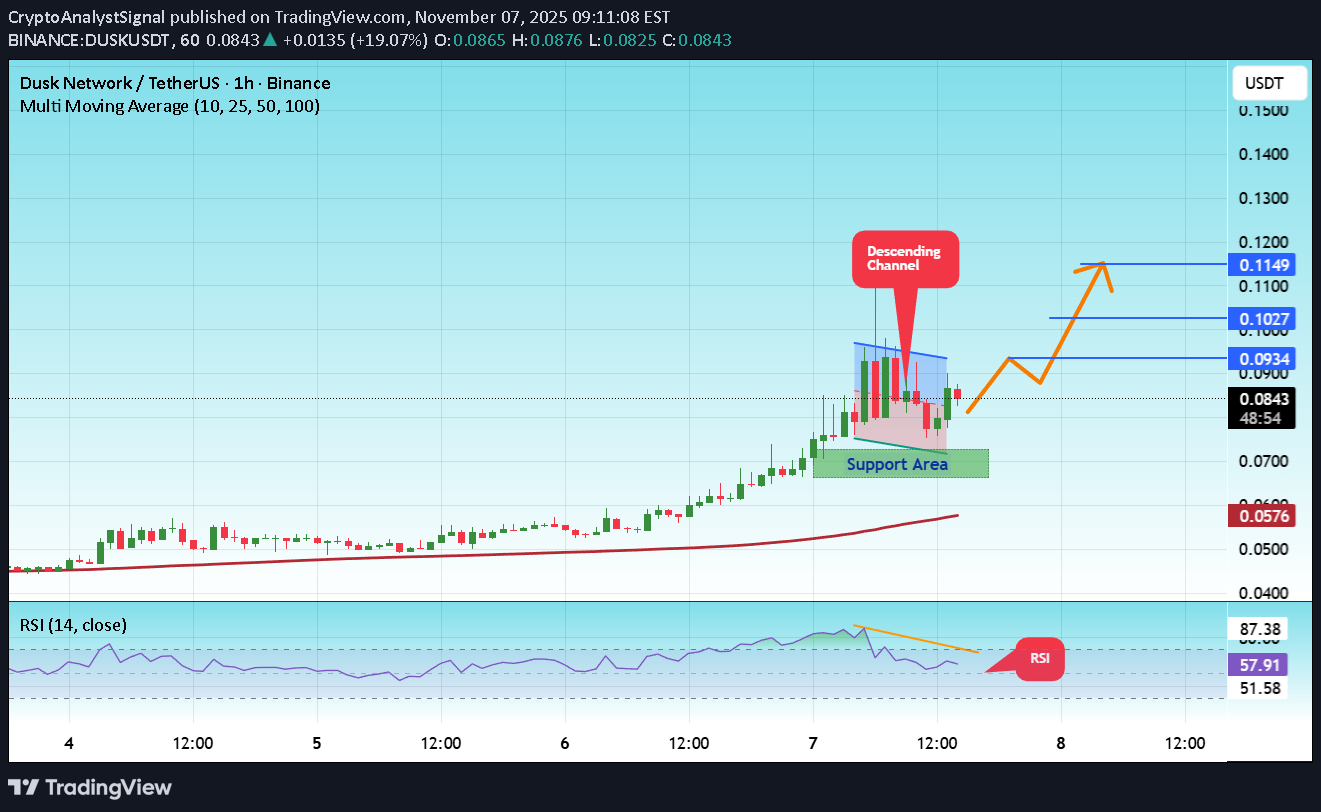
#DUSK The price is moving in a descending channel on the 1-hour timeframe and is expected to break out and continue upwards. We have a trend to stabilize above the 100-period moving average again. We have a downtrend on the RSI indicator, which supports an upward move if it breaks above it. We have a key support zone in green that pushed the price higher at 0.0700. Entry price: 0.0823 First target: 0.0934 Second target: 0.1027 Third target: 0.1150 For risk management, don't forget your stop-loss and capital management. The stop-loss is below the support zone in green. Upon reaching the first target, take some profits and then change your stop-loss order to an entry order. For any questions, please comment. Thank you.

Alpha-GoldFX
سیگنال انفجار بزرگ DUSKUSDT: راز الگوی گوه نزولی و جهش قیمتی ۹۰ درصدی!
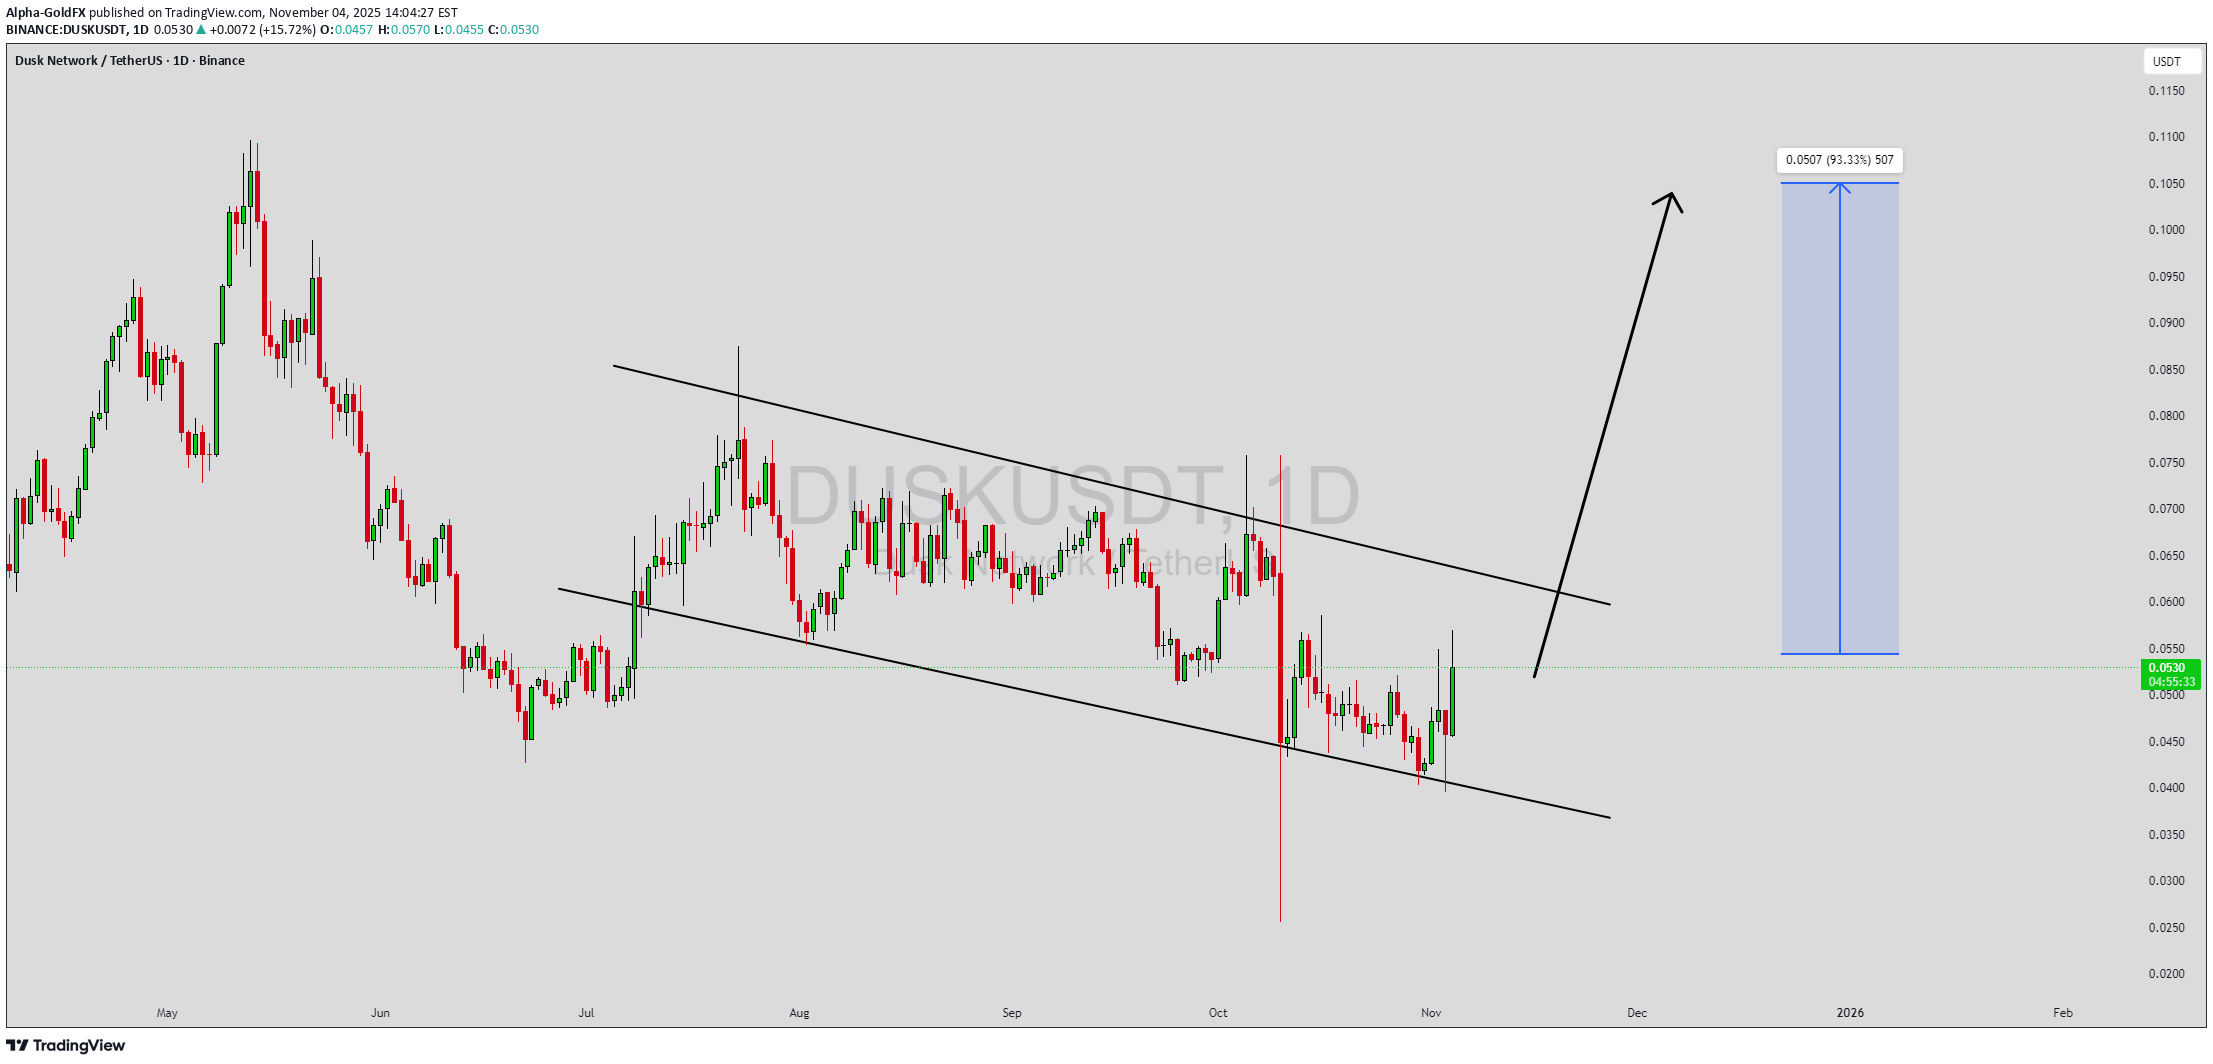
DUSKUSDT is showing a strong technical setup as it forms a classic falling wedge pattern, a bullish reversal signal that often precedes major upward price movements. The price has been consolidating within this narrowing structure, indicating a gradual slowdown in bearish momentum and increasing accumulation by buyers. With good volume supporting recent candles, market sentiment appears to be shifting in favor of the bulls, suggesting a possible breakout that could drive prices up by 80% to 90% in the coming sessions. The falling wedge pattern indicates that sellers are losing control as the price compresses closer to the wedge’s apex. Once a breakout occurs above the upper resistance line, it typically triggers a sharp move to the upside, backed by renewed buying interest. DUSK’s volume profile shows consistent activity, reflecting growing confidence among investors who are anticipating a reversal and a fresh bullish wave. Investor attention around DUSKUSDT has been increasing, as the project continues to show resilience and strong technical positioning. The current market structure offers traders an attractive risk-to-reward ratio, particularly for those looking to capture early momentum from the potential breakout. As accumulation continues, a bullish move could soon unfold, validating the wedge formation and driving a sustained upward trend. ✅ Show your support by hitting the like button and ✅ Leaving a comment below! (What is You opinion about this Coin) Your feedback and engagement keep me inspired to share more insightful market analysis with you!

Bithereum_io
تحلیل DUSK: آیا این ارز با شکستن الگوی گوه سقوطی، آماده پرش به اهداف جدید است؟

#DUSK is currently trading within a falling wedge pattern on the daily chart. In case of a breakout above the wedge resistance and the daily EMA100, the potential upside targets are: 🎯 $0.0665 🎯 $0.0741 🎯 $0.0817 🎯 $0.0925 🎯 $0.1063 ⚠️ Always remember to use a tight stop-loss and maintain proper risk management.
Disclaimer
Any content and materials included in Sahmeto's website and official communication channels are a compilation of personal opinions and analyses and are not binding. They do not constitute any recommendation for buying, selling, entering or exiting the stock market and cryptocurrency market. Also, all news and analyses included in the website and channels are merely republished information from official and unofficial domestic and foreign sources, and it is obvious that users of the said content are responsible for following up and ensuring the authenticity and accuracy of the materials. Therefore, while disclaiming responsibility, it is declared that the responsibility for any decision-making, action, and potential profit and loss in the capital market and cryptocurrency market lies with the trader.