
COW
CoW Protocol
| تریدر | نوع سیگنال | حد سود/ضرر | زمان انتشار | مشاهده پیام |
|---|---|---|---|---|
No results found. | ||||
Price Chart of CoW Protocol
سود 3 Months :
سیگنالهای CoW Protocol
Filter
Sort messages by
Trader Type
Time Frame

focus1691
فروکش کردن فشار فروش؛ آیا COWUSDT آماده جهش بزرگ است؟

Selling pressure is drying up after the big dip. COW looks poised to break out of a small channel forming

Alpha-GoldFX
COWUSDT Forming Falling Wedge
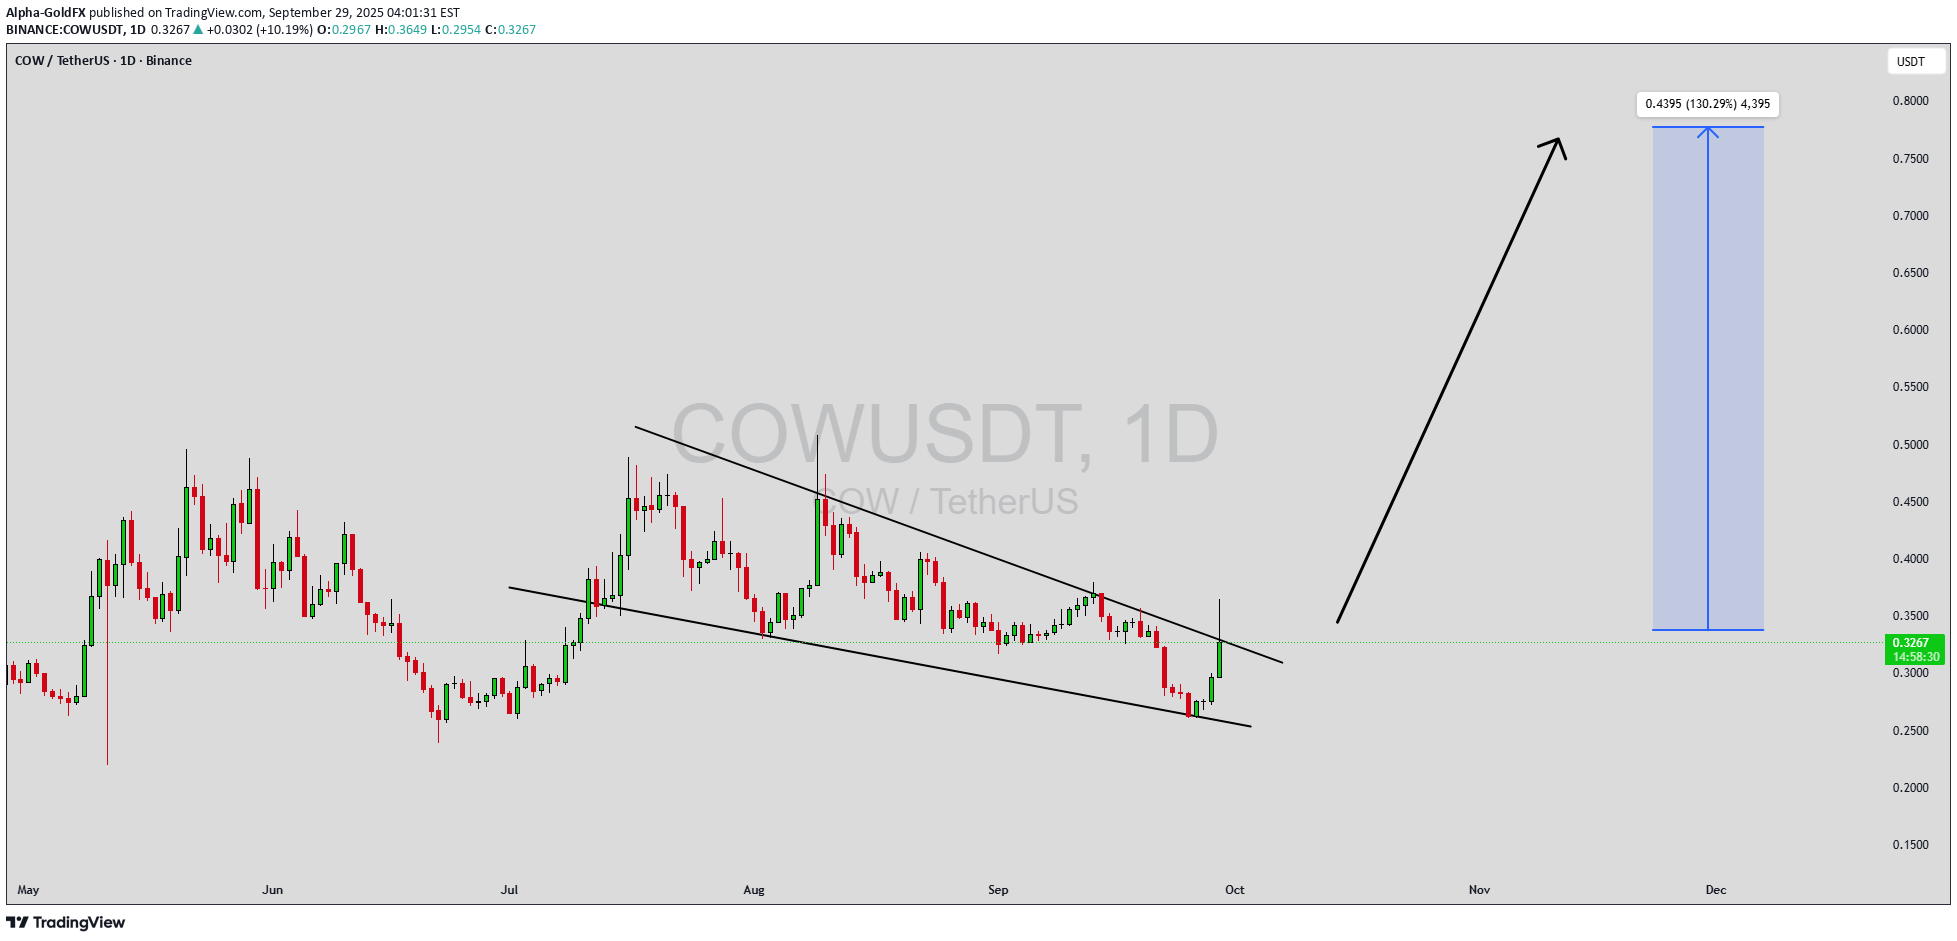
COWUSDT is currently forming a falling wedge pattern, a strong bullish reversal setup that often precedes significant upward movements. The price action is consolidating within a narrowing range, which typically signals that momentum is building for a potential breakout. With good trading volume accompanying this structure, the chances of a powerful bullish move are greatly increasing. Based on this setup, the expected gain could range between 90% to 100%+ once the breakout is confirmed. The falling wedge pattern suggests that selling pressure is weakening while buying interest is gradually increasing. This kind of technical structure often results in sharp rallies as market sentiment shifts in favor of the bulls. Traders closely watching COWUSDT will likely see key resistance levels tested soon, and a breakout could trigger a strong wave of buying activity. Investors are also showing growing interest in this project, which adds further strength to the bullish outlook. Increased market participation, combined with the strong technical setup, makes COWUSDT an attractive candidate for significant upside potential. As long as volume continues to support the move, this pair could be preparing for a major trend reversal. ✅ Show your support by hitting the like button and ✅ Leaving a comment below! (What is You opinion about this Coin) Your feedback and engagement keep me inspired to share more insightful market analysis with you!

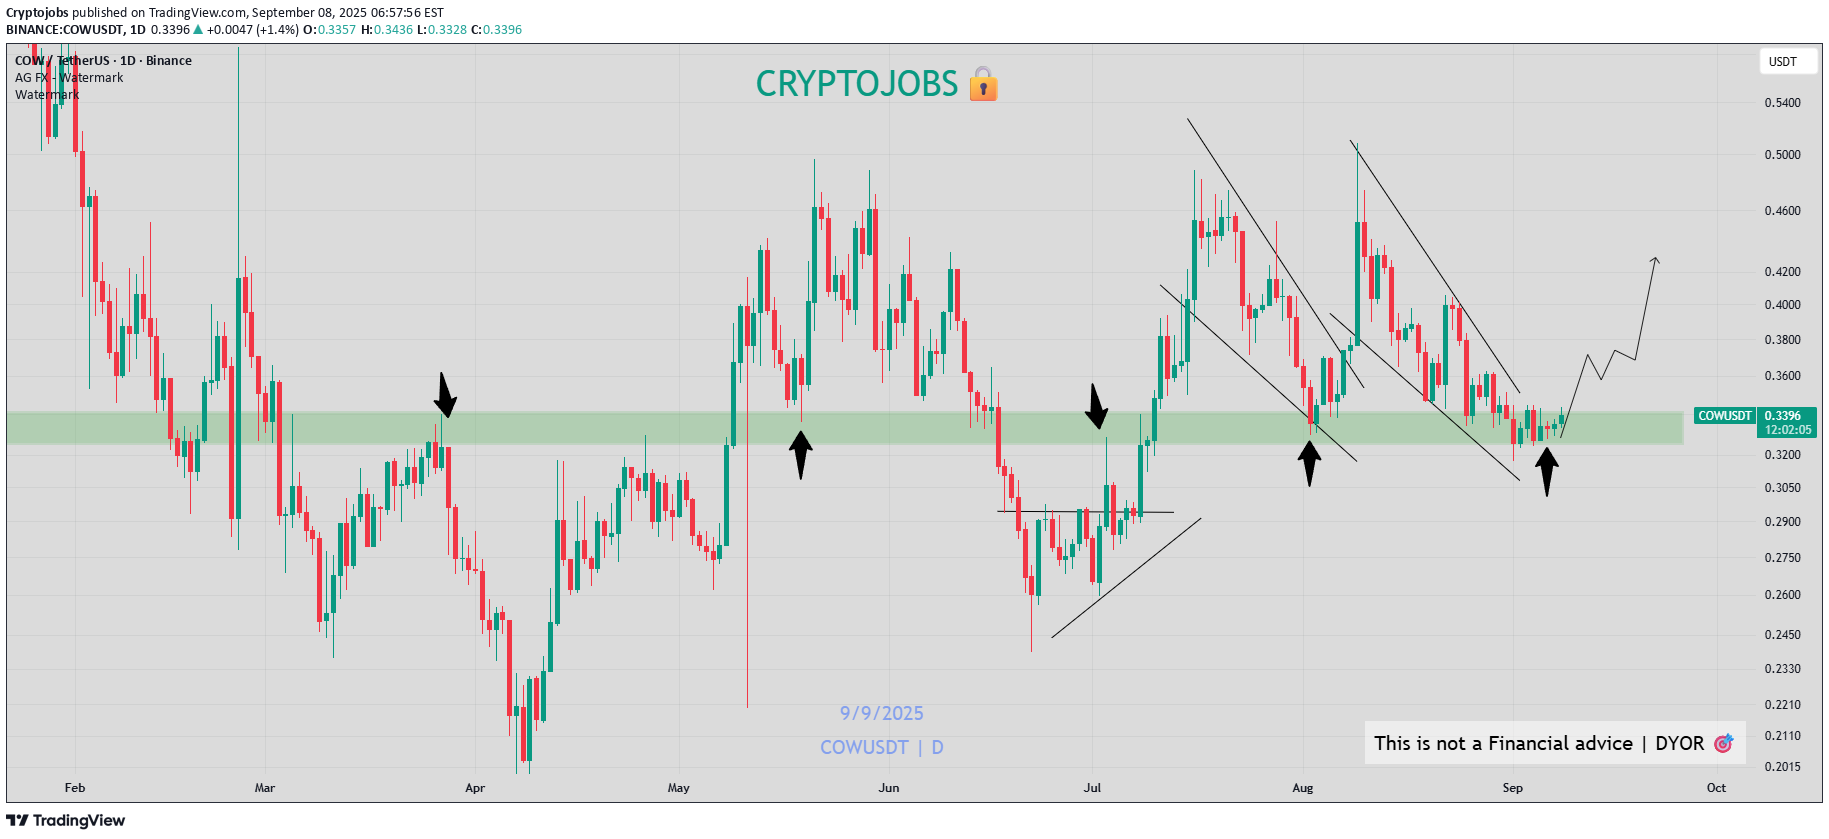
Cryptojobs
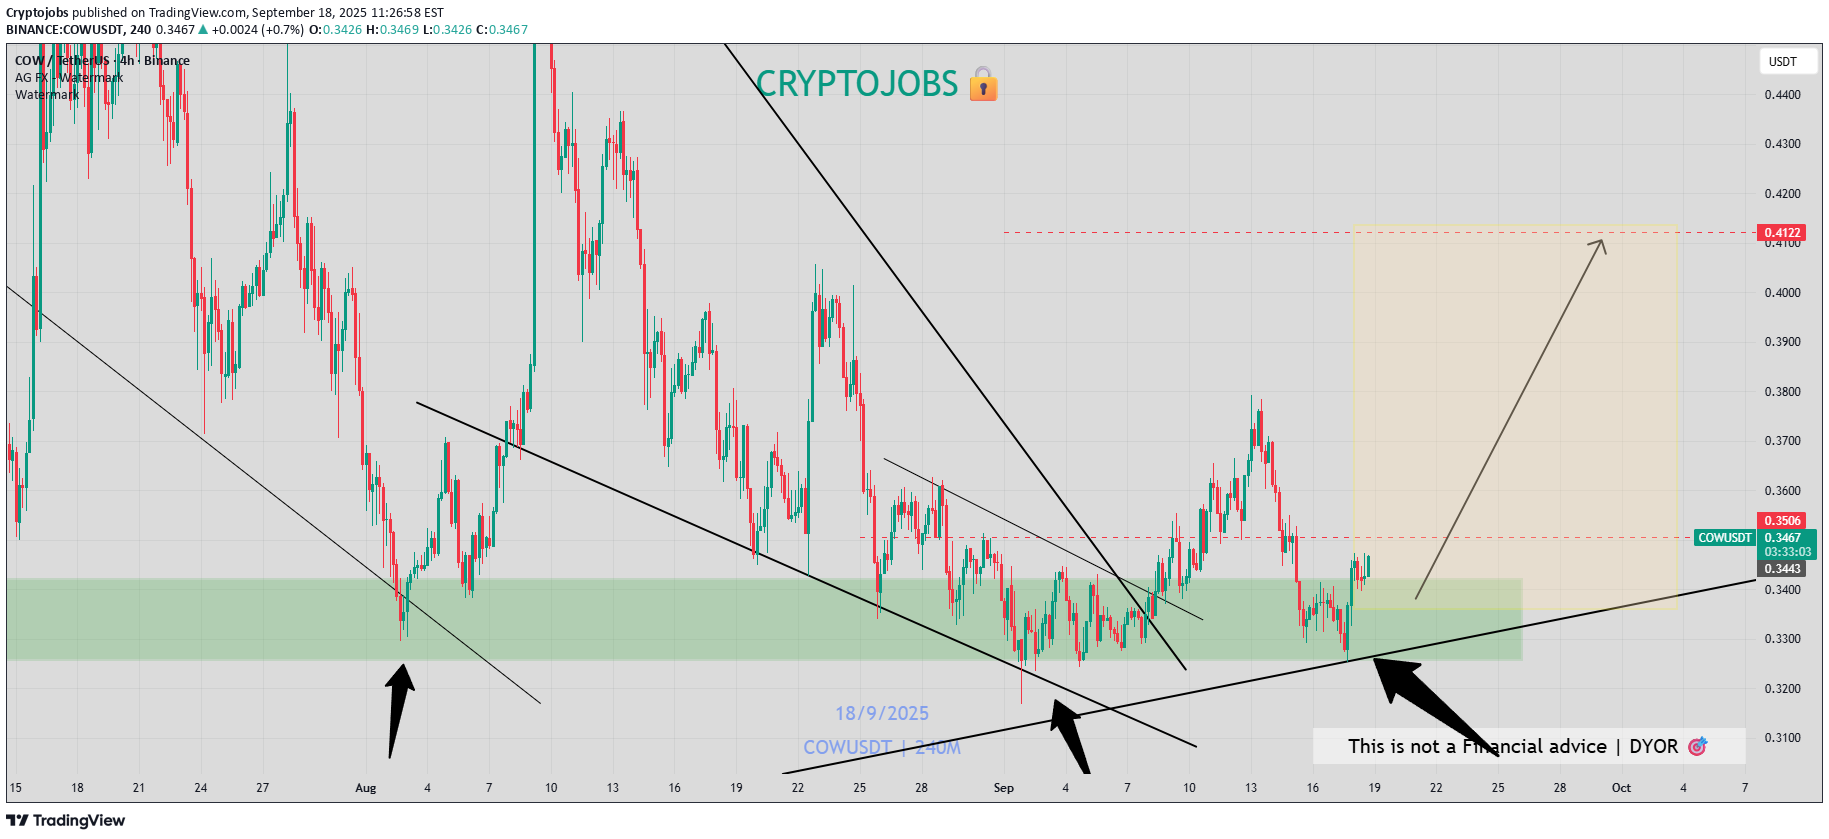
Long term demand zone is holding nicely on $COW
Cryptojobs
Cryptojobs
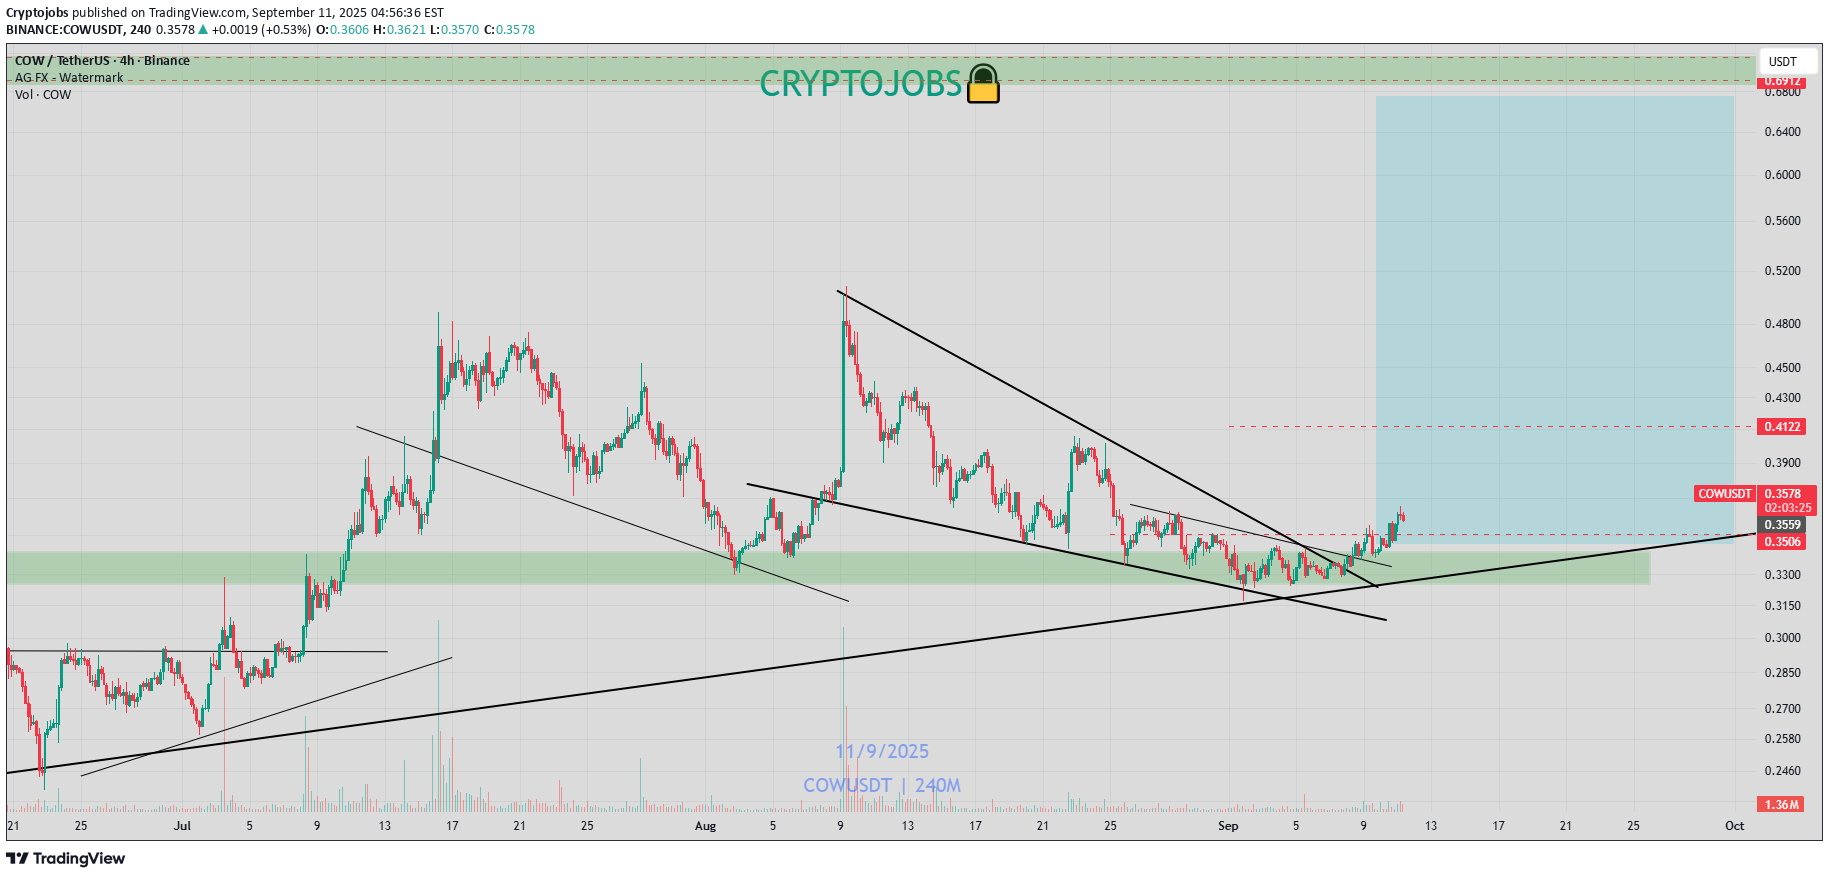
COW - TP2 HIT
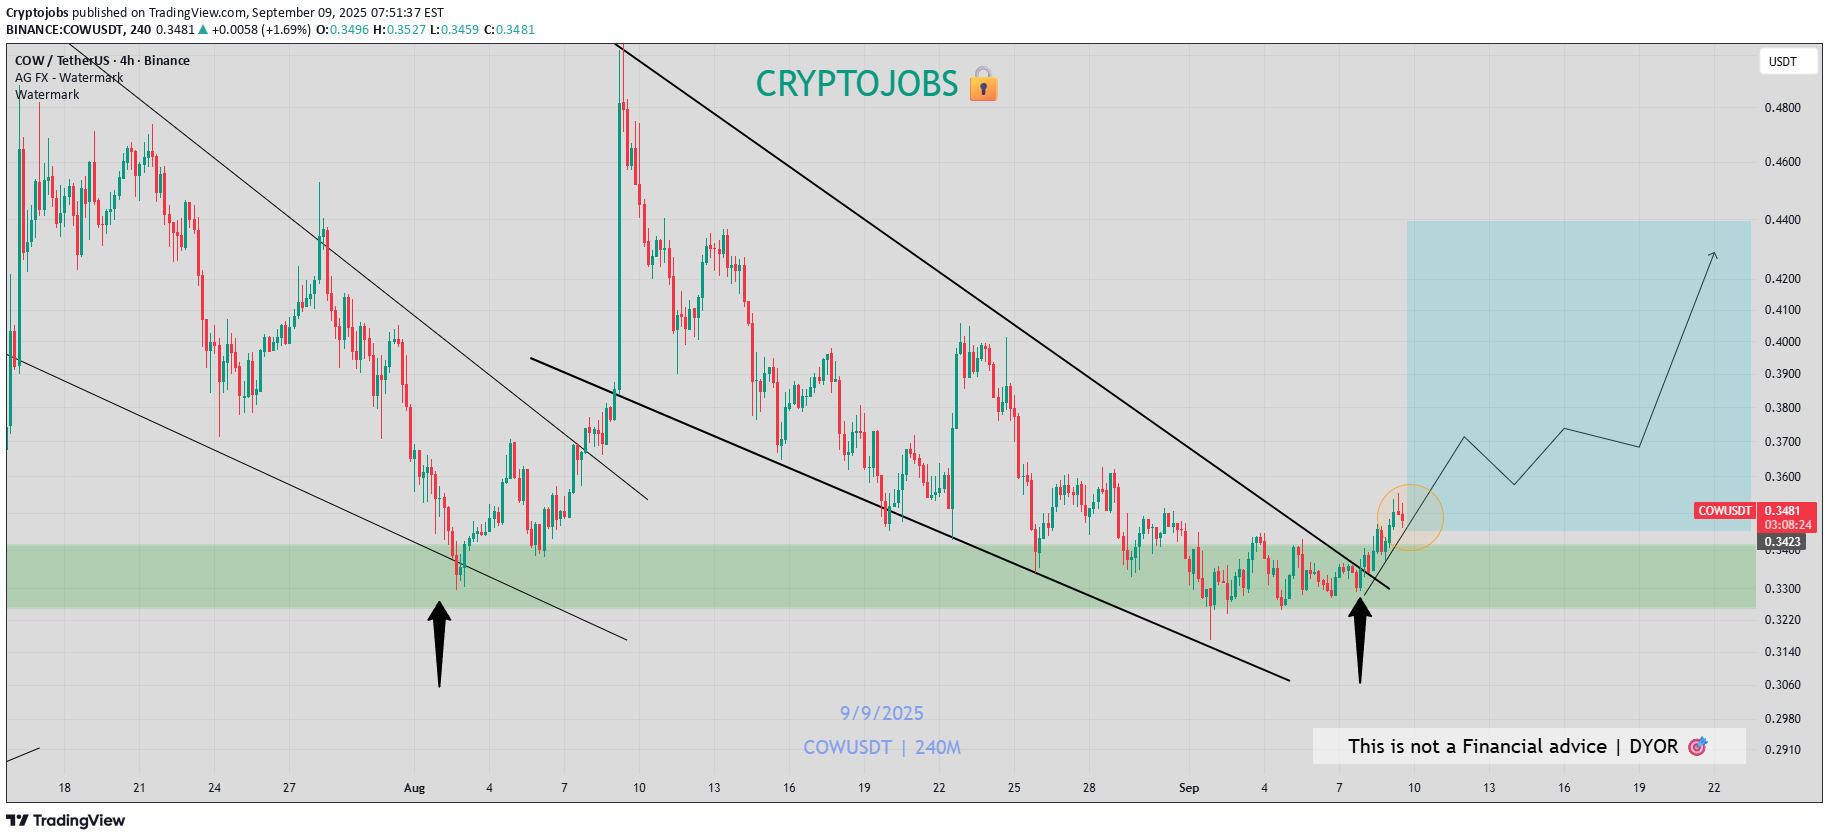
COW - TP2 ✅ Clean falling wedge H4 breakout & retest ✅📈 We could see a big bull impulse similar as [TA]🚀
Cryptojobs

Bithereum_io
COWUSDT 1D

#COW has formed an ascending triangle on the daily timeframe. Consider buying at the current price and near the support level of $0.3931. In case of a breakout above the triangle resistance, the potential targets are: 🎯 $0.5616 🎯 $0.6758 🎯 $0.7901 🎯 $0.9528 ⚠️ As always, use a tight stop-loss and apply proper risk management.
Alpha-GoldFX
COWUSDT Forming Bullish Wave

COWUSDT is forming a bullish wave pattern, signaling strong upward potential supported by healthy market structure. This pattern often emerges when a crypto asset experiences impulsive rallies followed by corrective pullbacks, creating a wave-like movement that reflects sustained buying pressure. In this case, COWUSDT’s price action suggests the possibility of another strong upward leg as the trend continues to build momentum. The volume remains consistently good, indicating active participation from traders and growing attention from investors. A bullish wave pattern backed by solid volume is often a sign of institutional interest and strong market conviction. If the current trend holds and breaks above the next key resistance zone, the pair could deliver 80% to 90%+ gains in the near to mid-term. Market sentiment is leaning bullish, with technical indicators aligning in favor of continued upward momentum. Traders may look for confirmation in the form of a breakout above recent highs, which could trigger accelerated buying and push prices toward new targets. This setup positions COWUSDT as an attractive opportunity for trend-followers and swing traders alike. ✅ Show your support by hitting the like button and ✅ Leaving a comment below! (What is You opinion about this Coin) Your feedback and engagement keep me inspired to share more insightful market analysis with you!

MoonTradingForecast
Buy Trade Strategy for COW: Backing MEV-Protected DEX Evolution

Description: This trading idea is centered on COW, the native token powering the CoW Protocol, a decentralized exchange (DEX) that uniquely focuses on protecting users from MEV (Maximal Extractable Value) attacks. COW enables a batch auction mechanism that matches orders peer-to-peer before accessing traditional liquidity pools, aiming for fairer and more cost-efficient trades. With growing concerns around MEV and gas efficiency in DeFi, CoW Protocol’s innovative architecture positions it as a promising infrastructure player in the decentralized trading space. The COW token supports governance and aligns incentives among users, solvers, and liquidity providers, helping to build a more sustainable and democratic trading environment. As the protocol garners more attention and integration across DeFi tools, demand for COW may rise. That said, crypto markets are volatile, and broader adoption will depend on user trust, regulation, and technical execution. Disclaimer: This idea is shared for educational purposes only and should not be considered financial advice. Investing in cryptocurrencies like COW involves high risk, including the potential loss of all invested capital. Always conduct your own due diligence, understand the associated risks, and consult a licensed financial advisor before making any trading decisions. Past performance does not guarantee future results.

سیگنال آلفا کریپتو
⚜️ $ Cow/USDT 🛒 Purchase range: 0.348 - 0.367 ⚡️ Target: 🎯t1: 0.374 🎯T2: 0.388 🎯t3: 0.417 🎯T4: 0.454 🎯t5: 0.508 🎯T6: 0.617 🔺 Loss limit: 0.290 💵 Suggested Balance: 5 % Capital 🔥 @signal_alpha 🔥
Disclaimer
Any content and materials included in Sahmeto's website and official communication channels are a compilation of personal opinions and analyses and are not binding. They do not constitute any recommendation for buying, selling, entering or exiting the stock market and cryptocurrency market. Also, all news and analyses included in the website and channels are merely republished information from official and unofficial domestic and foreign sources, and it is obvious that users of the said content are responsible for following up and ensuring the authenticity and accuracy of the materials. Therefore, while disclaiming responsibility, it is declared that the responsibility for any decision-making, action, and potential profit and loss in the capital market and cryptocurrency market lies with the trader.