
CHR
Chromia
| تریدر | نوع سیگنال | حد سود/ضرر | زمان انتشار | مشاهده پیام |
|---|---|---|---|---|
No results found. | ||||
Price Chart of Chromia
سود 3 Months :
سیگنالهای Chromia
Filter
Sort messages by
Trader Type
Time Frame

CryptoAnalystSignal
#CHR/USDT READY TO NEW EXPLODE !
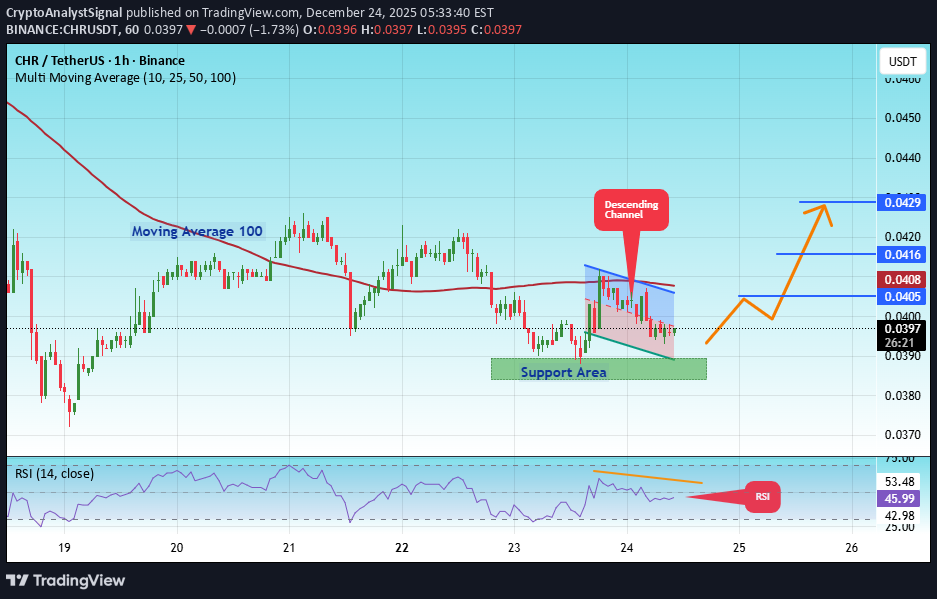
#CHR The price is moving in a descending channel on the 1-hour timeframe. It has reached the lower boundary and is heading towards breaking above it, with a retest of the upper boundary expected. We have a downtrend on the RSI indicator, which has reached near the lower boundary, and an upward rebound is expected. There is a key support zone in green at 0.0387. The price has bounced from this level multiple times and is expected to bounce again. We have a trend towards consolidation above the 100-period moving average, as we are moving close to it, which supports the upward movement. Entry price: 0.0397 First target: 0.0405 Second target: 0.0416 Third target: 0.0429 Don't forget a simple principle: money management. Place your stop-loss order below the support zone in green. For any questions, please leave a comment. Thank you.#CHR First target: 0.0405 Reached#CHR First target: 0.0405 Reached Second target: 0.0416 Reached
CryptoAnalystSignal
فرصت خرید طلایی CHR/USDT: آماده جهش از کف حمایتی!
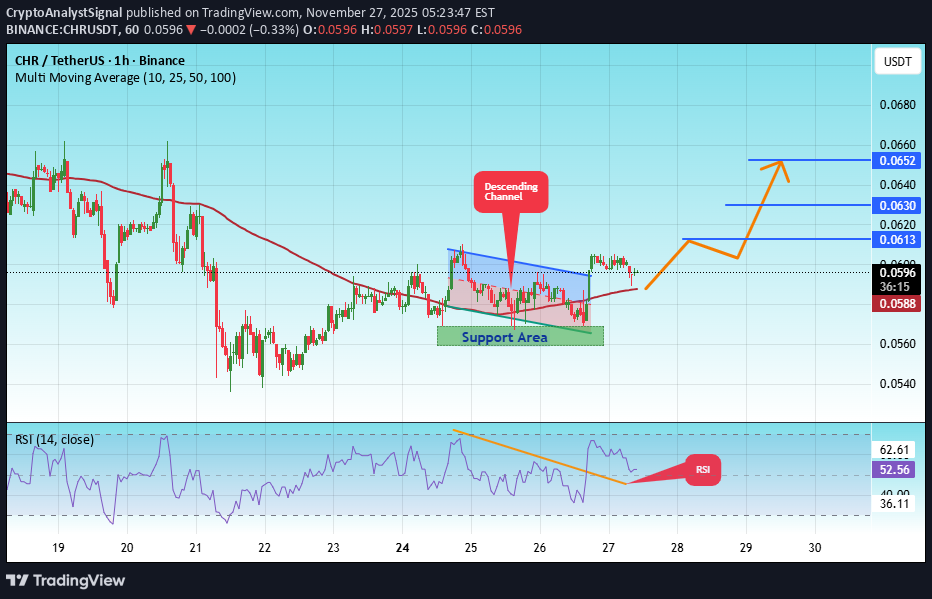
#CHR The price is moving in a descending channel on the 1-hour timeframe. It has reached the lower boundary and is heading towards breaking above it, with a retest of the upper boundary expected. We have a downtrend on the RSI indicator, which has reached near the lower boundary, and an upward rebound is expected. There is a key support zone in green at 0.0564. The price has bounced from this level multiple times and is expected to bounce again. We have a trend towards consolidation above the 100-period moving average, as we are moving close to it, which supports the upward movement. Entry price: 0.0596 First target: 0.0613 Second target: 0.0630 Third target: 0.0652 Don't forget a simple principle: money management. Place your stop-loss order below the support zone in green. For any questions, please leave a comment. Thank you.

MohamedSewid
احیای قدرتمند کرومیا (CHR): آیا سقفهای تاریخی در انتظار است؟
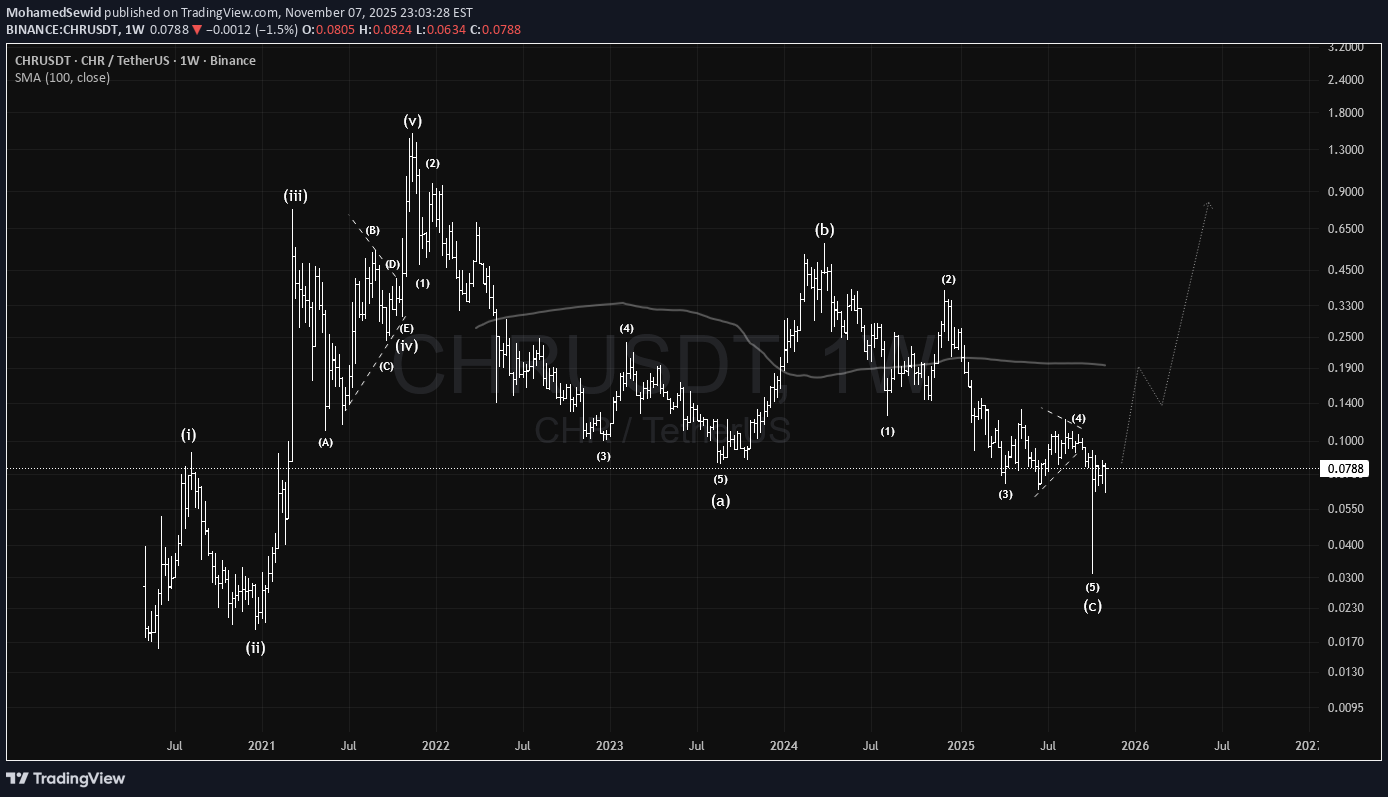
#CHR is showing strong recovery potential after the 2025 bear market. Completing a historical bullish 1–2 wave pattern, it's showing a promising mid to long-term bullish cycle outlook. Eventually it could target new all time highs in the most optimistic scenario. #Chromia
CryptoAnalystSignal
فرصت خرید طلایی: تحلیل تکنیکال CHR/USDT با اهداف صعودی مشخص!
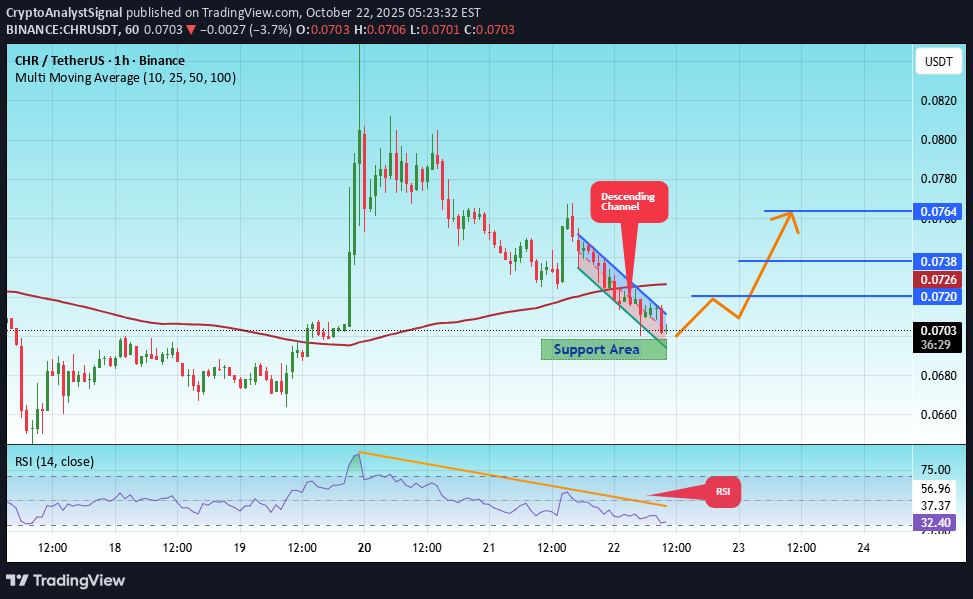
#CHR The price is moving within a descending channel on the 1-hour frame, adhering well to it, and is heading for a strong breakout and retest. We have a bearish trend on the RSI indicator that is about to be broken and retested, which supports the upward breakout. There is a major support area in green at 0.0694, representing a strong support point. We are heading for consolidation above the 100 moving average. Entry price: 0.0706 First target: 0.0720 Second target: 0.0738 Third target: 0.0764 Don't forget a simple matter: capital management. When you reach the first target, save some money and then change your stop-loss order to an entry order. For inquiries, please leave a comment. Thank you.#CHR First target: 0.0720 Reached Second target: 0.0738 Reached#CHR First target: 0.0720 Reached Second target: 0.0738 Reached Third target: 0.0764 Reached

Bithereum_io
سیگنال خرید CHR: آیا این ارز به زودی سقف کانال نزولی را میشکند؟ (حمایت و اهداف کلیدی)

#CHR is trading within a descending channel on the daily chart. Both RSI and MACD have turned bullish. Keep an eye on it and consider buying some #CHR here and near the support level of $0.0797. In case of a breakout above the channel resistance, the potential targets are: 🎯 $0.1158 🎯 $0.1304 🎯 $0.1450 🎯 $0.1657 🎯 $0.1922 ⚠️ Always remember to use a tight stop-loss and maintain proper risk management.

Cryptojobs
تحلیل تکنیکال CHR: پیشبینی موج صعودی قوی ۱۰٪ به بالا!
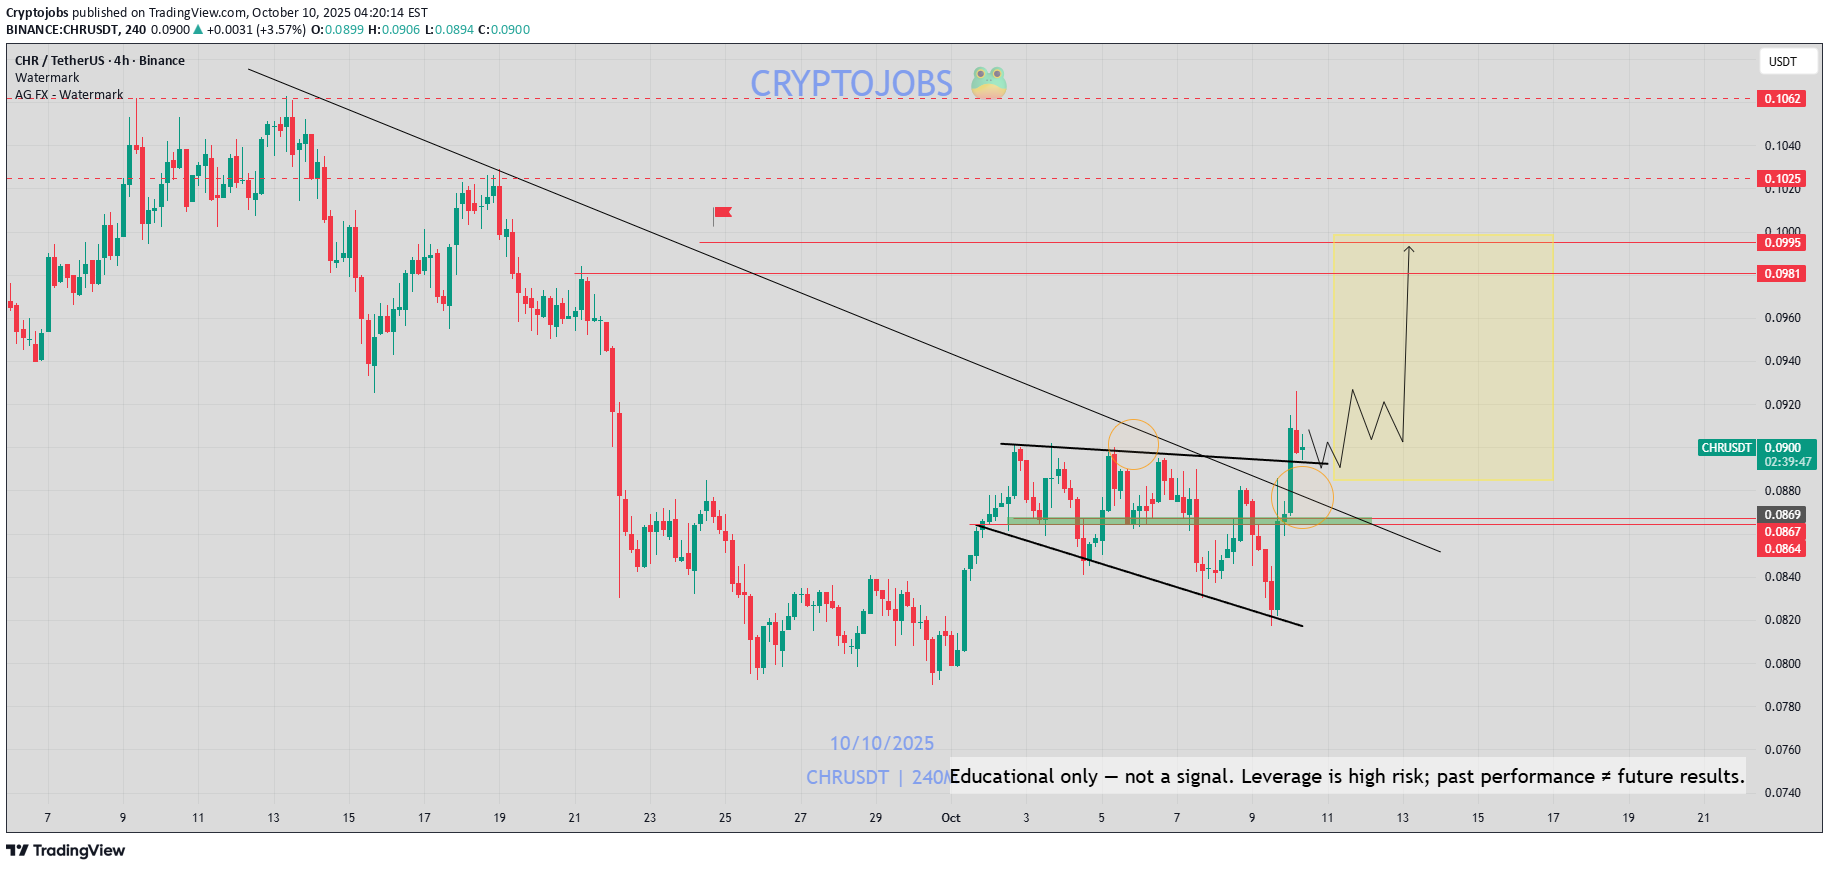
CHR - bullish setup 📈 Clean pattern breakout & retest. H4 chart flipped bullish. I expect to see a 10%+ bull wave from here.

mr_willmedina
CHR / USDT - Almost Ready!
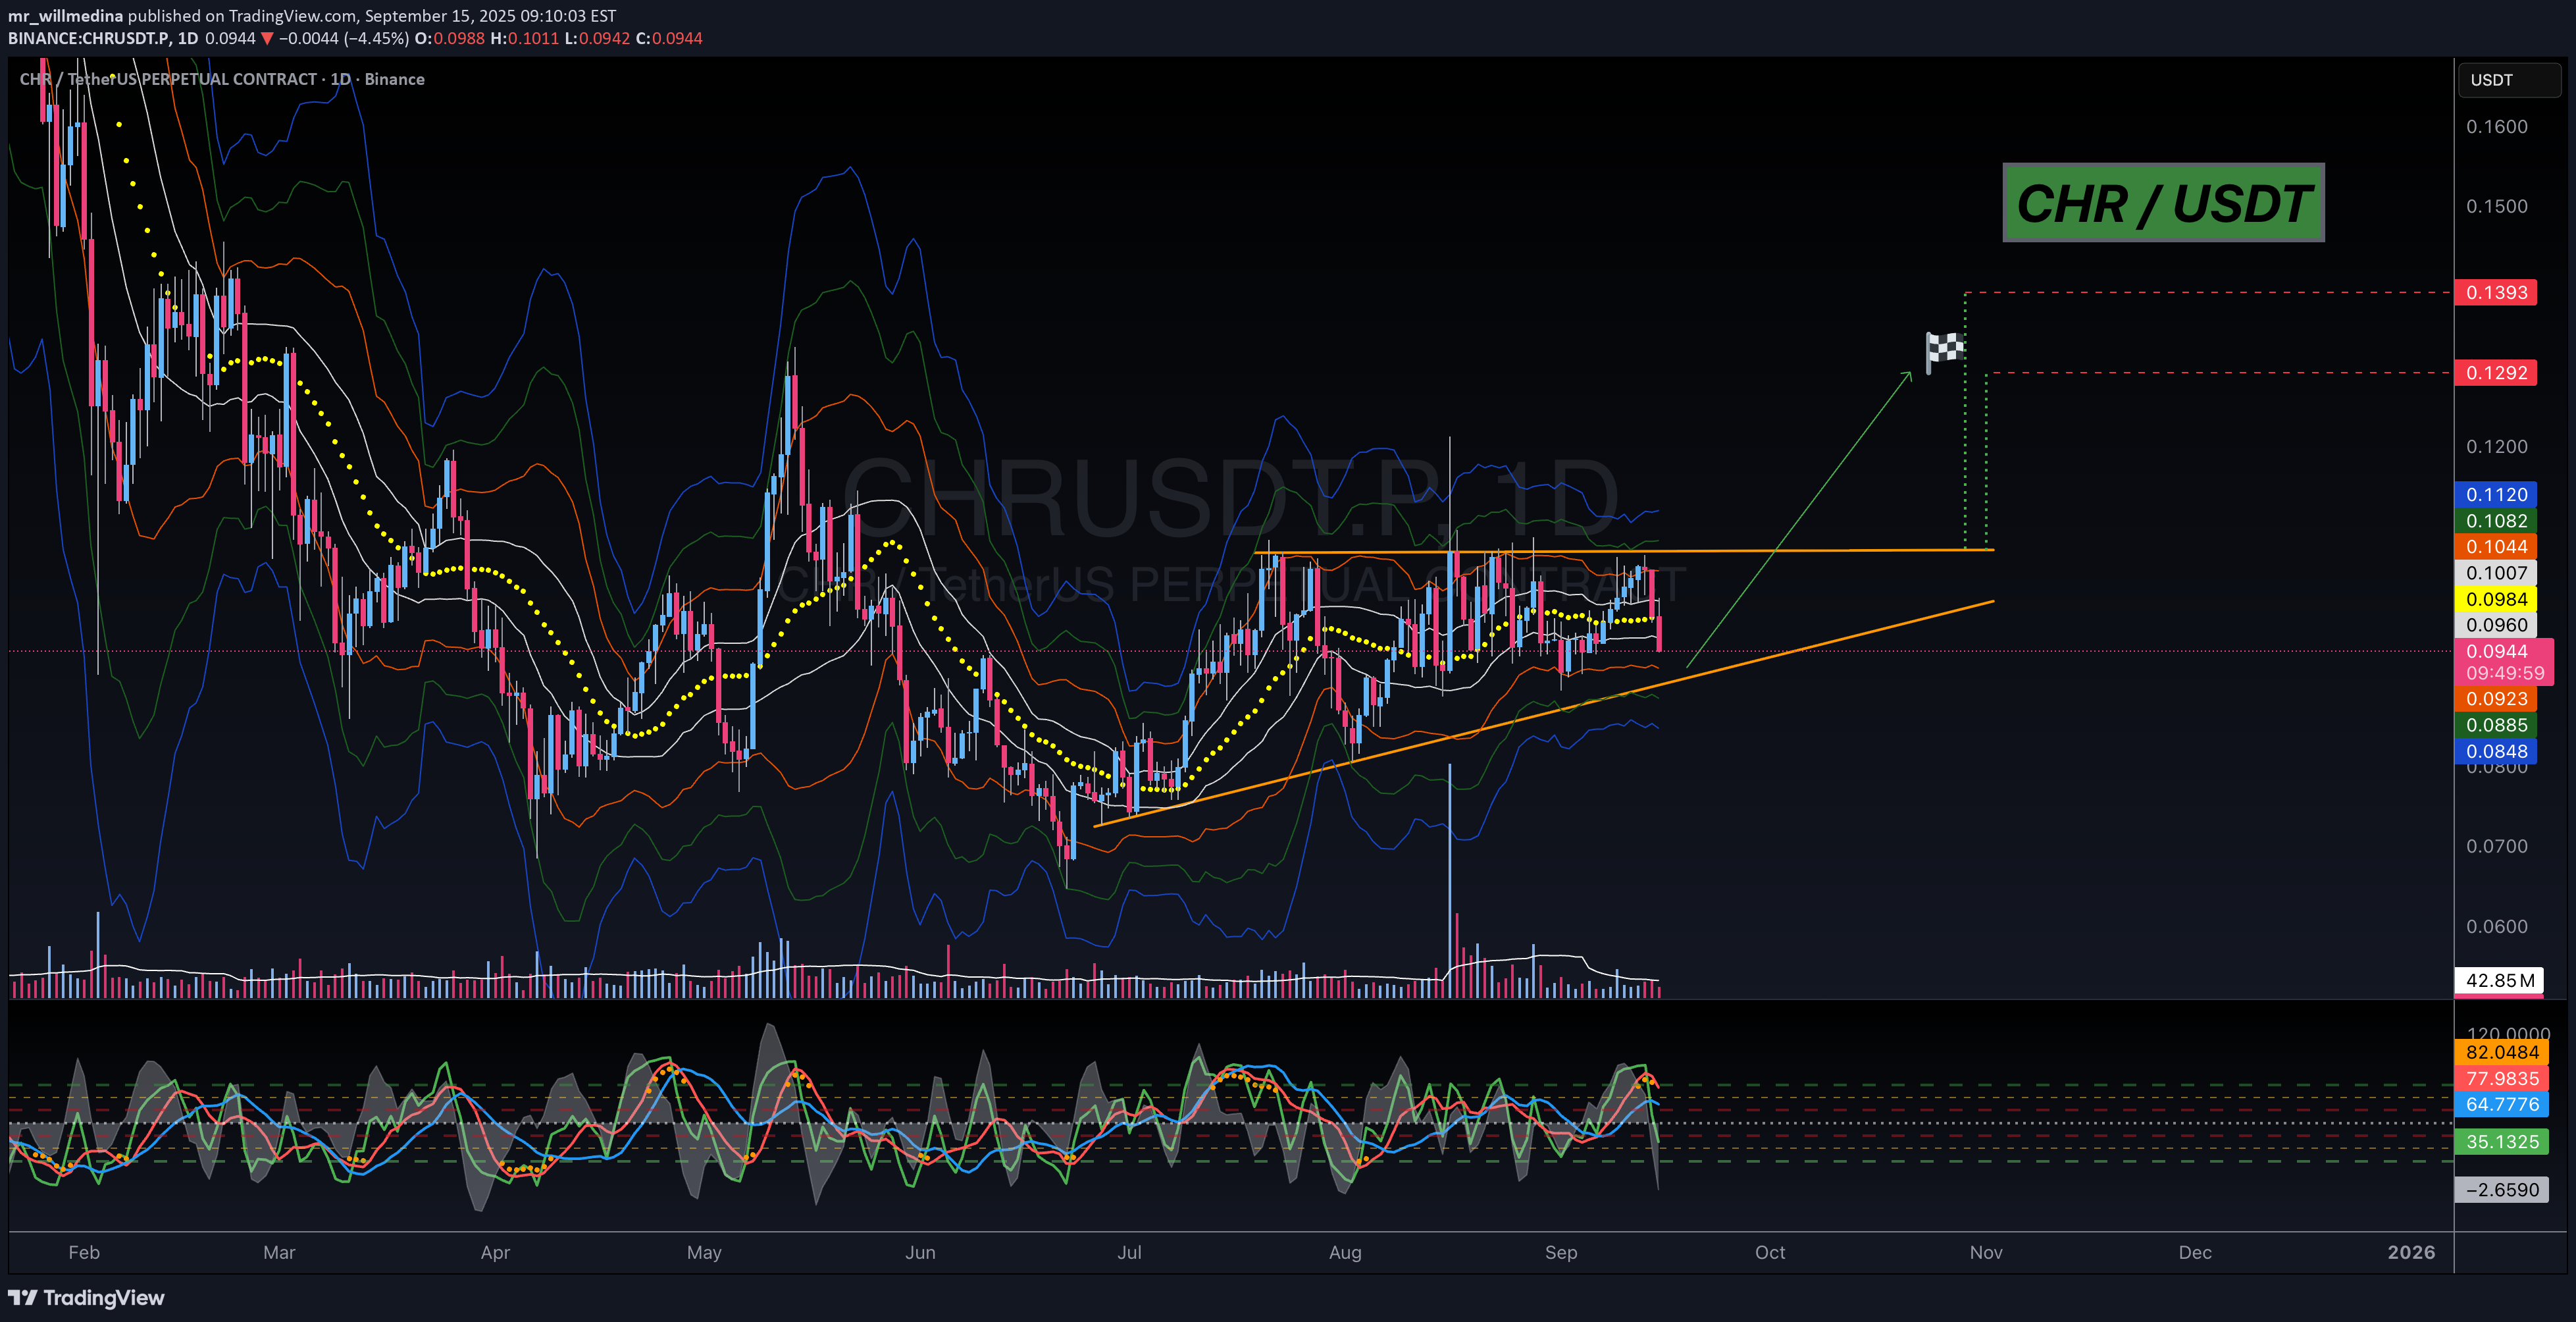
Morning fellas, Taking a risk here. Obv its ur money, do with it as you wish, as this aint financial advice, but its hella looking good! Trade thirsty, my friends!

CryptoNuclear
CHR/USDT — Sitting on Demand Zone, Rebound or Breakdown Ahead?
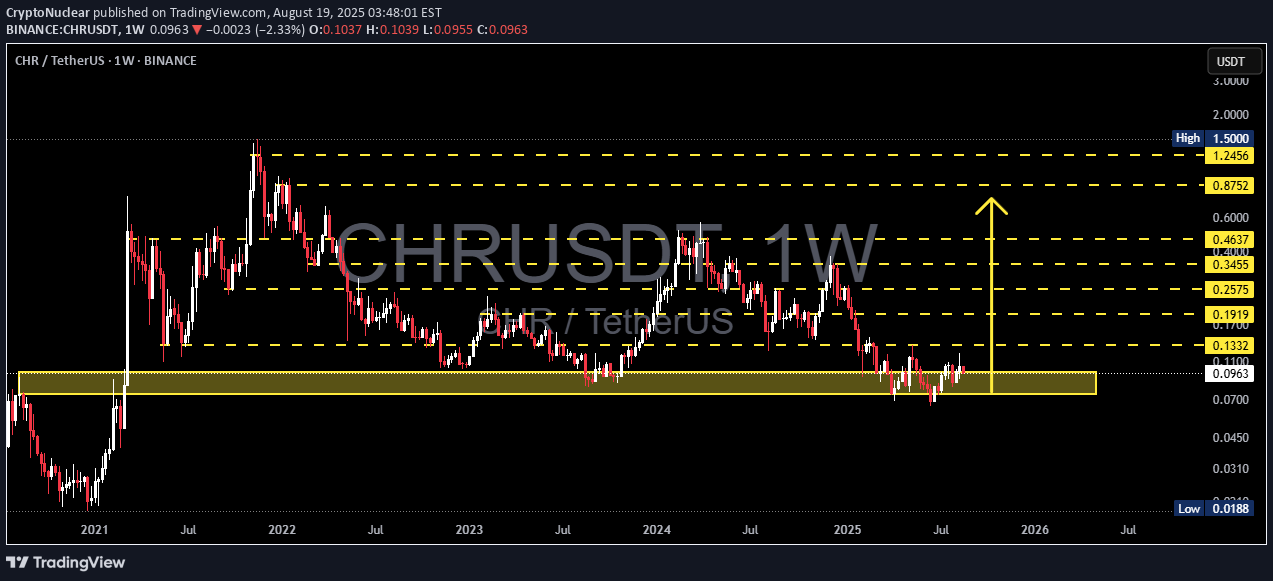
CHR/USDT is currently trading around $0.0971, right inside the historical demand zone $0.07–0.12, which has been a strong accumulation area since 2021. This zone has acted as a launchpad for multiple rallies, but at the same time, it holds a pool of equal lows liquidity that could be swept if buyers fail to defend it. Key technical levels from the chart: Major demand/support: 0.0700 – 0.0900 Step resistances: 0.1100 – 0.1332 – 0.1710 – 0.1919 – 0.2575 – 0.3455 – 0.4637 – 0.8752 – 1.2456 – 1.5000 Historical low: 0.0188 --- 🔹 Market Structure & Pattern Price is building a multi-year horizontal accumulation base between 0.07–0.12. Each historical rally was triggered from this zone, making it a high-value demand block. However, repeated tests without a strong breakout increase the risk of demand exhaustion and potential breakdown. In other words, this area can either act as the foundation of the next bull rally or the last line before capitulation. --- 🟢 Bullish Scenario Bias remains bullish as long as 0.0700 holds. First trigger: A weekly close above 0.1100 → opens the path toward 0.1332. Stronger confirmation: A break and close above 0.1332 → sets targets at 0.1710 → 0.1919. Mid-term swing targets: 0.2575 → 0.3455. In case of a full bullish cycle, reclaiming higher zones around 0.4–0.8 and even 1.2–1.5 remains possible. --- 🔴 Bearish Scenario Warning sign: A weekly close below 0.0900 suggests fading buyer strength. A breakdown below 0.0700 would unlock deeper downside: 0.0450 → 0.0310, with extreme risk toward the historical low at 0.0188. This would mark a failed demand block and transition into a bearish market structure. --- 🎯 Conclusion & Strategy CHR/USDT is at a critical crossroad: Bullish case: Holding above 0.07–0.12 keeps the rebound potential alive. Bearish case: Losing 0.07 would confirm structural weakness and open deeper downside. 💡 For aggressive traders: consider accumulation within the current zone with a tight stop below 0.0700. 💡 For conservative traders: wait for a weekly close >0.1332 as confirmation before entering long, targeting 0.1710–0.1919. #CHRUSDT #Chromia #CryptoAnalysis #AltcoinTrading #PriceAction #SupportResistance #SwingTrading #CryptoTA #WeeklyChart

CryptoWithJames
CHRUSDT UPDATE
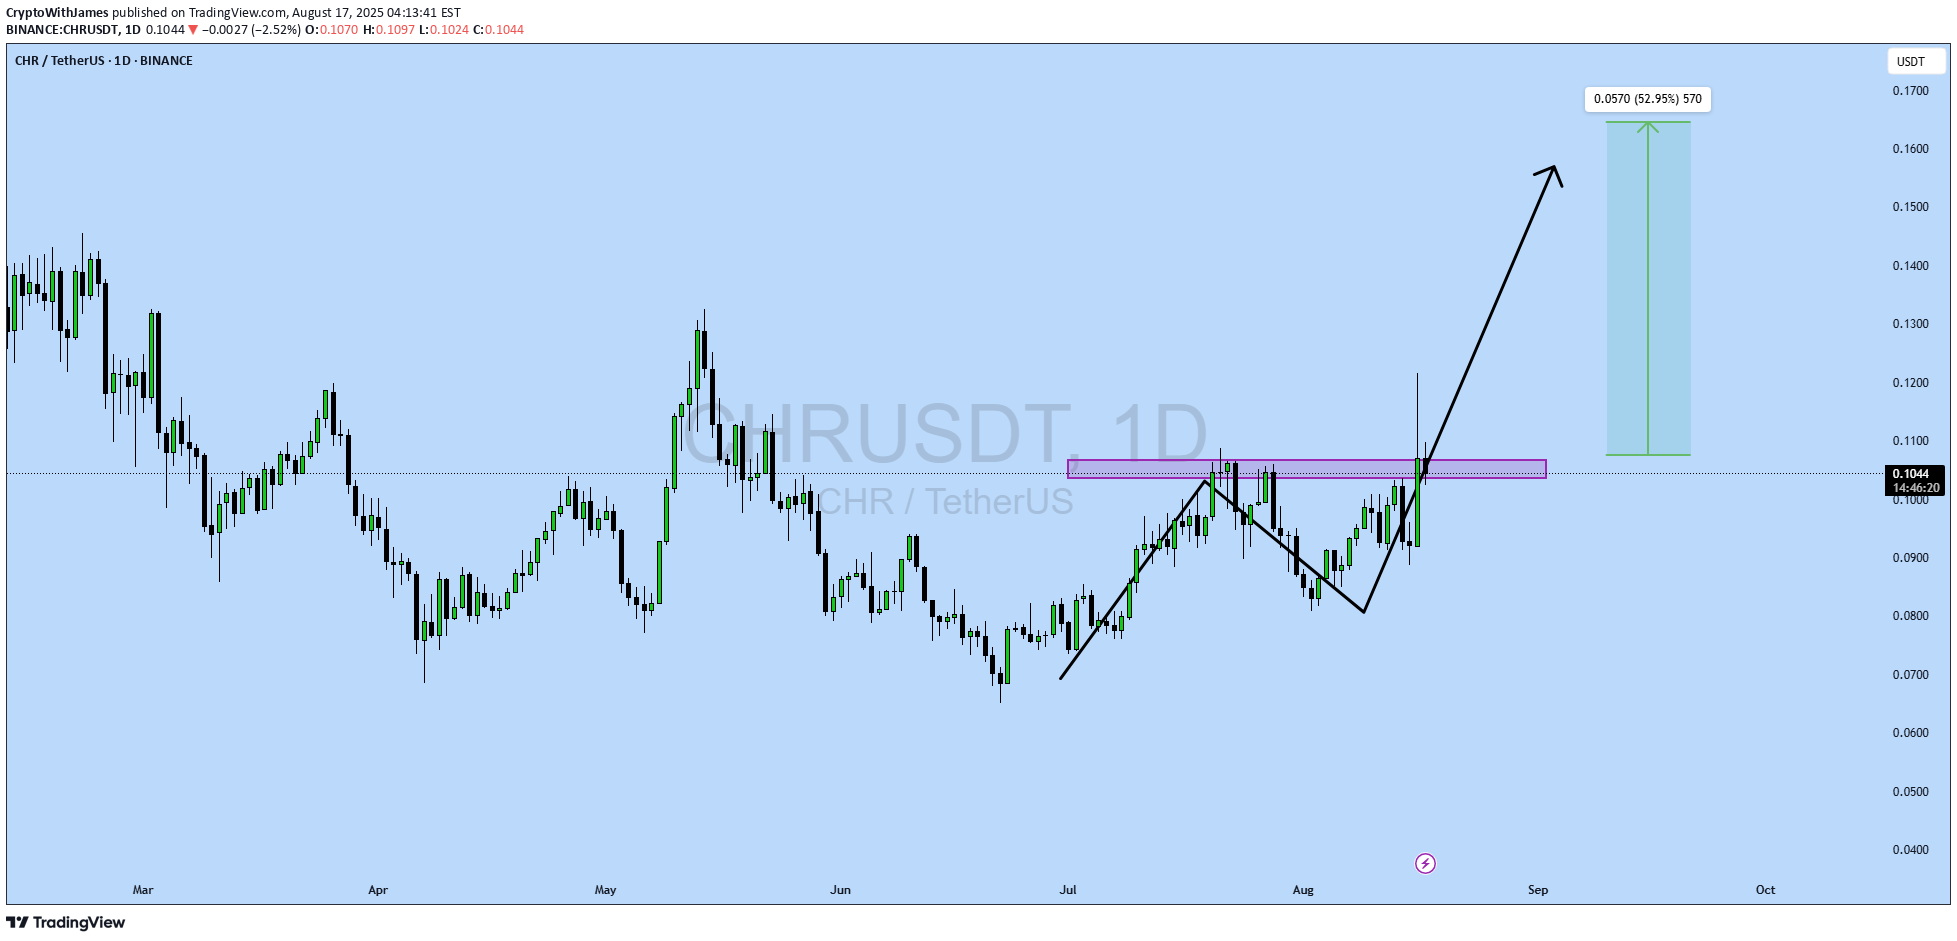
#CHR UPDATE CHR Technical Setup Pattern: Bullish Wave Pattern Current Price: $0.1043 Target Price: $0.16 Target % Gain: 52.95% Technical Analysis: CHR is showing a bullish wave breakout on the 1D chart, reclaiming resistance around $0.10–$0.11 as new support. Strong bullish candles and momentum indicate a possible continuation move, with the next target set near $0.16. Time Frame: 1D Risk Management Tip: Always use proper risk management.

MasterAnanda
CHR · Perfect Timing · 1177% Profits Potential
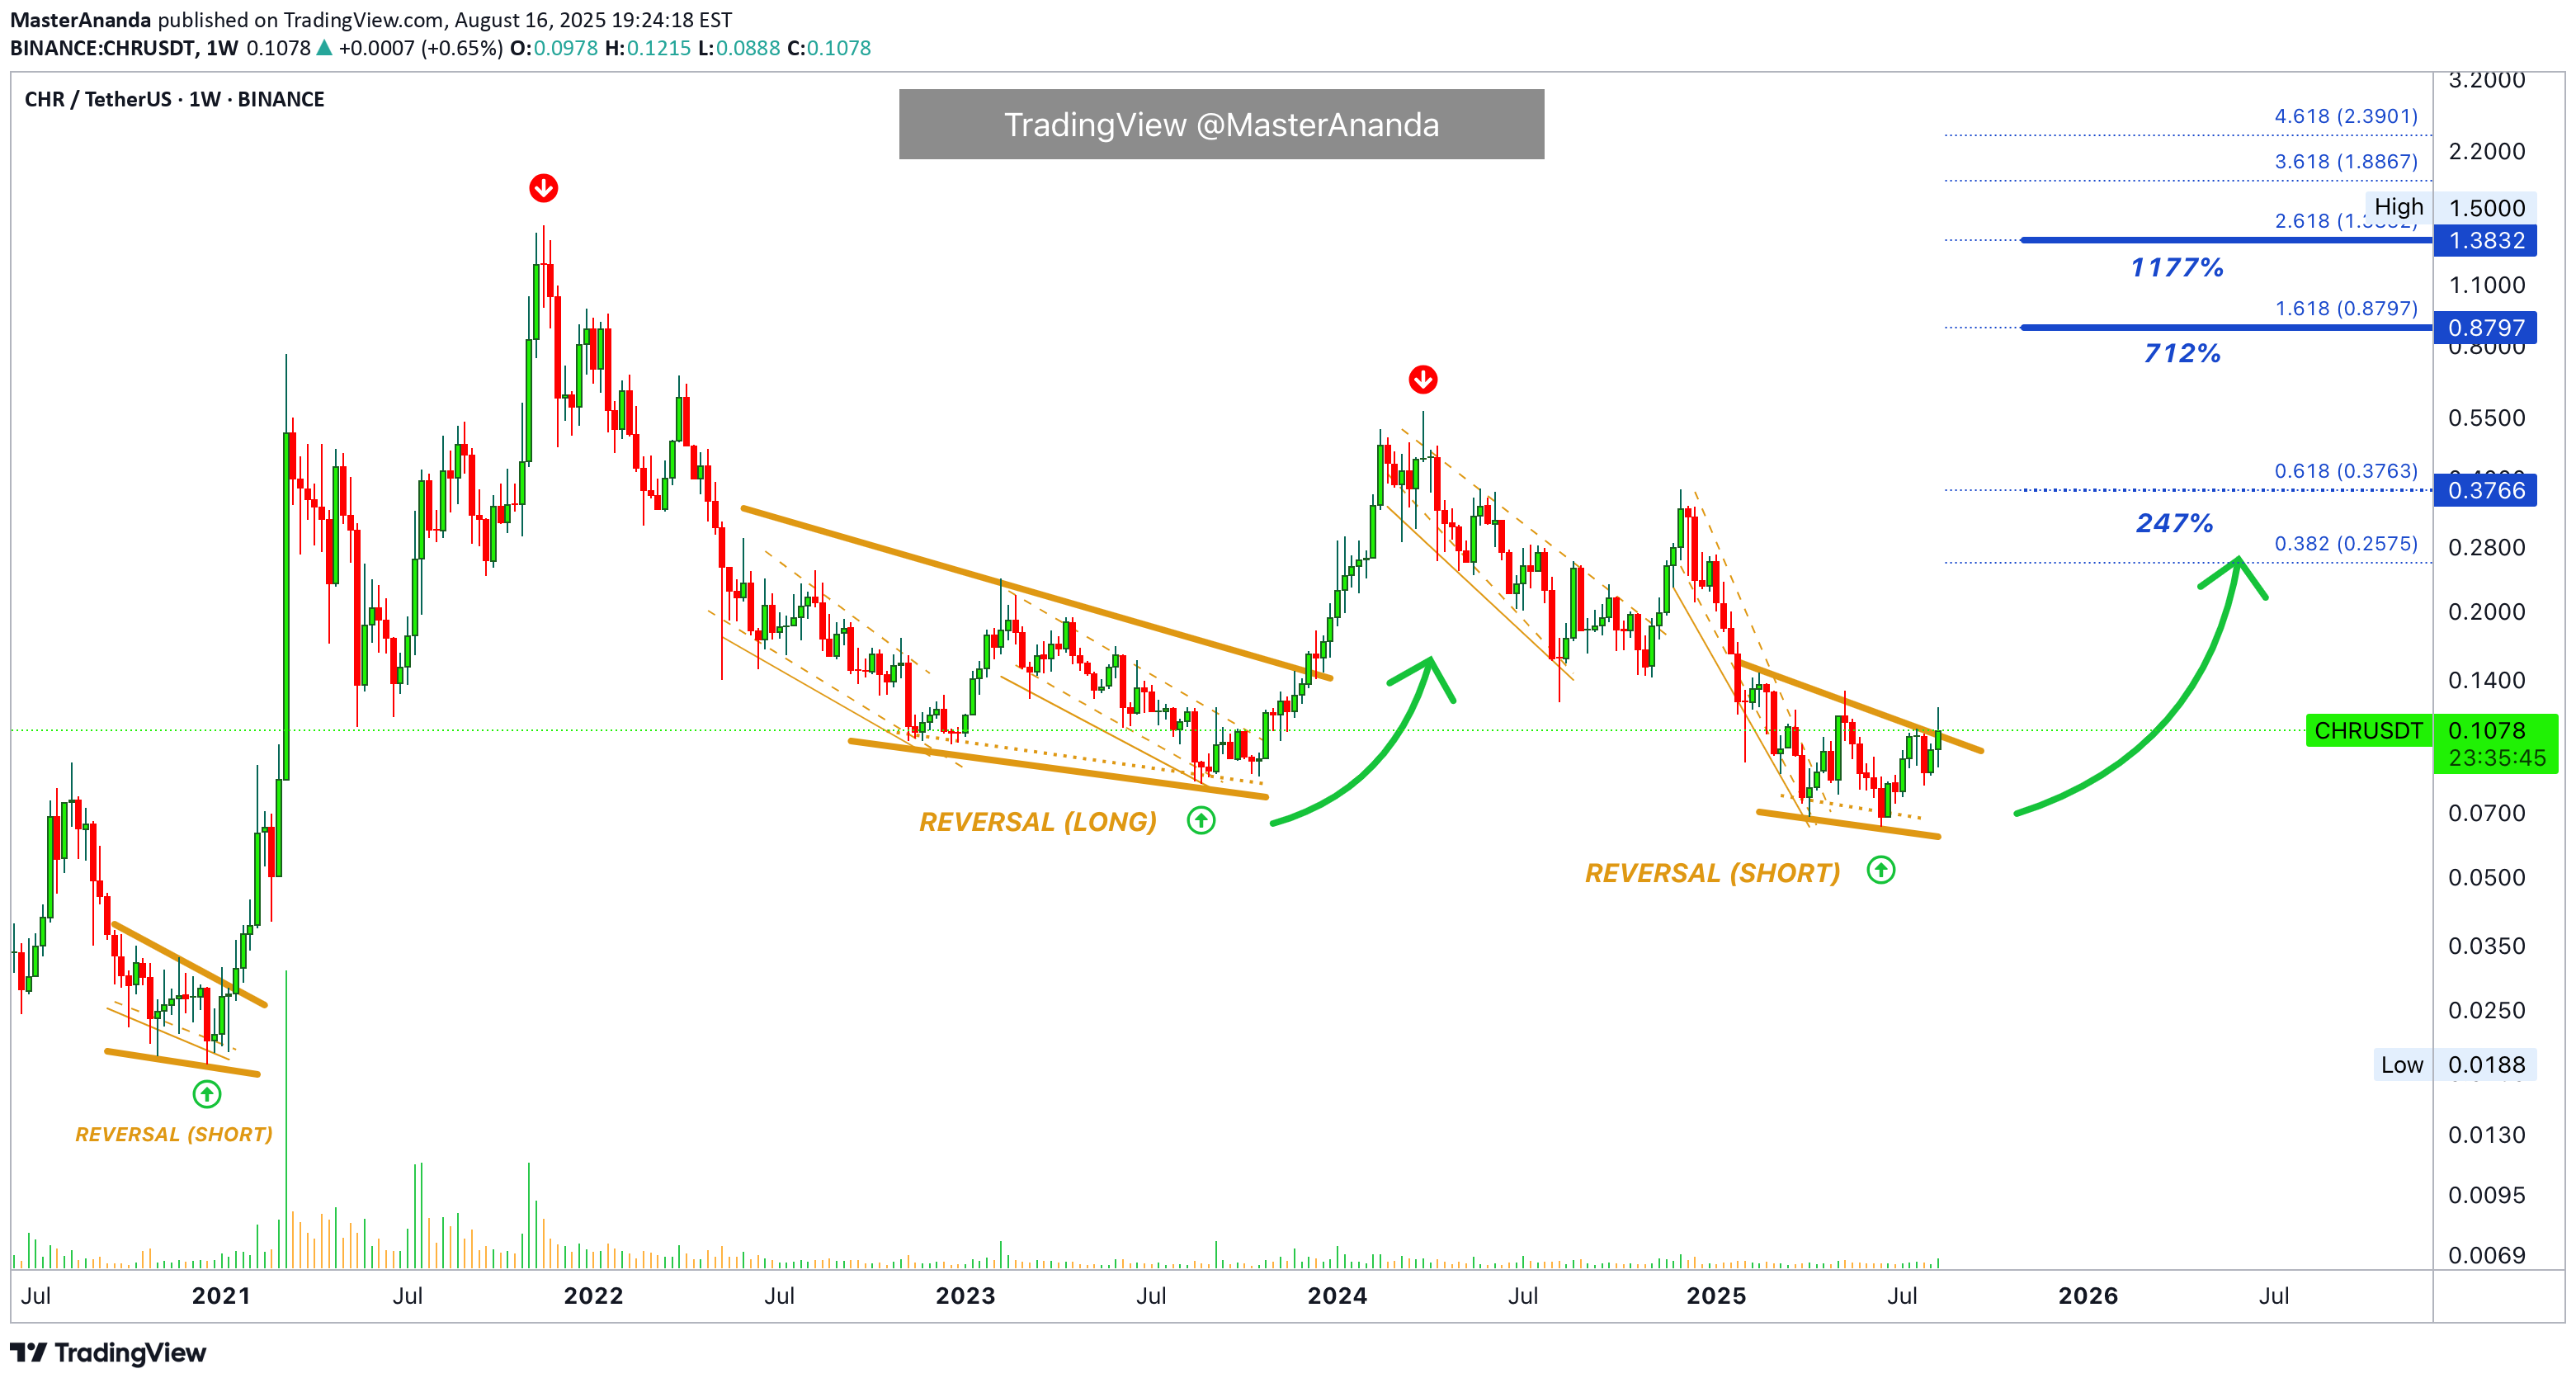
If I had to summarize this entire article (chart) in a single phrase it would be: Perfect timing. CHRUSDT (Chromia) has perfect timing for massive growth. A full reversal pattern is present and complete with the bullish breakout happening now with two weeks closing green and many weeks moving up. The timing is great because the long-term chart structure shows perfect conditions for a change of trend. This means that we are looking at bottom prices but with a bullish bias already confirmed. CHRUSDT has been recovering slowly for an entire month. An easy but strong target at $0.8797 has 712% profits potential. More can be found on the chart. Thank you for reading. Namaste.
Disclaimer
Any content and materials included in Sahmeto's website and official communication channels are a compilation of personal opinions and analyses and are not binding. They do not constitute any recommendation for buying, selling, entering or exiting the stock market and cryptocurrency market. Also, all news and analyses included in the website and channels are merely republished information from official and unofficial domestic and foreign sources, and it is obvious that users of the said content are responsible for following up and ensuring the authenticity and accuracy of the materials. Therefore, while disclaiming responsibility, it is declared that the responsibility for any decision-making, action, and potential profit and loss in the capital market and cryptocurrency market lies with the trader.