
CFX
Conflux
| تریدر | نوع سیگنال | حد سود/ضرر | زمان انتشار | مشاهده پیام |
|---|---|---|---|---|
 CryptoNuclearRank: 32176 | خرید | حد سود: تعیین نشده حد ضرر: تعیین نشده | 12/27/2025 |
Price Chart of Conflux
سود 3 Months :
سیگنالهای Conflux
Filter
Sort messages by
Trader Type
Time Frame

CryptoAnalystSignal
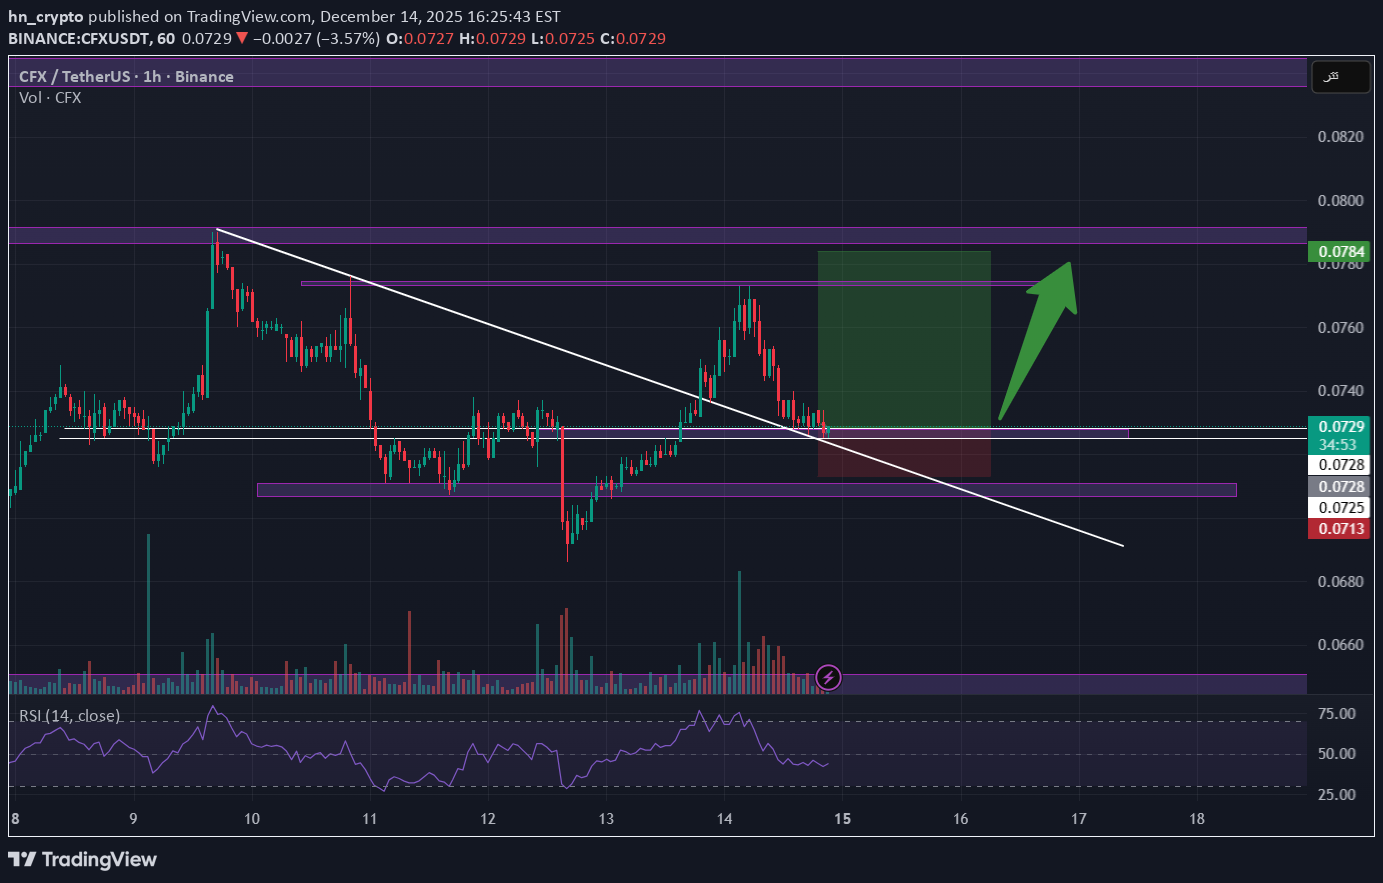
#CFX/USDT — Symmetrical Triangle: Ready for a Rally or a Breakd

#CFX The price is moving in a descending channel on the 1-hour timeframe. It has reached the lower boundary and is heading towards breaking above it, with a retest of the upper boundary expected. We have a downtrend on the RSI indicator, which has reached near the lower boundary, and an upward rebound is expected. There is a key support zone in green at 0.0724. The price has bounced from this level multiple times and is expected to bounce again. We have a trend towards consolidation above the 100-period moving average, as we are moving close to it, which supports the upward movement. Entry price: 0.0730 First target: 0.0737 Second target: 0.0747 Third target: 0.0760 Don't forget a simple principle: money management. Place your stop-loss order below the support zone in green. For any questions, please leave a comment. Thank you.#CFX First target: 0.0737 Reached Second target: 0.0747 Reached Third target: 0.0760 Reached
CryptoNuclear
CFX/USDT At Major Support — Last Line Before a Deeper Drop?

CFX/USDT on the Daily (1D) timeframe is still trading within a medium-term bearish trend, characterized by a clear sequence of lower highs and lower lows since the peak around the 0.27–0.28 area. Price has now declined back into a historically strong demand zone at 0.072 – 0.063, which previously acted as an accumulation base before a strong bullish impulse. This area represents a critical decision zone for the next major move. --- Pattern & Technical Structure 1. Descending Trendline (Bearish Control) A well-defined descending trendline connects the major swing highs since August. Each touch of this trendline resulted in strong rejection, confirming persistent seller dominance. 2. Descending Channel / Bearish Continuation Price structure forms a descending channel, reflecting gradual distribution. Current price action is located near the lower boundary of the channel, close to key support. 3. Strong Horizontal Demand Zone The yellow zone at 0.072 – 0.063 represents: A strong historical reaction area Previous rebound levels A psychological deep discount zone This zone has the potential to act as a base for reversal if buyers step in aggressively. --- Key Levels Support Major Support (Key Demand): 0.072 – 0.063 Critical Breakdown Level: 0.059 Resistance Minor Resistance: 0.085 Mid Resistance: 0.104 Major Resistance: 0.125 Upper Resistance / Distribution Zone: 0.165 – 0.185 Macro Resistance: 0.230 --- Bullish Scenario Bullish conditions require: Price holding above 0.072 Formation of a base / consolidation Appearance of a bullish daily close (pin bar, engulfing, or strong bullish body) Potential bullish move: 1. Rebound from the 0.072–0.063 demand zone 2. Break above minor resistance at 0.085 3. Upside targets: 0.104 0.125 Strong momentum continuation → 0.165 – 0.185 Bullish Conclusion: This area offers a high-risk, high-reward accumulation opportunity for swing traders, as long as the key support remains intact. --- Bearish Scenario Bearish confirmation occurs if: A strong daily close below 0.063 Breakdown accompanied by increasing volume Failure to reclaim the 0.072 level Potential bearish continuation: Further downside toward: 0.059 Possible deeper liquidity zones if panic selling occurs Note: A breakdown of this zone confirms that the bearish continuation phase remains active. --- Conclusion CFX/USDT is currently trading at a major decision zone. Bounce from 0.072 – 0.063 → potential relief rally or trend reversal Breakdown below this area → confirmation of bearish continuation Market is at a critical turning point. Strict risk management is essential in this region. --- #CFX #CFXUSDT #CryptoAnalysis #Altcoin #DailyChart #DescendingTrend #SupportResistance #DemandZone #BearishTrend #PotentialReversal

Leo524
$CFX 2D CHART UPDATE

📌I’ve been watching CFX for a long time, not in a hurry. Price is now sitting inside a strong bullish order block (green zone). 📌This support zone is very important. History already showed us 3 times — every time price touched this area, it pushed up strongly. That’s not luck, that’s experience. 📌Right now, the market is doing the same thing again. Sellers are getting weak, buyers are slowly stepping in. 📌For a proper upside move, we need one simple thing: Break the downtrend line ➝ breakout ➝ retest ➝ hold 📌If that retest holds, price can start a new bullish leg 🚀 📌No rush here. I wait for confirmation, not hype.

mastercrypto2020
CFX USDT LONG SIGNAL

--- #📢 Official Trade Signal – CFX/USDT 📈 Position Type: LONG 💰 Entry Price: 0.06680 (Limit Order) --- 🎯 Take-Profit Targets (Partial Exits) • TP1: 0.06930 • TP2: 0.07310 • TP3: 0.07715 • TP4: 0.08025 • TP5: 0.08469 • TP6: — --- 🛑 Stop-Loss: 0.06210 📊 Timeframe: 15m ⚖️ Risk/Reward Ratio: — 💥 Suggested Leverage: 3× – 5× --- 🧠 Technical Analysis Summary CFX is trading above a key intraday demand zone on the 15-minute timeframe. Bullish structure remains intact with strong buying interest near 0.06680. As long as price holds above the entry zone, continuation toward higher liquidity levels is expected: 0.06930 → 0.07310 → 0.07715 → 0.08025 → 0.08469 A confirmed break and hold above TP1 significantly increases bullish continuation probability. --- ⚙️ Trade Management Rules ✔ Take partial profit at TP1 ✔ Move Stop-Loss to Break-Even after TP1 is hit ✔ Trail SL as price reaches higher targets ✔ Avoid re-entry if SL is triggered ✔ Confirm bullish structure before entering --- ⚠️ Risk Management Is Mandatory -- --- 📌 TradingView Hashtags #CFXUSDT #CFX #CryptoSignal #LongSetup #TradingView #FuturesTrading #TechnicalAnalysis ---

iMoneyTeam
CFX Buy/Long Signal (4H)

Considering that a large liquidity pool has been accumulated at the bottom of the chart, the price then formed a bullish CH, and all the order blocks above the chart have been consumed, taking a buy/long position on CFX seems relatively low-risk. We have two entry points, and entries should be taken using DCA. The targets have been marked on the chart, and reaching the third target is not even out of the question. Do not enter the position without capital management and stop setting Comment if you have any questions thank youDon’t forget that after the entry was triggered, the price pumped and the first target was hit

Bithereum_io
CFXUSDT 1D
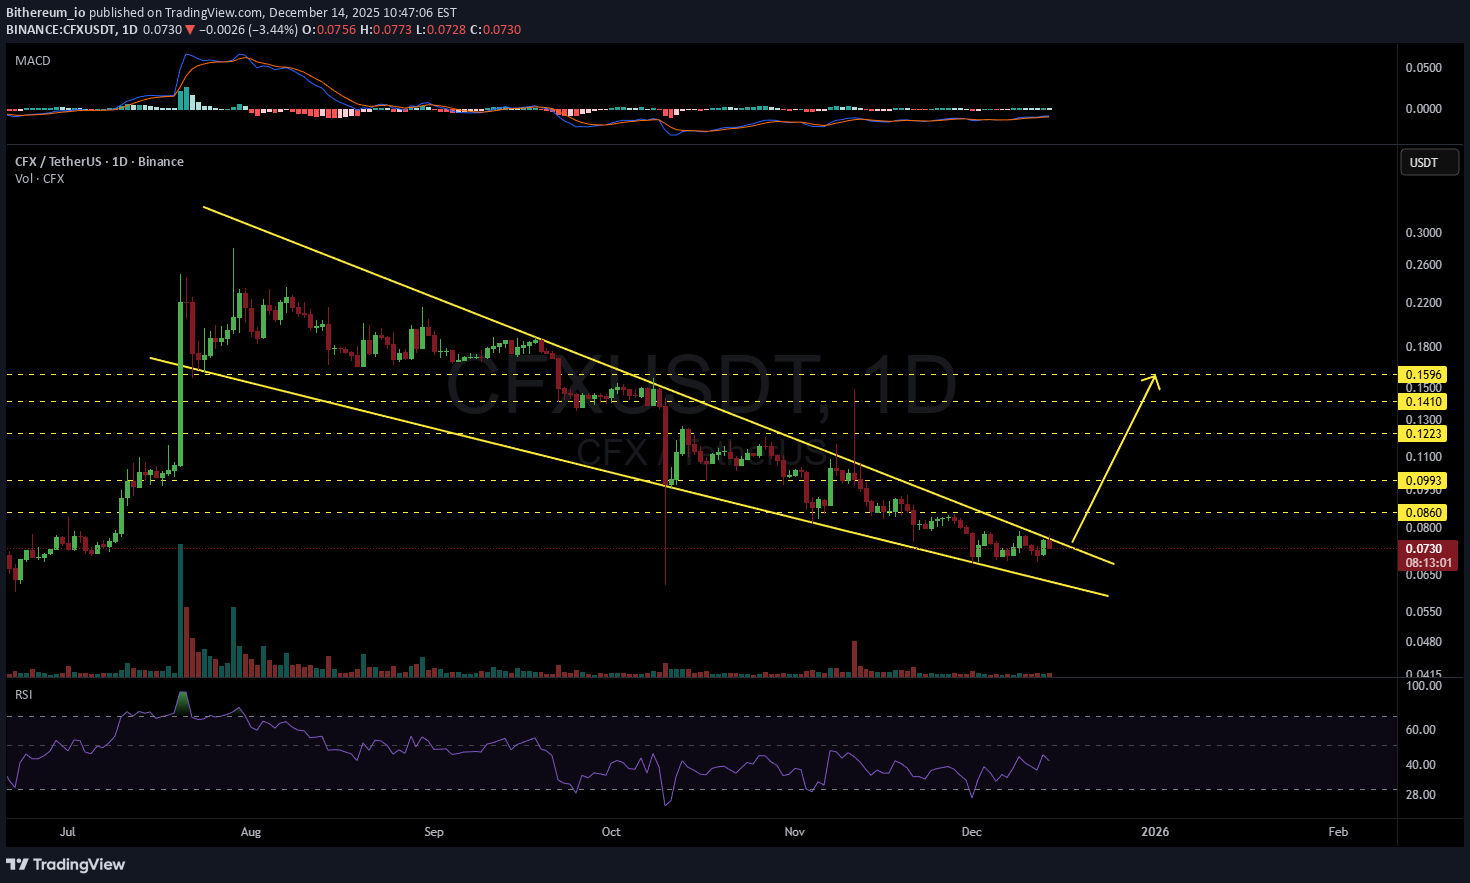
#CFX is moving inside a falling wedge pattern on the daily chart. Enter this coin only after a clean breakout above the wedge with strong volume. In that case, the potential targets are: 🎯 $0.0860 🎯 $0.0993 🎯 $0.1223 🎯 $0.1410 🎯 $0.1596 ⚠️ Always remember to use a tight stop-loss and maintain proper risk management.
Bithereum_io
رشد انفجاری CFX در انتظار شکست؛ این سطوح قیمتی را از دست ندهید!

#CFX is currently trading within a falling wedge pattern on the 12H timeframe and is on the verge of breaking out above it. Keep a close eye on this setup — if the breakout occurs, the potential upside targets are: 🎯 $0.1222 🎯 $0.1348 🎯 $0.1473 🎯 $0.1652 🎯 $0.1880 ⚠️ Always remember to use a tight stop-loss and maintain proper risk management.

melikatrader94
تحلیل انفجاری CFX: شکست سر و شانه و فرصت فروش داغ زیر ۰.۱۱۰۰!

Hi guys! just a quick analysis CFX is printing a clean head and shoulders setup on the 15-minute chart. The neckline sits around the 0.1100 zone, which is acting as short-term support right now. If the price breaks below that neckline with a solid candle close, it could confirm a bearish reversal. The plan would be to wait for a retest of the neckline as resistance and then look for a short entry. Trade idea: Entry: On a confirmed break and retest below 0.1100 Target: 0.1020 area (previous support) Stop: Above the right shoulder, around 0.1140 If the neckline gives way, momentum could accelerate quickly to the downside. Just make sure to wait for confirmation!
CryptoAnalystSignal
تحلیل تکنیکال CFX/USDT: آماده خروج انفجاری از کانال نزولی! (اهداف قیمتی جدید)

#CFX The price is moving within a descending channel on the 1-hour frame, adhering well to it, and is heading for a strong breakout and retest. We have a bearish trend on the RSI indicator that is about to be broken and retested, which supports the upward breakout. There is a major support area in green at 0.1410, which represents a strong support point. We are heading for consolidation above the 100 moving average. Entry price: 0.1442 First target: 0.1500 Second target: 0.1545 Third target: 0.1604 Don't forget a simple matter: capital management. When you reach the first target, save some money and then change your stop-loss order to an entry order. For inquiries, please leave a comment. Thank you.
Disclaimer
Any content and materials included in Sahmeto's website and official communication channels are a compilation of personal opinions and analyses and are not binding. They do not constitute any recommendation for buying, selling, entering or exiting the stock market and cryptocurrency market. Also, all news and analyses included in the website and channels are merely republished information from official and unofficial domestic and foreign sources, and it is obvious that users of the said content are responsible for following up and ensuring the authenticity and accuracy of the materials. Therefore, while disclaiming responsibility, it is declared that the responsibility for any decision-making, action, and potential profit and loss in the capital market and cryptocurrency market lies with the trader.