
BEL
Bella Protocol
| تریدر | نوع سیگنال | حد سود/ضرر | زمان انتشار | مشاهده پیام |
|---|---|---|---|---|
No results found. | ||||
Price Chart of Bella Protocol
سود 3 Months :
سیگنالهای Bella Protocol
Filter
Sort messages by
Trader Type
Time Frame

تحلیل نقطه در بازار آتی: تکنیک معاملاتی کوتاهمدت (نه سرمایهگذاری)

point analysis It is not an investment technique It is a short term transaction only for the futures market. The three processes can be in the same direction or in different Directions appear on the minute chart immediately after the relevant minute or It is expected to be in the direction of the candles that will form within 1-2 minutes.
تحلیل روزانه نمودار: سطوح کلیدی فیبوناچی و حرکت مومنتوم (بدون توصیه سرمایهگذاری)

daily bottom high fib 707-786 Note to myself to find momentum It is not a buy or sell tut recommendation. direction?? It is not an investment advice.
تحلیل سریع BEL/USDT در ساعت 12:37 (بدون توصیه سرمایهگذاری)

........................................................................................................ It is not investment advice. note to self. .........................................

هشدار صعودی قدرتمند: BELUSDT در آستانه جهش 100 درصدی با الگوی گُوِه نزولی!
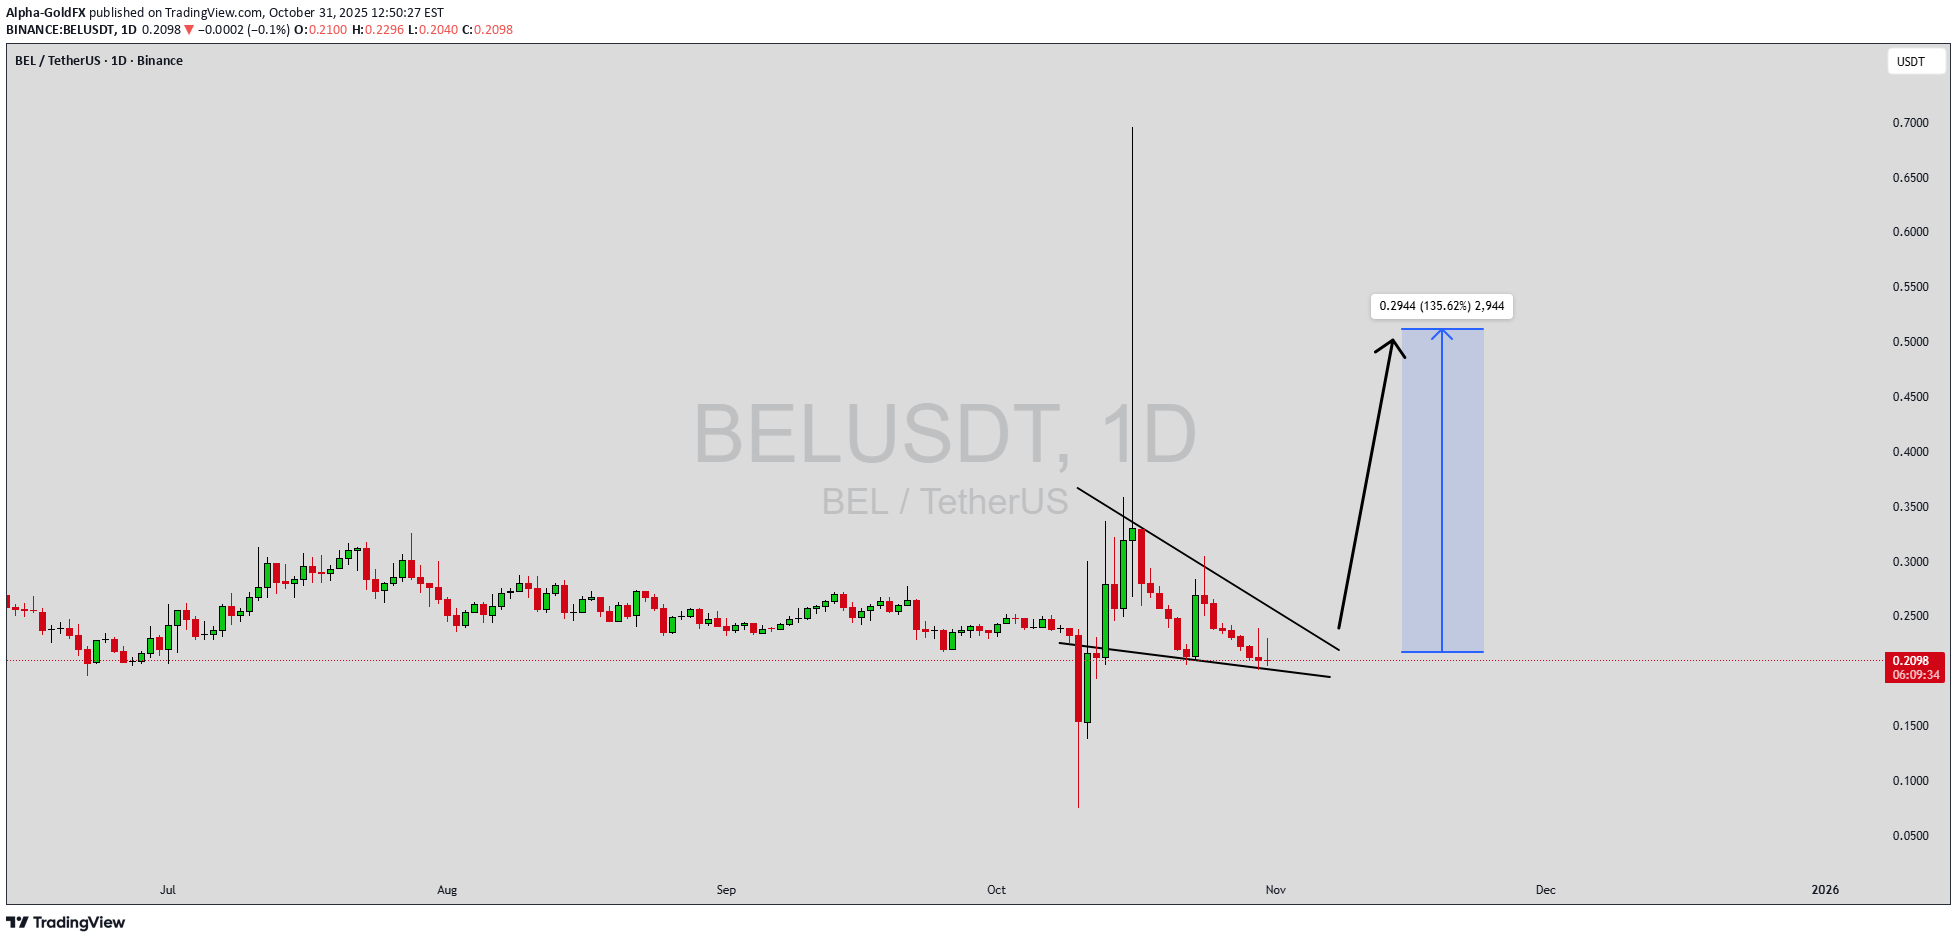
BELUSDT is currently exhibiting a strong bullish setup as it forms a classic falling wedge pattern, which is widely recognized as a potential reversal signal in technical analysis. After a sustained period of downward movement, the price appears to be consolidating within this narrowing range, indicating that selling pressure is diminishing and buyers are beginning to accumulate positions. Once the resistance line is broken with solid volume, BELUSDT could potentially trigger a powerful upside move, targeting gains in the range of 90% to 100%+. The current trading volume remains healthy, showing consistent market activity and growing participation from both retail and institutional investors. This increase in volume often signals renewed confidence in the asset, especially when it coincides with a bullish reversal structure like the falling wedge. The technical indicators suggest that momentum is slowly shifting in favor of the bulls, setting the stage for a potential breakout in the near term. Investor sentiment toward BELUSDT is improving as the broader crypto market recovers and capital begins flowing back into mid-cap altcoins. With positive technical signals, rising volume, and increasing investor attention, BELUSDT could be on the verge of a strong upward rally. Traders should keep a close eye on key breakout levels to confirm momentum and position accordingly for the next potential bullish leg. ✅ Show your support by hitting the like button and ✅ Leaving a comment below! (What is You opinion about this Coin) Your feedback and engagement keep me inspired to share more insightful market analysis with you!
تکنیک تحلیل ساعتی: راز شروع موج جدید در بازار و زمان ورود به معامله

theoretical knowledge Note to self It does not contain buy sell tut recommendation. ........................................................................................................ Note to self for the short term hourly market.Note to SELF The correction of the newly formed impulse wave that broke the beginning of the impulse that made the hill; The impulse that makes the hill build does not need to enter the initial distance or region; Correction distance is unimportant. The real question is where to trade in the new impulsive wave that ends the correction?
معامله کوتاهمدت: نکات مهم و یادداشتهای شخصی برای بازار آتی

It is not investment advice It is not a buy or sell tut recommendation. Note to self for the futures market

آماده جهش بزرگ؟ راز پامپ 2 برابری سهام BEL برملا شد!

On weekly timeframe BEL is about to enter the bollinger band for a mean reversion condition but has not yet. Entering here would mean a pending move to the mean 100% away from price right now. On the daily we see an expansion from the current consolidating range. Current Longest OverExpanded Period on 4hr chart giving support. Can probably consider a position on the swing lows. Will post position in my discord.

BELUSDT | 30M SETUP.

🔴 BELUSDT | 30M Bearish Setup ✅ Price formed a CHoCH (Change of Character) signaling bearish shift. ✅ Clear POI (Supply Zone) around 0.2700 – 0.2750. 🔍 Price dumped sharply and is likely to retrace back into POI before resuming drop. 📌 Trade Idea: Wait for price to tap POI and look for bearish confirmation before entry. 🎯 Potential move toward 0.2450 after POI rejection.

Bella Protocol 522% Easy Profits Potential

We are going to be looking at many charts together every single day. We will go through all the altcoins basically. I am starting with some of those from the last period that didn't move. The charts look good but they filed to break their May high. These pairs are now ready to move before the rest of the market. Here we have BELUSDT. A nice rounded bottom to end the downtrend. A small bullish recovery supported by high volume. We have a perfect set of reversal signals and today a full green candle. This candle confirms those signals and opens up the chance of a strong advance. If the action starts now, you can be looking at the start of a major 2-3 months long move. There will be some stops along the way but the action should be bullish nonetheless, higher highs and higher lows. Strategy In this setup we simply buy spot, no stop-loss. After buying we wait for as long as it is needed for prices to rise. Normally within 2-3 weeks, can be just a few days, but sometimes the wait can extend to 1-2 months. It varies. We are always prepared and ready to wait six full months, so if anything happens before this time horizon, even better but be ready to wait. Even if you were to sell your current pair to buy a new one, the new one also requires waiting. We tend to sell wanting to find something that is moving but the moment we sell, we are faced with the same problem; even if the pair you chose is moving you have to wait for the bullish wave to develop. Even if prices rise 5% daily it would still take 20 days for a 100% price increase. 40 days for 200%. Etc. Patience is key. So, simply, buy and hold. The market will take care of the rest. Namaste.

Fast trade on the BEL
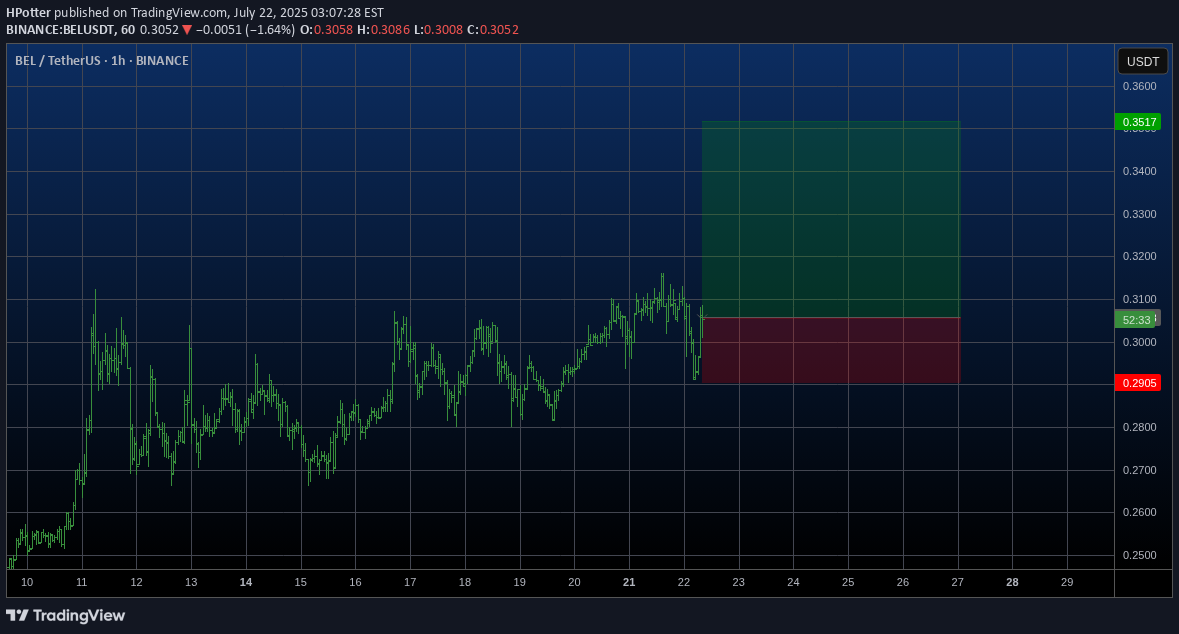
The good moment for try to Buy BELUSDT. We are in the flat channel and now ready to break it up and make fast move. The stop below local lowest low. Will see...
Disclaimer
Any content and materials included in Sahmeto's website and official communication channels are a compilation of personal opinions and analyses and are not binding. They do not constitute any recommendation for buying, selling, entering or exiting the stock market and cryptocurrency market. Also, all news and analyses included in the website and channels are merely republished information from official and unofficial domestic and foreign sources, and it is obvious that users of the said content are responsible for following up and ensuring the authenticity and accuracy of the materials. Therefore, while disclaiming responsibility, it is declared that the responsibility for any decision-making, action, and potential profit and loss in the capital market and cryptocurrency market lies with the trader.