
AUCTION
Bounce Token
| تریدر | نوع سیگنال | حد سود/ضرر | زمان انتشار | مشاهده پیام |
|---|---|---|---|---|
No results found. | ||||
Price Chart of Bounce Token
سود 3 Months :
سیگنالهای Bounce Token
Filter
Sort messages by
Trader Type
Time Frame

FortuneAI
آماده جهش بزرگ؟ تحلیل تکنیکال از کف قیمت تا اوج دوباره!
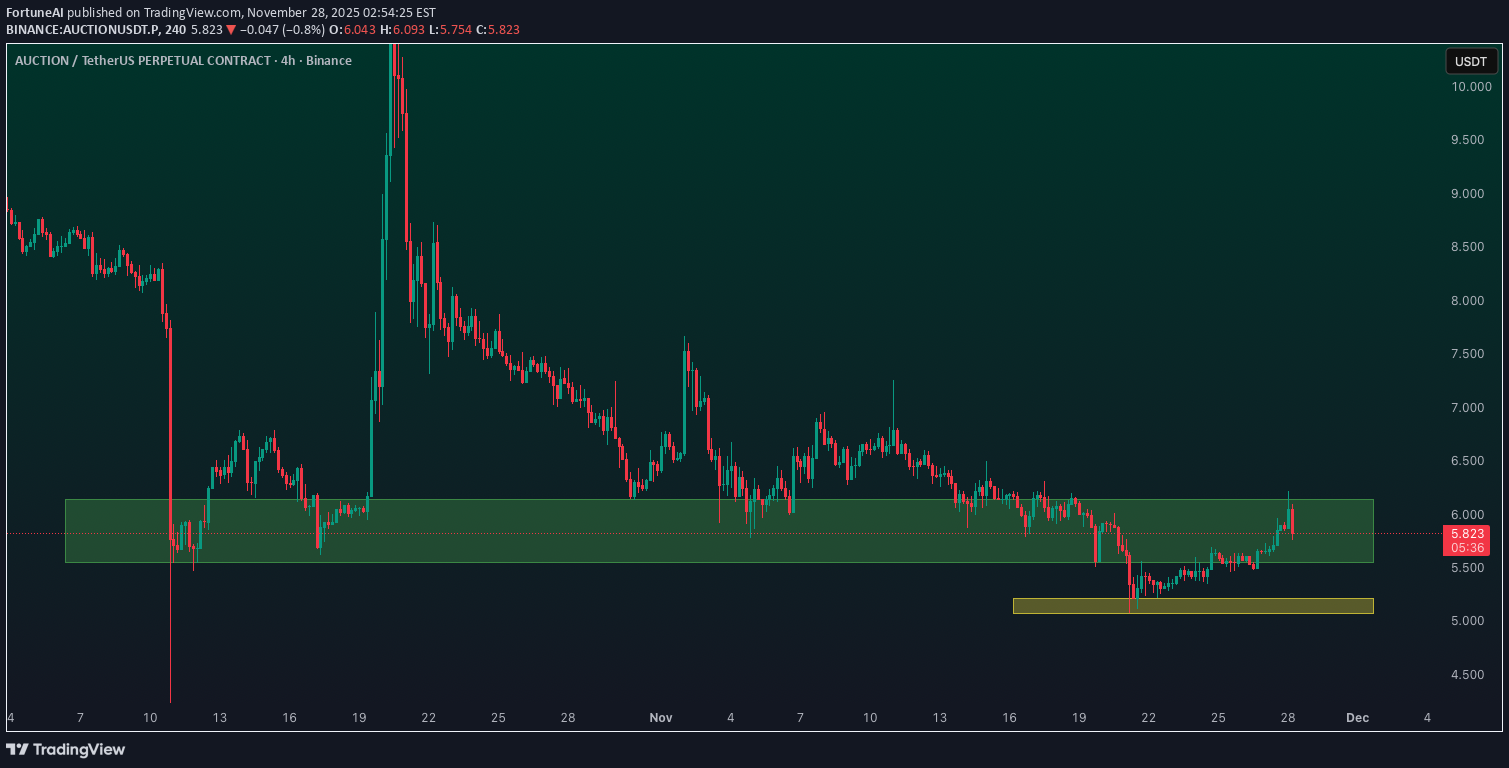
AUCTION Technicals look very Bullish here. Price is sitting on strong demand liquidity zone and exited oversold territory, hinting at short term momentum and exhaustion in selling pressure. So Technical Rebound is likely. Auction lacks clear fundamental catalysts, but if Technical Traders buy here then Actual Rebound is likely than a “dead cat bounce”AUCTION PUMPING HARD AS EXPECTED

CryptoAnalystSignal
AUCTION/USDT: سیگنال خرید صعودی یا ادامه ریزش؟ تحلیل فنی کامل و اهداف قیمت
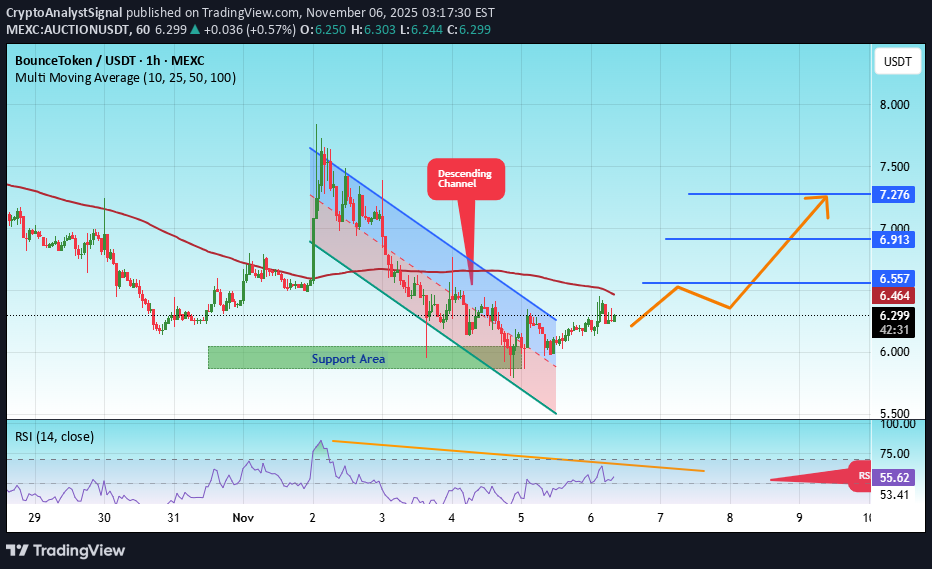
#AUCTION The price is moving within an ascending channel on the 1-hour timeframe and is adhering to it well. It is poised to break out strongly and retest the channel. We have a downtrend line on the RSI indicator that is about to break and retest, which supports the upward move. There is a key support zone in green at the 6.00 price level, representing a strong support point. We have a trend of consolidation above the 100-period moving average. Entry price: 6.28 First target: 6.54 Second target: 6.91 Third target: 7.27 Don't forget a simple money management rule: Place your stop-loss order below the green support zone. Once you reach the first target, save some money and then change your stop-loss order to an entry order. For any questions, please leave a comment. Thank you.
CryptoAnalystSignal
آینده ارز AUCTION: آیا اکنون زمان جمعآوری است یا سقوط در راه است؟
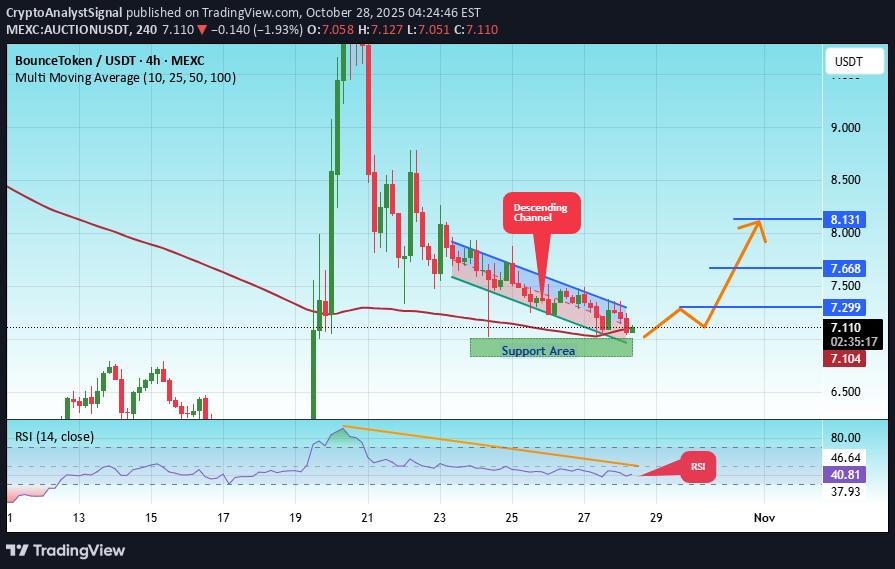
#AUCTION The price is moving in an ascending channel on the 1-hour frame, adhering well to it, and is heading for a strong breakout and retest. We have a bearish trend on the RSI indicator that is about to be broken and retested, which supports the upward breakout. There is a major support area in green at 6.90, representing a strong support point. We are heading for consolidation above the 100 moving average. Entry price: 7.11 First target: 7.30 Second target: 7.66 Third target: 8.11 Don't forget a simple matter: capital management. When you reach the first target, save some money and then change your stop-loss order to an entry order. For inquiries, please leave a comment. Thank you.

Cryptojobs
حمله دوباره طلا به قله؟ سیگنال خرید قوی در بازار!

unichartz
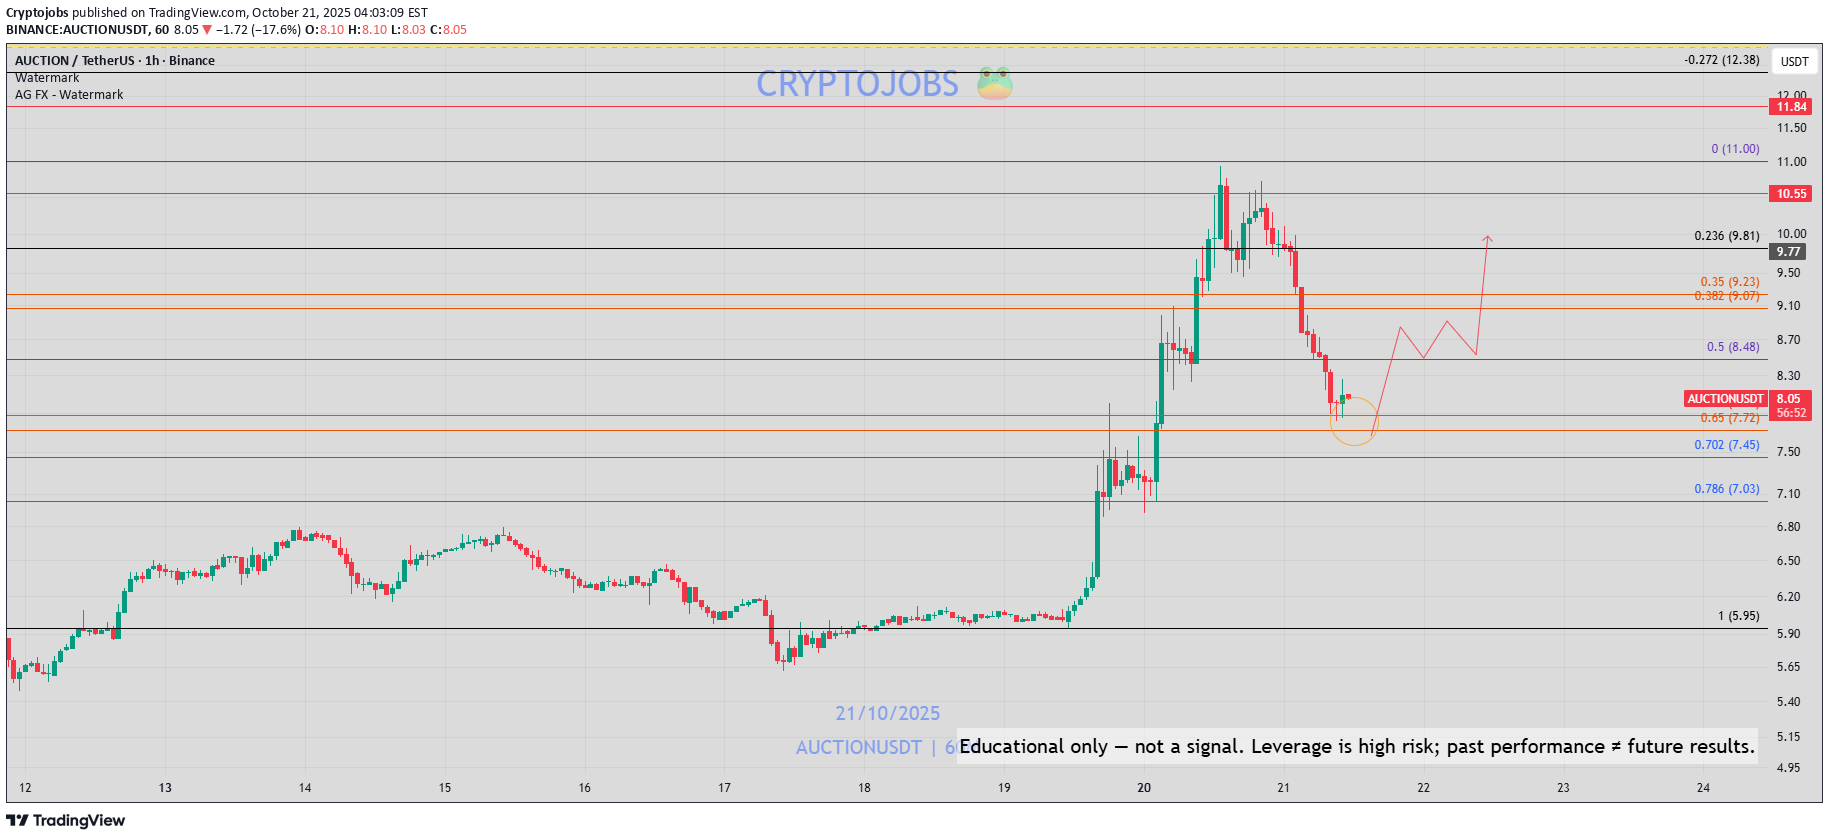
تحلیل قاطع $AUCTION: آیا آماده جهش پس از سقوط است؟
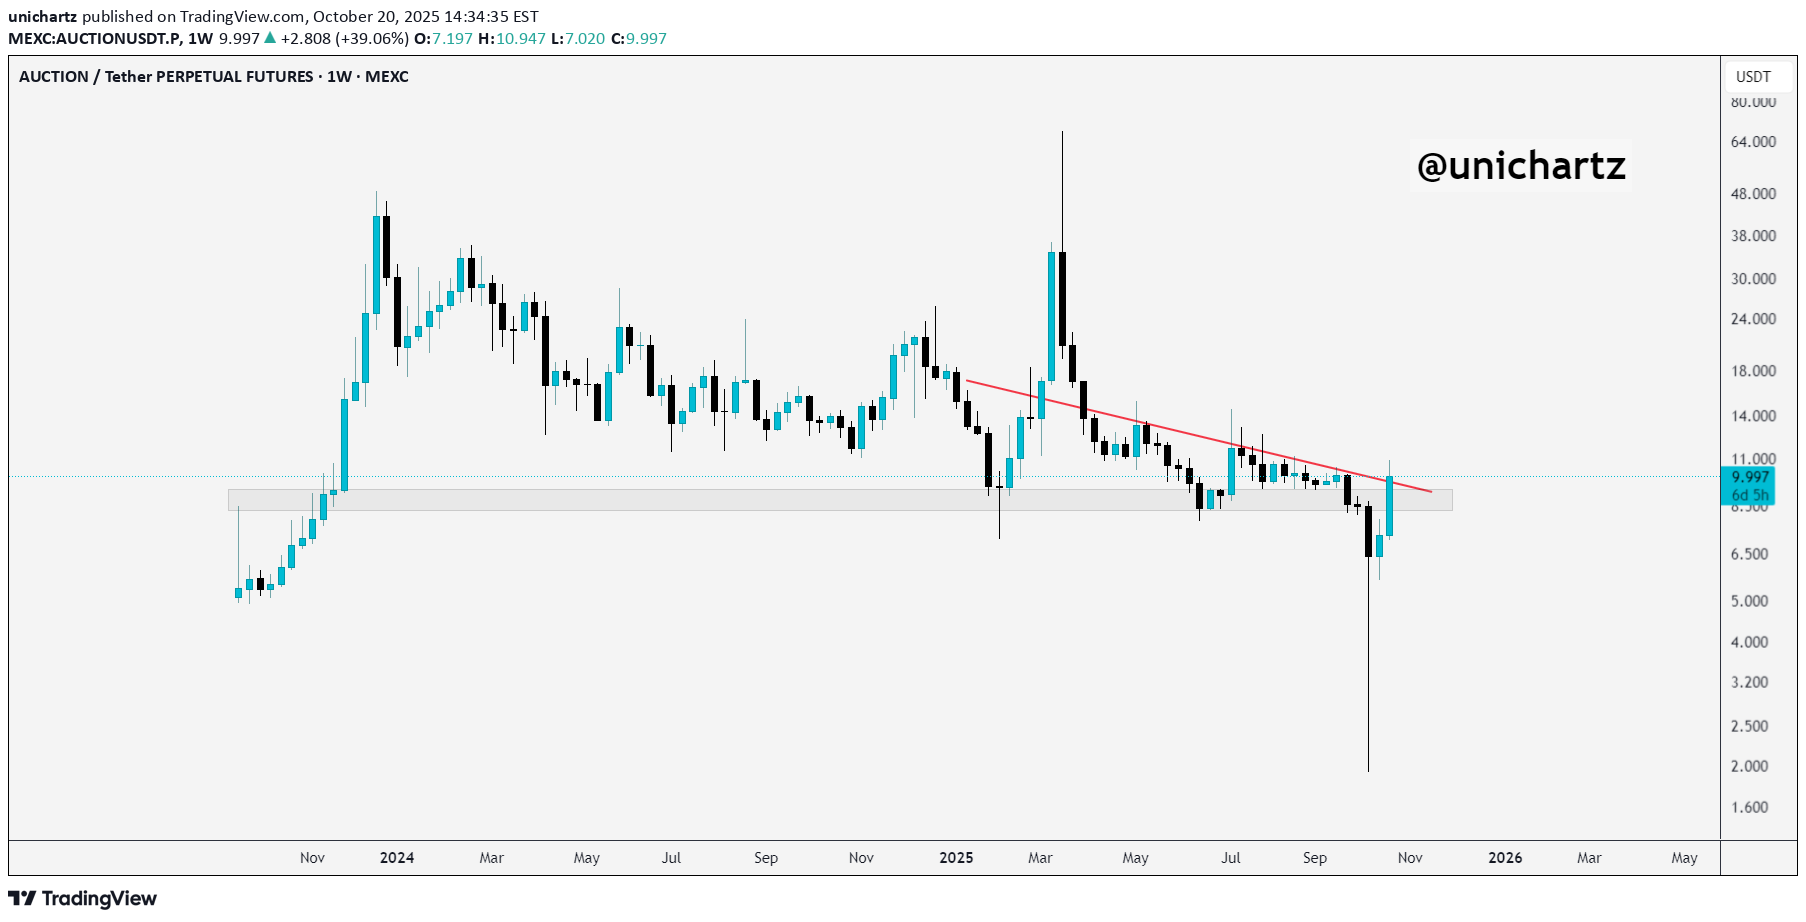
Auction/USDT Analysis: After the recent crash, $AUCTION has successfully reclaimed its support zone with strong momentum. The price has also broken above a key resistance line, a positive sign. If it manages to close and sustain above this level, we could see a potential upside move in the coming days. Keep an eye on the candle close and add it to your watchlist. DYOR, NFA #PEACE

Alpha-GoldFX
سیگنال انفجار قیمت AUCTIONUSDT: الگوی گُوِه نزولی و احتمال رشد ۱۰۰ درصدی!
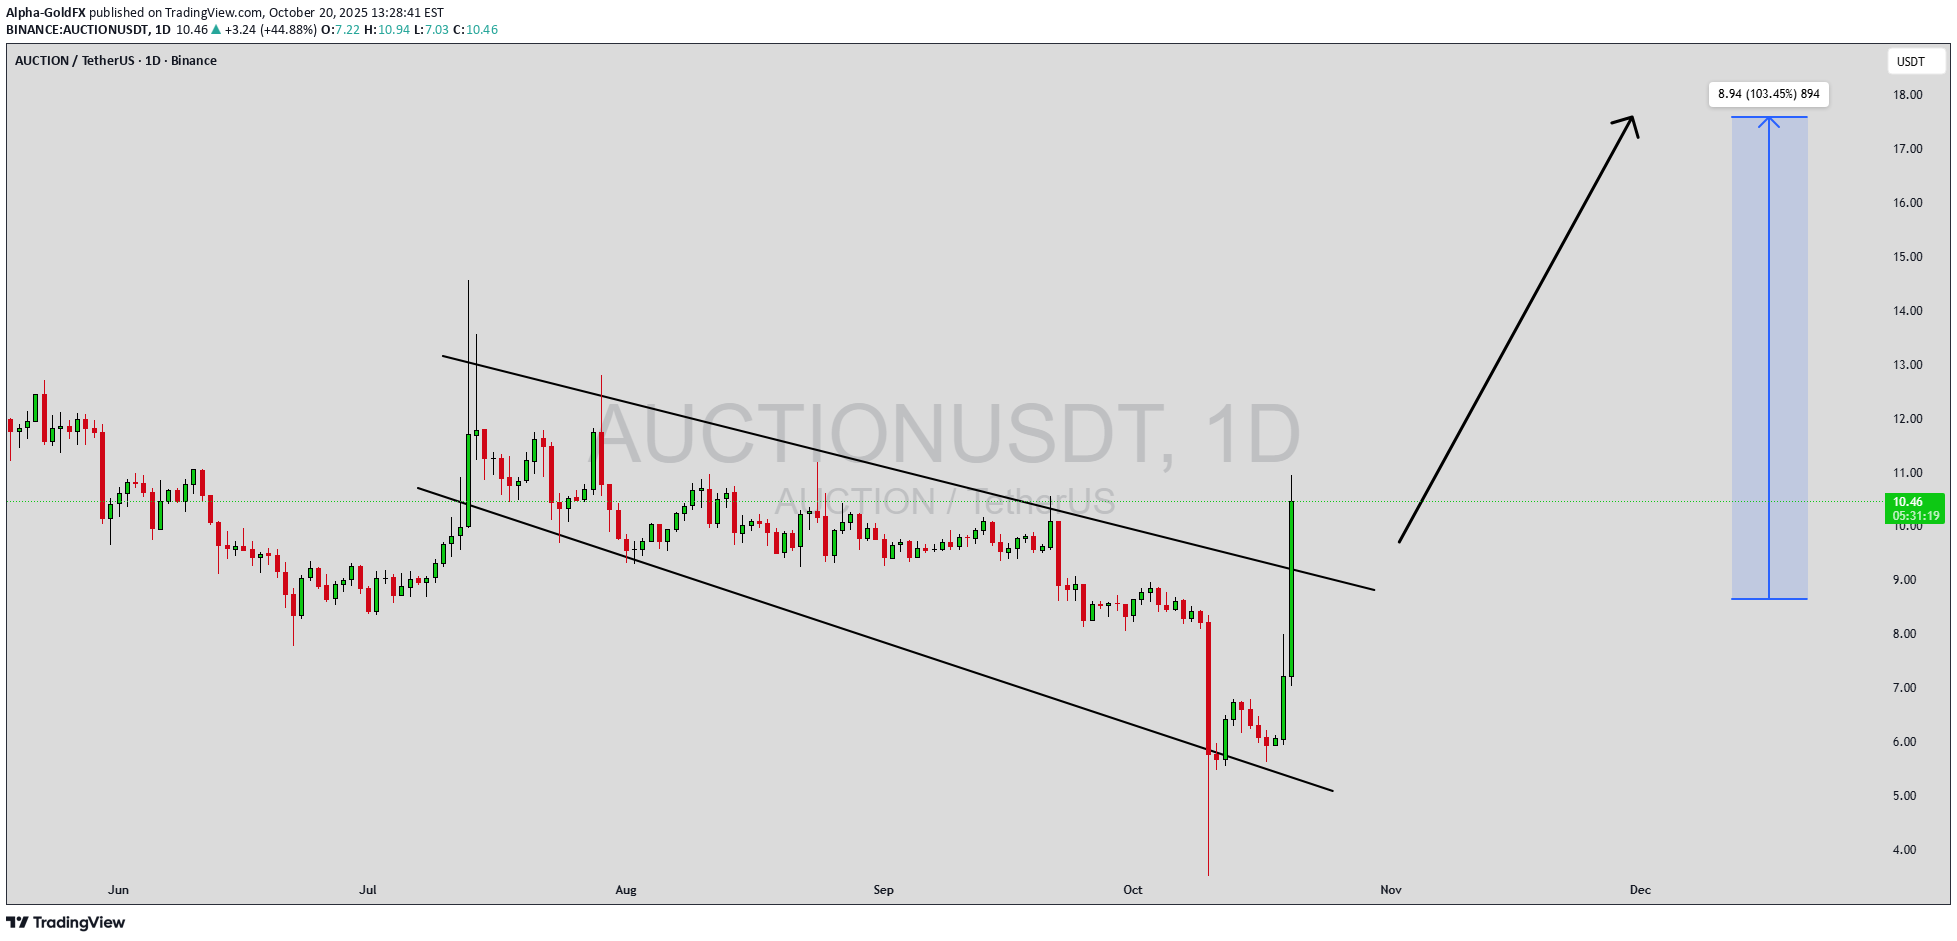
AUCTIONUSDT is currently forming a falling wedge pattern, one of the most reliable bullish reversal structures in technical analysis. This setup often indicates that the bearish momentum is fading and that a potential breakout to the upside could be imminent. The price action has been consolidating tightly within the wedge, suggesting that sellers are losing strength while buyers are gradually stepping in. With good trading volume supporting the structure, a breakout above the resistance line could trigger a strong upward rally. The falling wedge formation typically marks the end of a downtrend and the beginning of a bullish phase. In AUCTIONUSDT’s case, the technical indicators are aligning favorably — RSI is approaching neutral territory, and moving averages are starting to flatten, signaling a potential trend reversal. Once the breakout confirmation occurs, traders could expect a substantial upside move with an anticipated gain between 90% and 100%+, driven by renewed market optimism and increased buying momentum. Investor interest in AUCTIONUSDT has been picking up recently, reflecting a growing belief in the project’s long-term potential. This surge in sentiment often acts as fuel for the next major leg up, as new capital flows into the market. If volume continues to rise alongside price, it will further validate the bullish breakout and establish stronger technical support zones for sustained growth. ✅ Show your support by hitting the like button and ✅ Leaving a comment below! (What is You opinion about this Coin) Your feedback and engagement keep me inspired to share more insightful market analysis with you!

CryptoWithJames
سیگنال صعودی انفجاری: حرکت بزرگ $AUCTION پس از شکستن الگوی گوه نزولی!
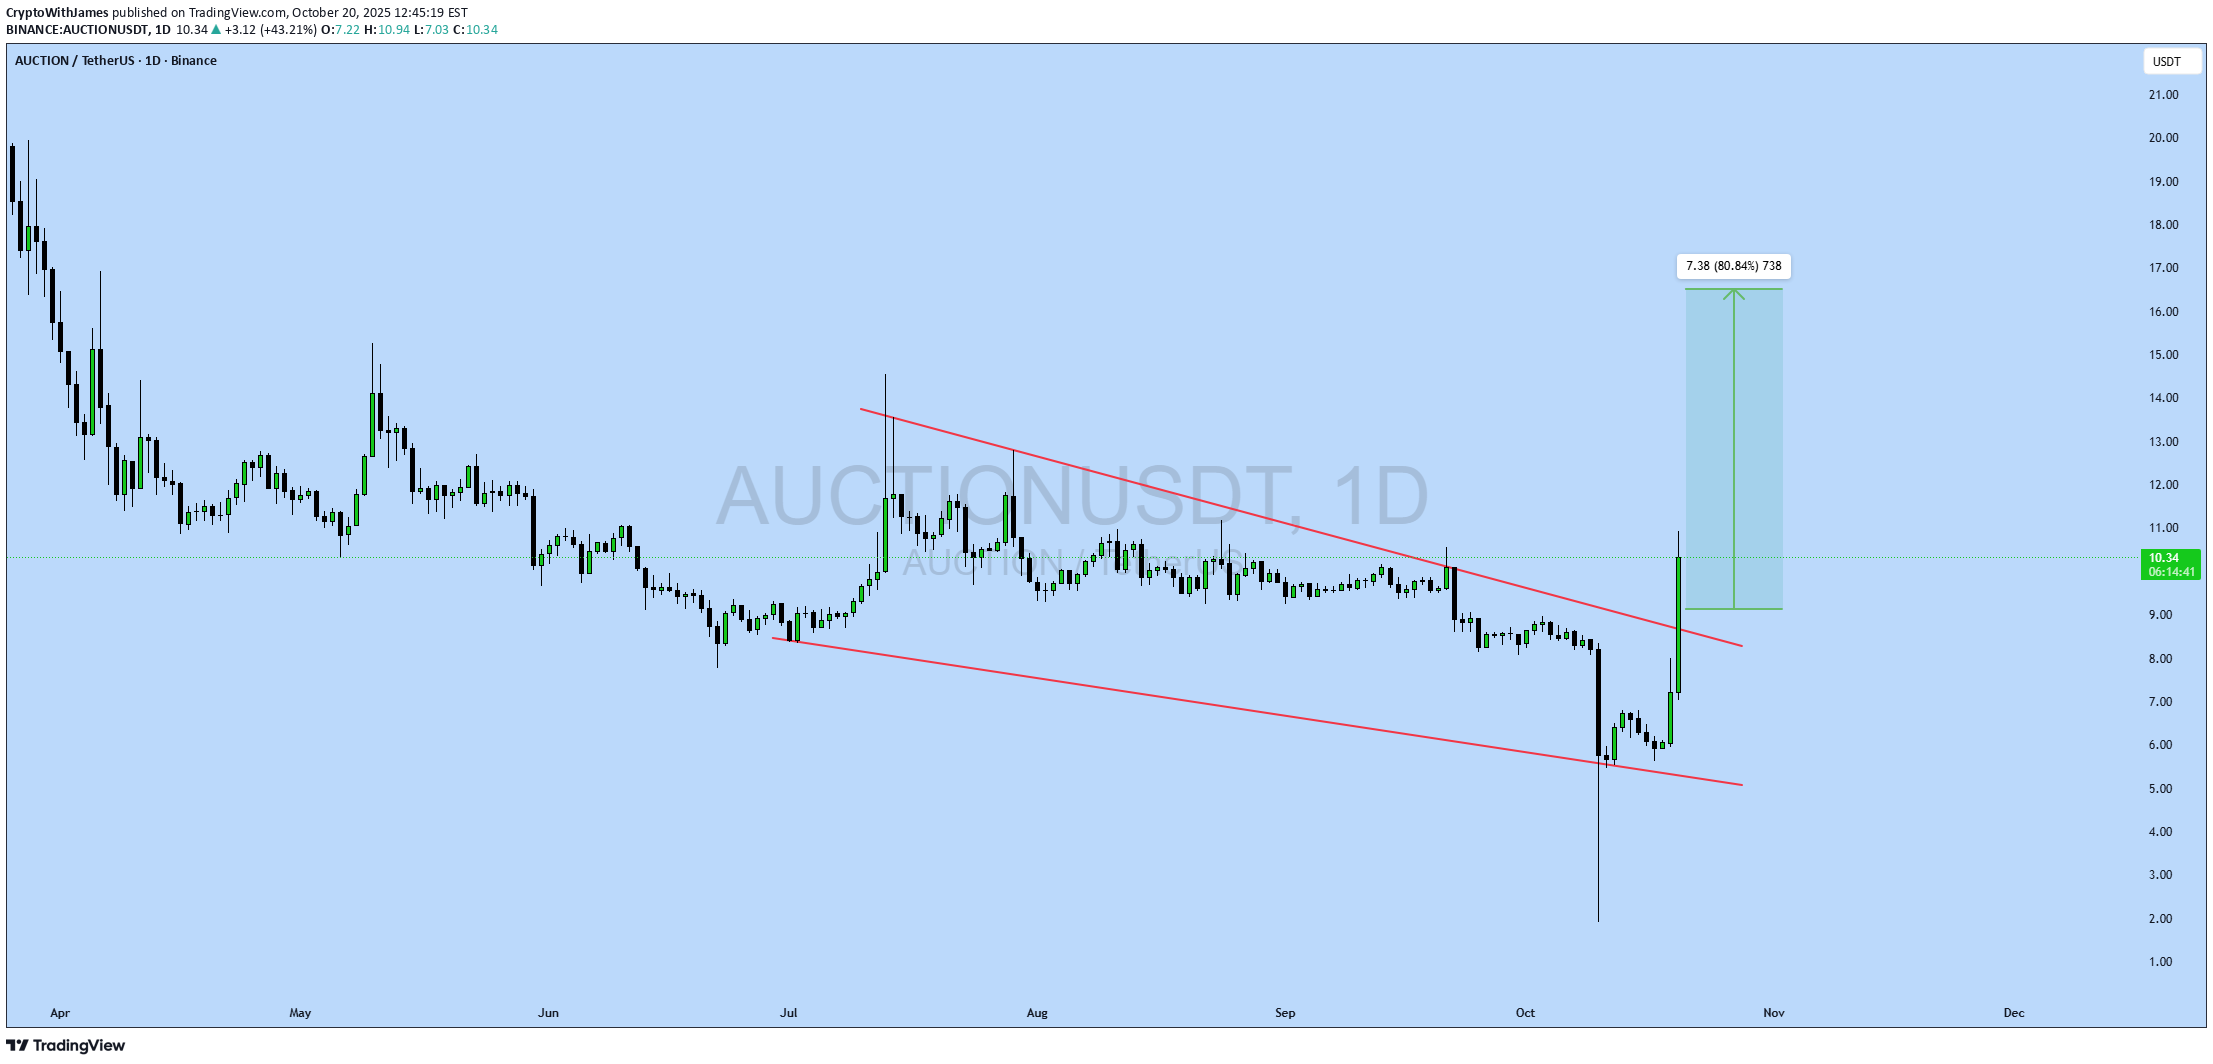
#AUCTION UPDATE AUCTION Technical Setup Pattern: Bullish falling wedge breakout Current Price: $10.26 Target Price: $17.64 Target % Gain: 80.84% $AUCTION has confirmed a strong breakout from a bullish falling wedge pattern on the 1D timeframe. With the current price at $10.26, the next potential target is around $17.64, indicating an upside of nearly 81%. This breakout signals strong bullish momentum and could mark the start of a significant trend reversal. Time Frame: 1D Risk Management Tip: Always use proper risk management.

cameraparts1701
Large upswing and 90%+ reset.
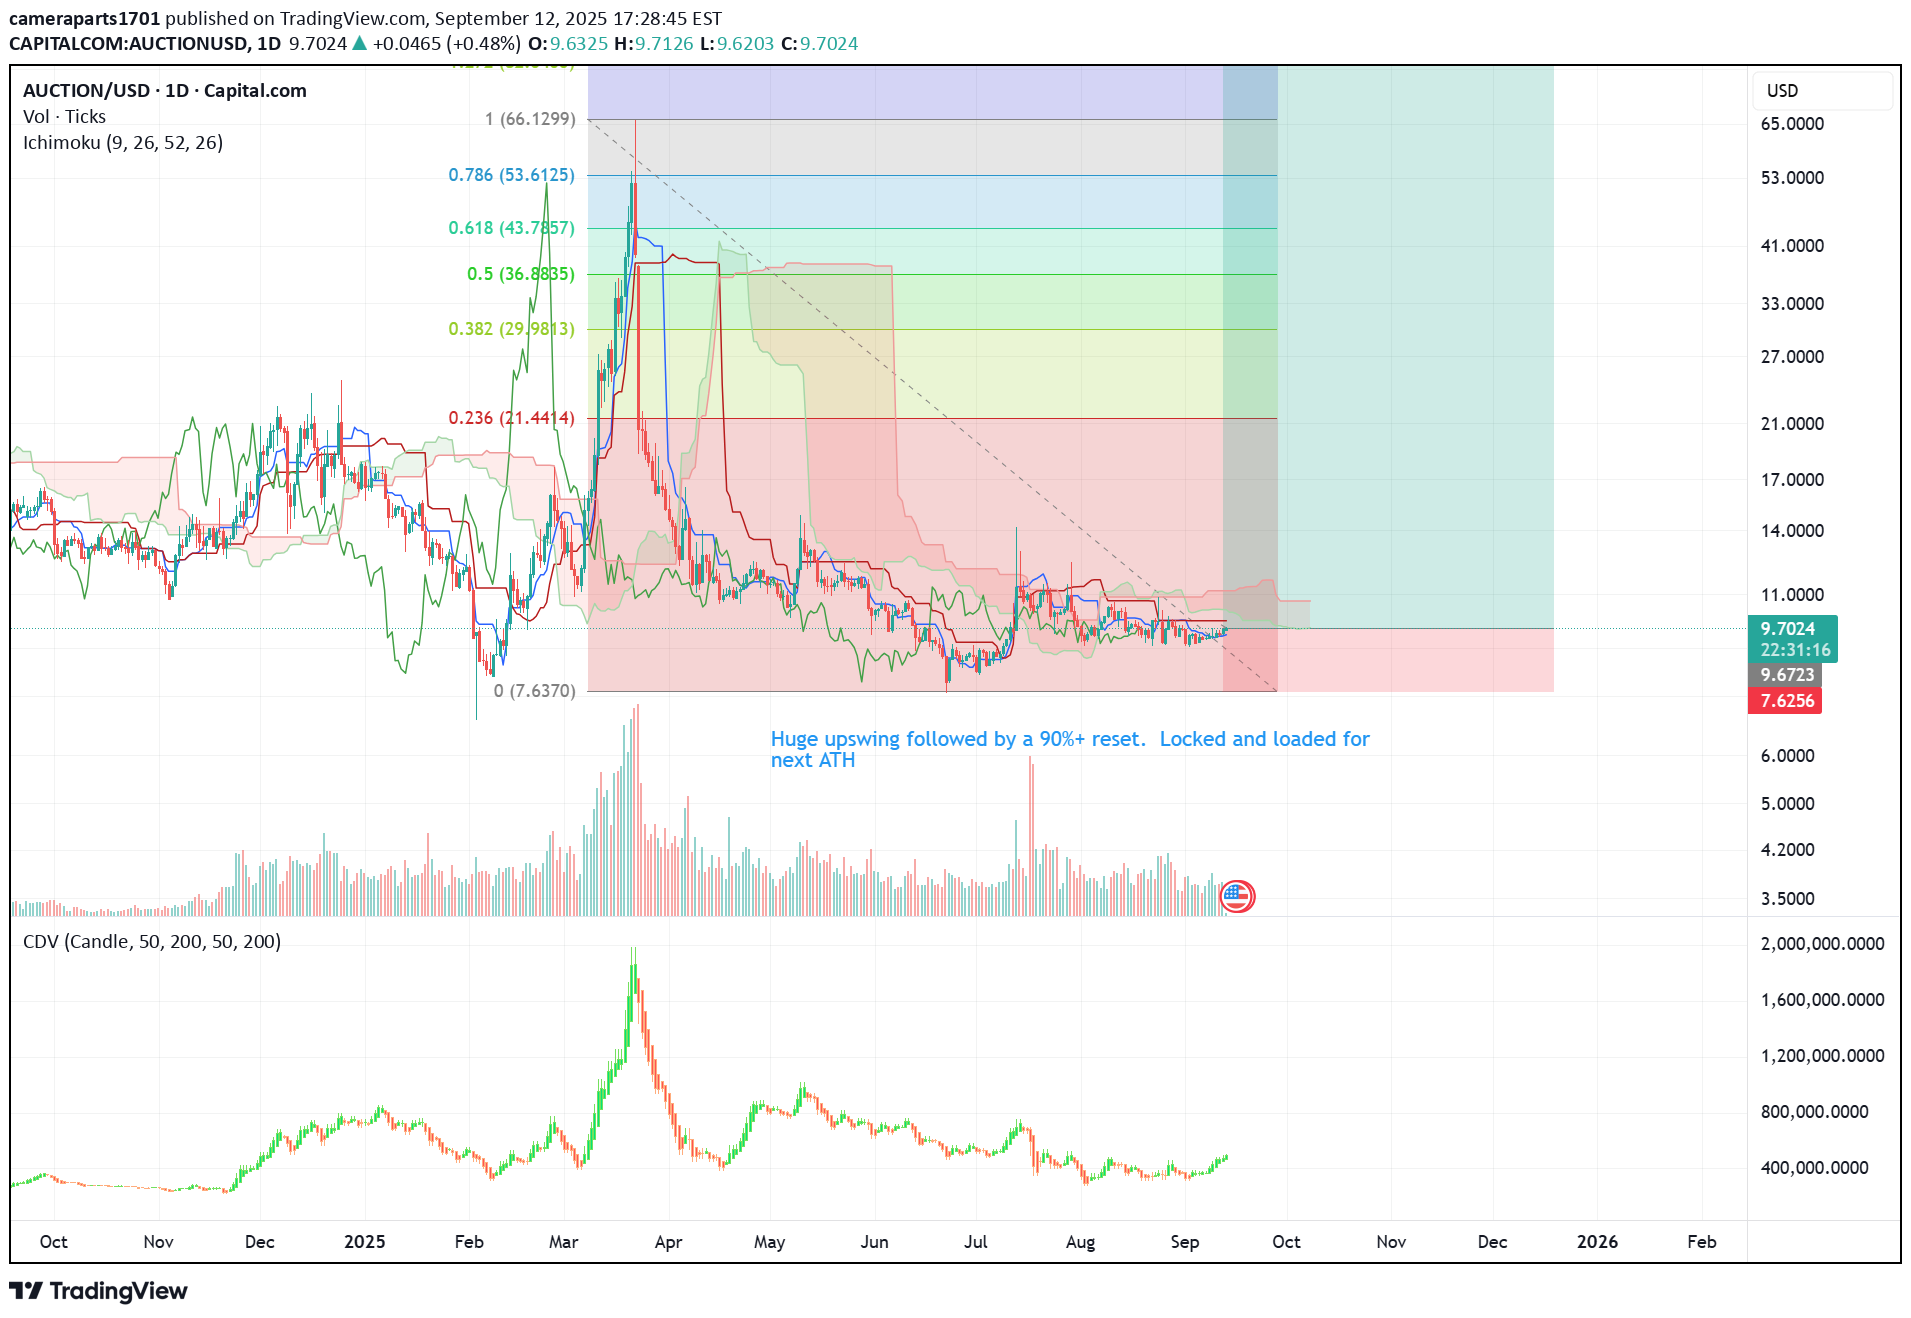
Large upswing and has undergone a 90%+ Reset. Great time to enter and hold for next all time high.Still optimistic about this, but the level was breached significantly during the large scale flash crash.

CryptoNuclear
AUCTION/USDT — Major Accumulation or Bearish Continuation?

🔎 Overview The AUCTION/USDT pair is currently moving sideways within the critical demand zone of $7.02 – $9.55 (yellow box). This area has acted as a strong accumulation level since July, serving as the last line of defense for buyers before potential continuation to the downside. The mid-term structure remains bearish, as price continues to print lower highs since the peak at $51.59. However, this prolonged consolidation opens the possibility of forming a strong base for a reversal, should buyers hold this key zone. --- 🧩 Price Structure & Pattern Main Trend (1D): Bearish → consistent lower highs from the ATH. Current Pattern: Sideways within demand zone. Potential formation of an Accumulation Base or Double Bottom (W pattern) if a bullish breakout occurs. Key Support: $9.55 → $7.02 (demand zone). Step-by-Step Resistances: $11.736 → $14.131 → $16.263. Major Resistance: $26.068 (psychological level & strong supply). --- 📈 Bullish Scenario If price holds the demand zone and breaks above $11.736, upside targets become more realistic: First target: $11.736 (minor resistance). Second target: $14.131. Third target: $16.263 (major barrier and liquidity zone). With strong momentum + volume, retest towards $26.068 becomes possible. 👉 Bullish confirmation = daily close above $11.736 with volume expansion. 👉 Entry ideas: Spot accumulation in the $7.0–$9.5 range with a stop below $7.0. Breakout entry above $11.7 after retest confirmation. --- 📉 Bearish Scenario If buyers fail to defend the zone, especially on a daily close below $7.02, the selling pressure could accelerate: Possible continuation into lower liquidity areas ($6.4 – $5.5 range). Breakdown from this base may trigger panic selling, as long-term demand zones often lead to sharp moves when invalidated. 👉 Bearish confirmation = daily close below $7.02. 👉 Entry idea: Short after confirmed breakdown and failed retest of the demand zone. --- ⚖️ Key Notes & Risk Management The $7.0 – $9.5 zone is the battlefield between bulls and bears. As long as it holds, reversal potential remains. Breakdown = bearish bias takes over. Risk management: For longs → stop below $7.0. For shorts → stop above $9.5 (if breakdown is valid). Beware of false breaks — always wait for daily close confirmation. --- 📝 Conclusion AUCTION is at a make-or-break level. Will the $7.0–$9.5 demand zone become the foundation for a bullish reversal towards $11.7 → $14.1 → $16.2, or will it collapse into a bearish continuation towards deeper lows? ➡️ Patience is key — wait for confirmation before committing. ➡️ This zone will decide the next major direction for AUCTION in the coming weeks. #AUCTION #AUCTIONUSDT #CryptoAnalysis #AltcoinSetup #PriceAction #SupportResistance #BreakoutOrBreakdown #CryptoTA #SwingTrade

SatochiTrader
AUCTION CAN SEE A SHOT TREND TO UP $14 by confirmation
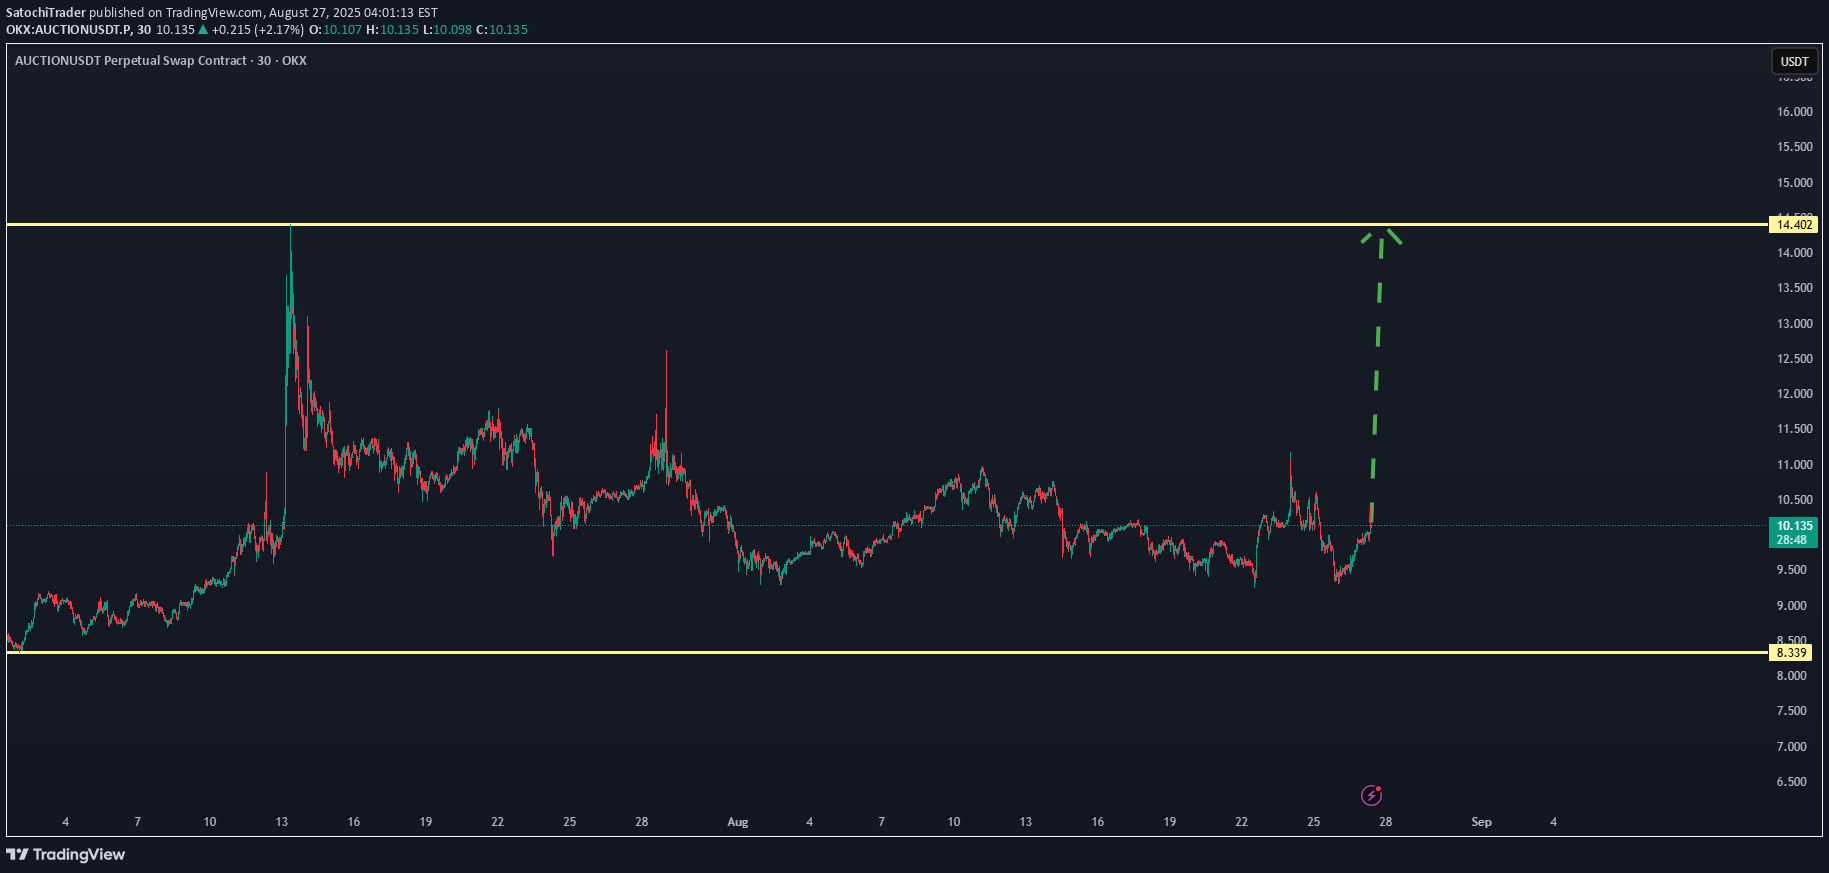
AUCTION CAN SEE A SHOT TREND TO UP $14 by confirmation AUCTION/USDT one of the coins that shows a pre-increase ( checking if it can get proof next hours). When this gets confirmed, there is a high chance ofa breakout.
Disclaimer
Any content and materials included in Sahmeto's website and official communication channels are a compilation of personal opinions and analyses and are not binding. They do not constitute any recommendation for buying, selling, entering or exiting the stock market and cryptocurrency market. Also, all news and analyses included in the website and channels are merely republished information from official and unofficial domestic and foreign sources, and it is obvious that users of the said content are responsible for following up and ensuring the authenticity and accuracy of the materials. Therefore, while disclaiming responsibility, it is declared that the responsibility for any decision-making, action, and potential profit and loss in the capital market and cryptocurrency market lies with the trader.